The EIA STEO was published recently the estimate below is based on data from that report and statistics from the EIA International Energy Statistics. The EIA expects the 2018 peak for annual average World C+C output will be surpassed in 2025.
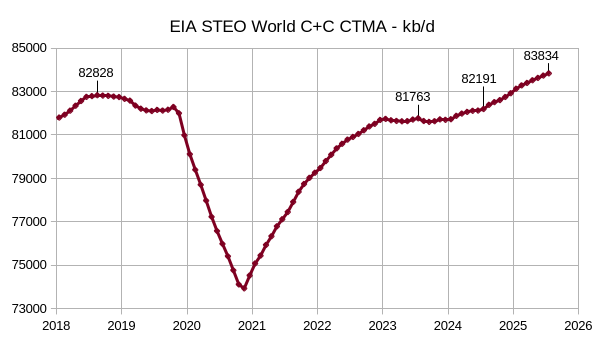
The EIA changed its method of presentation this month and now gives an estimate of World Crude output. This was compared with EIA data for C+C output from Jan 2005 to Jan 2024 so that condensate output could be estimated. I looked at the trend over the 2005 to 2024 period and simply extrapolated the trend by 23 months for World condensate output, this was added to the World forecast for crude output and is shown in the chart above. The centered 12 month average (CTMA) is presented with the July CTMA shown for selected years (2018, 2023, 2024, and 2025). In my opinion the STEO estimate is too optimistic, my expectation is about a 500 kb/d increase in average annual output in 2024 and 2025 followed by 250 kb/d on average in 2026 and 2027 with a peak in 2027/2028 at about 83.3 Mb/d.
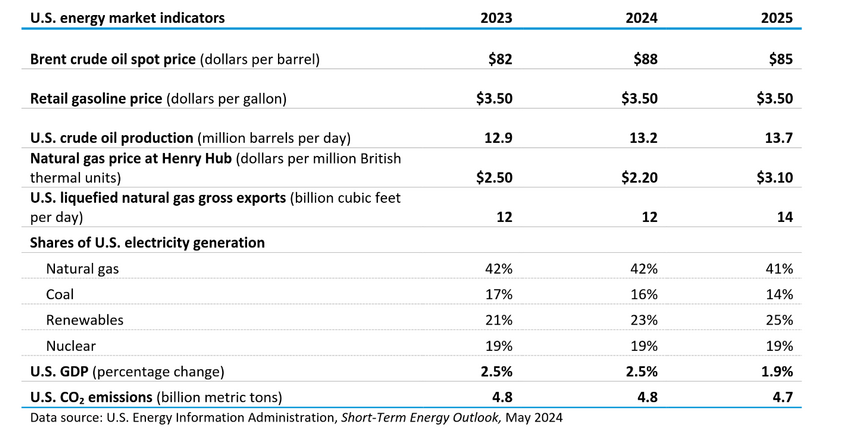
Oil prices are expected to rise to $88/b in 2024 and then fall to $85 in 2025, US oil output is forecast to rise to 13.7 Mb/d by 2025 (13.5 seems more reasonable to me). Natural gas prices fall in 2024 and then rise in 2025 with increased LNG exports from 2024 to 2025. Coal and natural gas electric power output are expected to fall while renewable output rises from 2023 to 2025. US economic growth is expected to slow in 2025.
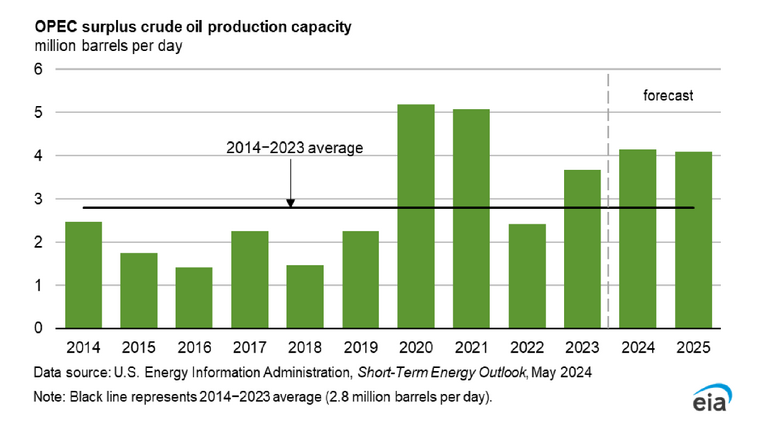
The EIA estimate for OPEC spare capacity looks high in 2024 to 2025, I would estimate it to be about 1.2 to 1.4 Mb/d less than shown in the chart above, maybe 300 kb/d below the 2014 to 2023 average shown on the chart or roughly 2.5 Mb/d.
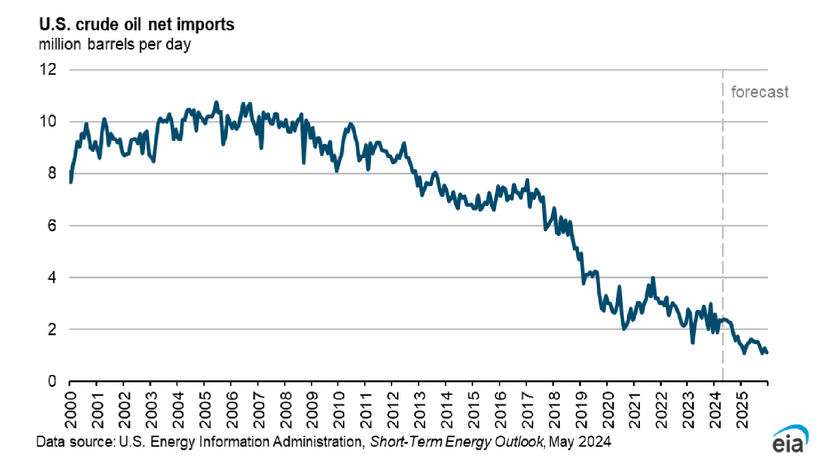
The chart above may be part of the reason the US has reduced its Strategic Petroleum Reserve (SPR) as crude oil net imports have been reduced from 10 Mb/d in 2005 to just under 2 Mb/d this past February. In February 2024, the US SPR was at about 361 million barrels and crude oil net imports were about 1.9 Mb/d, that is about 190 days of supply of crude oil net imports. Typically nations aim for a 90 day supply or about half the level held by the US in its SPR.
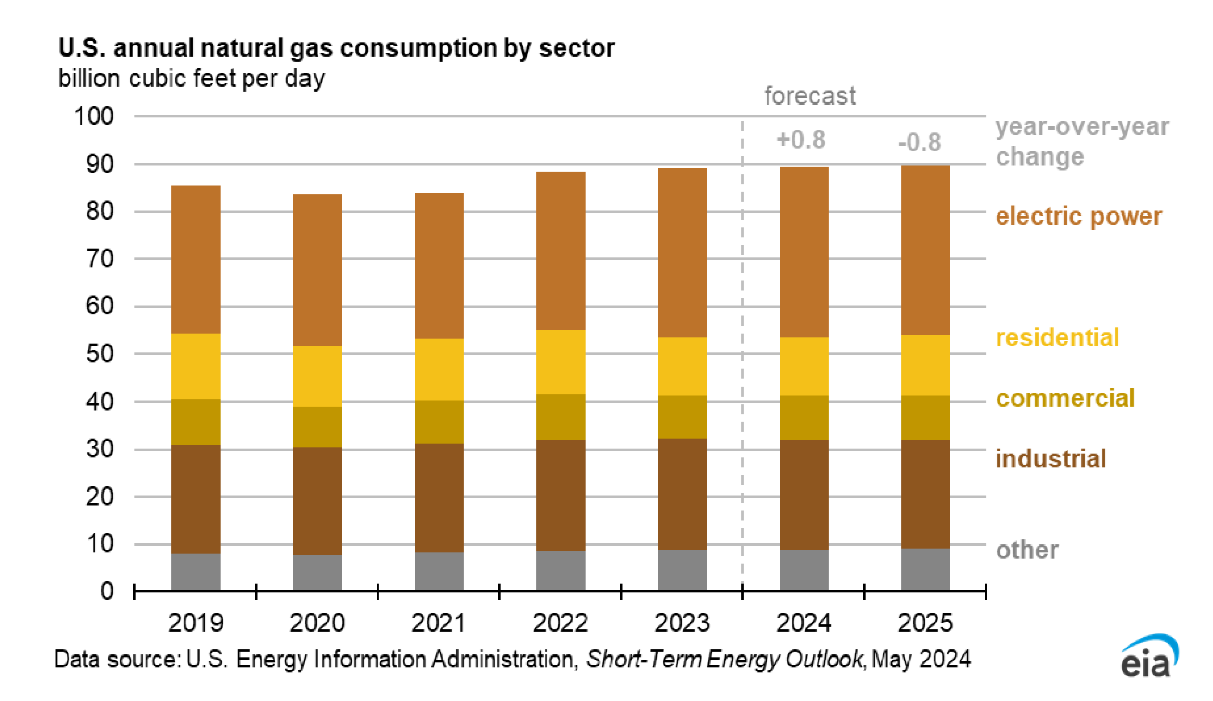
US demand for natural gas is expected to be relatively flat from 2023 to 2025.
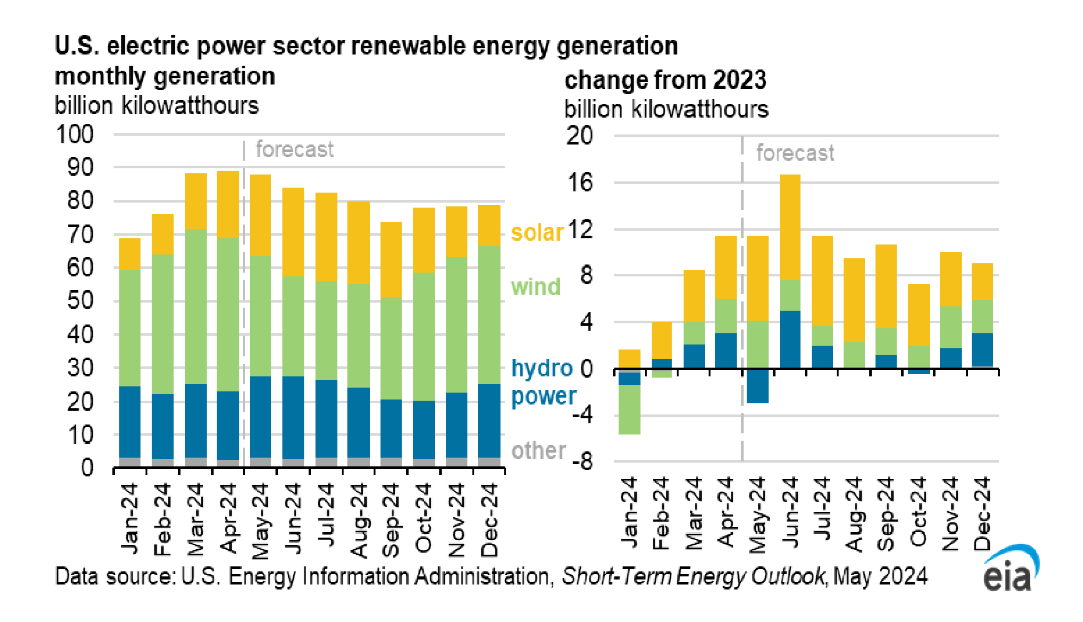
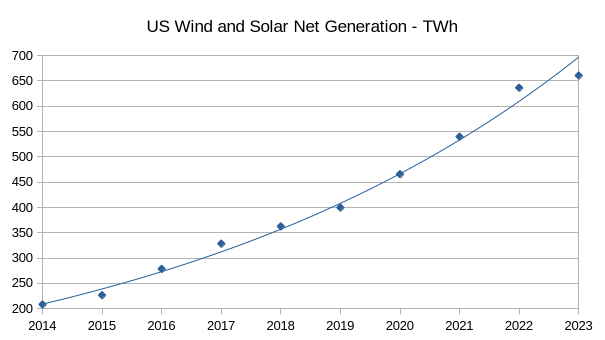
The chart above uses data from the EIA’s electric power monthly for net generation of wind and solar power from 2014 to 2023, output has grown at about a 13% annual rate with solar growing by 19.6 % per year from 2017 to 2023, electric output from fossil fuel powered plants fell by 245 TWh from 2014 to 2023 with wind and solar output increasing by 452 TWh over the 2014 to 2023 period. Total US electric power output rose by 155 TWh from 2014 to 2023 with the difference of about 52 TWh (452-245-155) mostly coming from falling hydropower and nuclear power over the 2014 to 2023 period.
161 responses to “Short Term Energy Outlook, May 2024”
Came across this recently
https://onlinelibrary.wiley.com/doi/10.1111/ecin.13169
Thank you, some very good analysis here.
Conclusions consistent with many other works. Difficulty in forecasting this resource logically examined and well explained. The linkage between peak discovery, peak rig count, peak production and the timing of effective modeling was offered in a way that I had not appreciated before.
We are staring into the abyss.
My tight oil scenario with quadratic fit to 2010 to 2033 (blue squares) data on chart. Last point on chart (red diamond on right lower corner) is 2050 with annual average tight oil output at 0.36 Mb/d and cumulative tight oil output at 78000 Mb (or 78 Gb).
Everyone better have their transportation, commercial and industrial mechanisms shifted over to electricity power by the end of this decade. There will probably be a rush to exit (purchase queue) as we approach the rapid decline phase.
Hickory,
The transition to other energy sources besides oil for transportation is the key, also keep in mind that tight oil is a small part of overall oil output (roughly 10%) and there will likely be reduced oil demand as land transport is electrified. I would say 20 years may be ok, but agree a quicker transition (10 years or less) would be better for sustainability.
Hi, Admission that following could be in error I offer it. Could existing oil shale recovery be technology equivalent to 1P in conventional recovery terms.. New efforts could recover 2P of shale in time?
https://oilprice.com/Energy/Energy-General/US-Leaves-The-Door-Open-for-Oil-Majors-to-Operate-in-Venezuela.html
I believe this link by Hickory (in the previous thread), needs to be reposted again.
The USA which is (supposedly) ENERGY INDEPENDENT (lol) has opened the door to reduce sanctions on Venezuela ( the largest oil reserves in the world ) for companies with only USA interests in mind.
That is my interpretation.
Monroe Doctrine ( not literally, but effectively the same thing )
China seems to have put Iran into their pocket, the US would be wise to consider doing the same with Venezuela.
I wonder what the US oil patch could do with Venezuela’s reserves 5 – 6 mbpd?
Sure. Build up a ton of infrastructure and then have Venezuela appropriate it. Long line out of the door of oil companies excited about that lol
Good point.
USA has ~11 aircraft carriers. ~60-70 nuclear subs that can sit out there for long periods of time.
No ship or aircraft enters or leaves Venezuela.
Venezeula has no Navy and the Aegis missile defense system would eilminate Venezuela’s ability to fire anything at them.
Venezeula’s air force wouldn’t get off the ground.
Guyana’s military is significantly worse.
Peak Oil means Peak Oil company.
That area will be significant in the future in some way or another.
Offer Maduro a golden parachute. A safe haven to retire for him, his family and his pleasure mistresses.
I don’t think the Venezuelan people like him anyway….
Give the Venezuelan people a percentage of the profits/taxes and train the citizens oil production and the surrounding industries.
Offer Venezuelans USA citizenship.
Pay them in US Dollars for equivalent skilled labor.
In exchange for the output and profit from $150 a barrel oil.
Last year I suggested that Venezuela becomes a state of the US, then every Texan oil billionaire can buy up ground just like they would anywhere else in the US.
Maduro can become governor, people will vote to become US citizens, act of congress passed, just like in Alaska, except all in 2 years.
Job done, more oil available, every capitalist happy, environment stuffed…
Hideaway is telling the Truf ( the truth).
I presented years ago that Australia should become the 51st state of America.
AUKUS Treaty!
Great job by Hideaway!
$150 oil? OPEC is sitting on five million barrels of spare capacity. If producers were actually producing what they already have, oil would be in the $5 barrel range. It’s only by the grace of Saudi Arabia that every Texas oil man isn’t on welfare. Venezuela has a bunch of shitty tar that is difficult to extract and needs long term stability to recoup investments. Given the anti immigrant fervor here in the US, I don’t see naturalizing 20 million Hispanics as US citizens to be high on the list of to do’s.
https://www.reuters.com/markets/commodities/opec-working-complex-oil-cut-extension-deal-2024-2025-sources-say-2024-05-30/
Venezuela and Guyana will play a huge role in our Post Peak Oil future.
How that plays out I got no idea.
Not sure I agree oil would be $5. But if anyone is quaified to predict oil prices it aint me.
Stephen Hren,
OPEC spare capacity is about 2.5 Mb/d, not 5 Mb/d. Also all spare capacity is in 4 nations (KSA, UAE, Iraq, and Kuwait) the rest of OPEC has declining output at roughly 100 kb/d, so for OPEC as a group the spare capacity is continually eroded by 100 kb/d per year. In 5 years it becomes 2000 kb/d, in 10 years 1500 kb/d, this assumes there are no increases in OPEC output or capacity in the future.
This is what Reuters thinks. I meant to say OPEC Plus but the website weirdly adds and subtracts plus signs for me at random, even when I copy and paste as in the segment below
“ The Organization of the Petroleum Exporting Countries led by Saudi Arabia and allies led by Russia, known as OPEC , is currently cutting output by a total of 5.86 million barrels per day, equal to about 5.7% of global demand.”
Very unlikely to be this high but their estimate is over twice yours. Regardless, even if it were 3 million, this amount of additional oil on the market would crash the price quickly.
Stephen,
Yes for some reason a “plus” symbol gets erased in comments, you have to substitute “plus” (minus quotes) for the symbol. The DOC nations might have 3000 kb/d spare capacity tops, Russia is likely producing all it can sell and won’t be able to increase until the war with Ukraine is resolved (maybe in 10 years time optimistically as long as Putin remains in power). Reuters just repeats what is claimed by IEA and EIA, they are also wrong. The true spare capacity of the DOC is perhaps 2800 kb/d as of April 2024. I agree if all of OPEC produced at maximum capacity, oil prices would fall, that’s why they are holding back output. I imagine they will gradually bring on more output if oil prices rise.
Where can I bet against a new peak? Any takers?
Betting man,
Not very confident of new peak, I would say 50/50 chance future 12 month output will be just above or just below previous 12 month peak of about 82.96 Mb/d (in August 2018 for CTMA). Not really a big deal either way in my view, a plateau around 82 to 83 Mb/d out to 2030 seems likely unless there is a lack of oil demand and low oil prices (under $85/bo in 2023$).
I agree with Dennis here. We are on the preferable bumpy plateau. I consider it very unlikely that the 2018-2019 peak will be breached. But even if it is, it will be just a spike, a short-term anomaly. We have reached the peak bumpy plateau, and we are there right now.
Thx Ron,
Not sure, but this may be a first.
I like that forecast too. I just hope we stay resilient when we hit the bumps.
Dennis,
These are fun forecasts, but let’s zoom out and admit that everyone’s forecast – yours, OPEC, IEA, EIA – are within ~1% of total production and/or demand. So it is kind of silly to think that anyone has higher predictive prowess than the others, given the tight range of predictions and the inherent uncertainty of the future.
Nevertheless, I’d like to join the fun and predict: 0.5 MMbpd rise in production for 2024 (agreeing with you) and a strong 1.3MMBpd rise in oil demand, leading to 800kbpd de-stocking for the year. (assuming that 2023 was more or less perfectly S/D balanced.)
Kdimitrov,
I agree the future is unknown, my odds of being correct are approximately zero. How do you define oil? I ignore NGL, biofuels and refinery gain and think a focus on crude input to refineries makes the most sense.
Do you expect an increase in crude input to refineries (aka refinery throughput) of 1300 kb/d in 2024? That seems high to me. The long term rate of increase is about 823 kb/d for 1983 to 2019. In 2022, refinery throughput had not returned to the 2018 level, it may be that refinery demand for crude may be slowing as the world buys fewer ICEVs than in the past.
It will be interesting to see the new data for 2023 on June 20 from the Energy Institute. Of course we will have to wait 13 months to see 2024 data, until then it is all speculation.
See
https://ourworldindata.org/electric-car-sales
and chart in next comment from link above (go to link for data)
https://ourworldindata.org/grapher/car-sales
This global data shows what has previously noted-
global ICE light vehicle sales peaked 6 years ago.
There will be no retest of the prior highs, the trend is down and down.
I wonder to what degree lower car sales are due to longer longevity of them. One dataset that would be interesting is to look at the total of all functioning cars in the world and see if that dataseries is trending up or down. I’ve poked around the there doesn’t seem to be a central database that keeps track of it.
It’s 95% pandemic effects. I don’t quite agree with this IEA data on new cars, my preferred source is ACEA. You can see much better there the big disruption in 2020, 2021, 2022 from COVID. The 2023 rebound is much better seen in the ACEA data, it is very strong, and the first 4 months of 2024 are also rebounding strongly, further.
Many people underestimate the effect of COVID, they think once the West re-opened it was all over, and everything snapped back to the “before” levels.
Kdimitrov,
Any particular reason why you think the ACEA data is better?
I agree that the progressive longevity of automobiles is playing a big role.
Also agree that the pandemic has played a role in a roundabout way- the labor market was disrupted and labor costs have not come back down. This has fueled inflation and caused the fed to raise rates. Lower (or stagnant) purchasing power/higher credit costs for many people is surely a factor. This is true in the US, perhaps many other countries as well.
Overall, I’d place a bet on global peak ICE (no plug) sales being in 2018 based on the overall combination of factors.
btw- Thank you Dennis and Ovi for the work, as always
The pandemic also caused a lot of chaos in the automobile supply chain. Chips were especially hard hit. It wasn’t just the demand side that was hit.
Here is IEA data and EIA International energy outlook (with their estimate for 2020 to 2022 data) forecast from 2023 to 2035 from EIA, this is World non-electric vehicles in millions (includes hydrogen fuel cell, propane and natural gas vehicles, electric is any plugin vehicle, BEV and plugin hybrid.)
Nearly all of the worldwide growth in car sales between 2010 and 2018 came from China, which is now the biggest car market. So with China pushing EVs hard, it’s no surprise that ICE sales are down.
Agree. It is not at all surprising if you have been following the global trends a little bit.
It may be surprising to those who think in terms of just what they see locally.
My $.02 looking at that graph is that fewer car sales is a more significant factor towards reducing GHG and petroleum intensity for transportation. For people with means spending more money for an EV premium will be a smaller number than people making do in a flat oil supply environment.
Hi Dennis,
Yes, 1.3MMbpd more crude oil consumed in refineries in 2024 than 2023. It is indeed a hefty increase, but I’m sticking to it.
On the Strategic Petroleum Reserve (SPR) I think it should be refilled promptly while prices are cheap ($less than 120/b). Hopefully it will be wasted money, with the oil never having to be used.
The authority to tap into the reserve should be taken away from the President, no matter who they are.
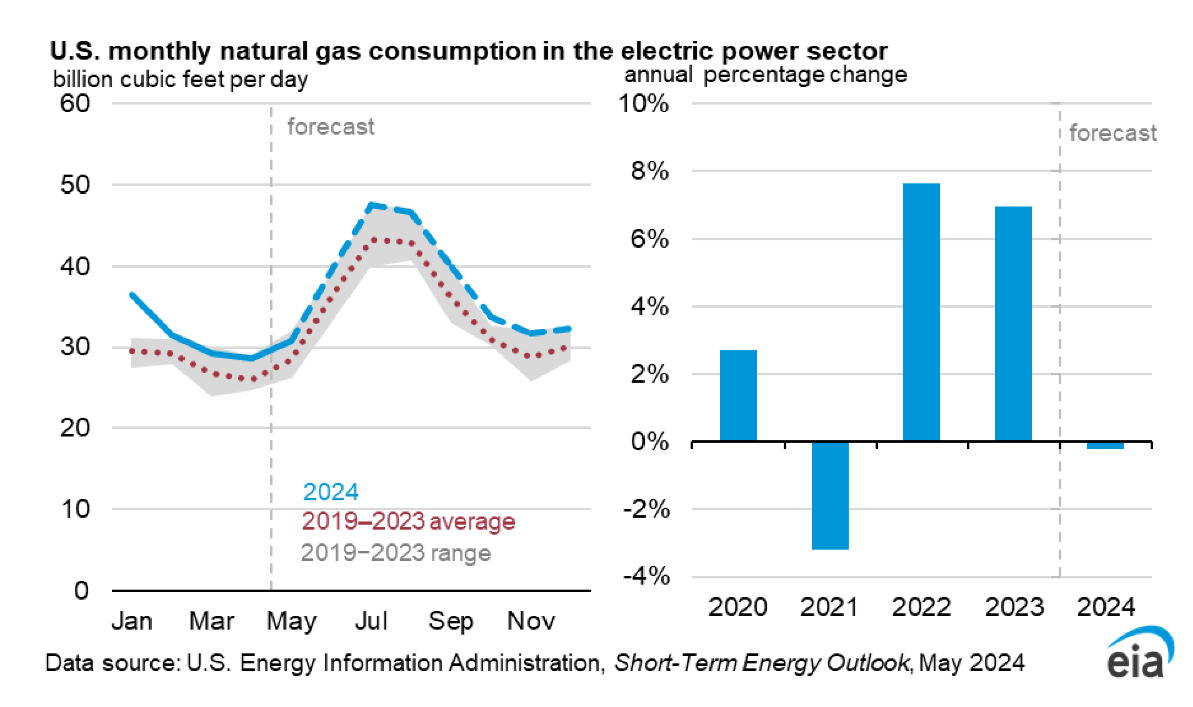
Secondly, the graph of monthly US Nat Gas Consumption in the Electricity Sector
shows the annual summer demand peak very well, reflecting the national air conditioning load I assume.
This nat gas combustion spike can easily be removed by replacement with Photovoltaic power considering the summer seasonality.
Hickory,
Yes US oil output will be decreasing in a few years so refilling would be wise. Not clear Congress would be better than president, but often Congress is dysfunctional so the oil might never be released, so maybe good for the environment.
Also concur that more solar PV will tend to reduce the summer power peak from fossil fuel, replacing it with solar power. In 2023 the non solar electric power output had about a 63 TWh difference from summer peak to winter trough, solar output peak to trough was about 16 TWh, covering about 25% of the non-solar peak to trough. If Solar PV continues to grow at 20% per year (average rate from 2017 to 2023) and overall US electricity output is flat, then the non-solar peak to trough gets covered by Solar output after 8 years of 20% growth. Also note that US non-solar output grew at an annual rate of 0.43% from 2014 to 2023, if we assume US non-solar electric power continues to grow at that rate, the peak to trough is covered by solar output (in previous example of 20% growth over 8 years). Note that I have not considered how wind will effect this analysis as wind power is added. Though wind tends to be strong in the winter compared to summer so may complement solar which is the reverse.
Dennis –
My take on all of this is very slightly different, doesn’t this essentially mean there is zero growth in the shale fields to be gained over the next 5-10 years? If so, the decline of conventional oil would be the only aspect at play and since it’s decline we should only expect decline, right?
Following 4 scenarios 21 Gb, 42 Gb (1P), 55 Gb (2P), and 75 Gb (2P+).
For an extremely long drawn plateau to happen, wouldn’t the drilling need to accelerate just to stay in the same production place (red queen)? I think we are approaching the decline side of shale Hubbert curve faster than most are realizing, I hear those sentiments from many and don’t see how a plateau continues for the next 5-10 years…maybe there is more prime acreage than many believe?
Same/similar as applied to world production….don’t see how there could possibly be 84 mbpd in 2026…
Kengeo,
The scenario has only a very slight increase in drilling to offset declining new well EUR as resources deplete. GOM output will be on roughly a plareau through about 2026 ot 2027, US onshore conventional will likely continue to decrease at about 1.9%% per year. Note the tight oil plateau is about 6 years (2024 to 2029). Well completion rate (in wells competed per month) increases from 810 wells (all of US tight oil and shale gas wells) in May 2024 to 870 wells per month in Jan 2027 an average increase in completion rate of about 2 wells per month or 24 wells per year (3% annual increase in 2024/2025). The scenario has a URR of 77 Gb as shown in chart below.
I agree the EIA estimate probably is too high, my guess is about 83 Mb/d for annual average output in 2026 for World C plus C, if there is that much demand for oil, some foresee robust demand for oil which implies higher oil prices. I think demand will match supply increasing at about 500 kb/d in 2024 and 2025 (1 Mb/d in total) followed by about 250 kb/d annual increases in 2026 and 2027, decline begins in 2028 or 2029, slow at first then gradually picking up speed after 2033.
Keep in mind that for the World we have OPEC spare capacity of 2.5 Mb/d, and Canada, Brazil, Guyana, and Norway that may be able to increase output. The recently opened pipeline in Canada from Alberta to the Pacific coast may lead to higher output in Alberta, Canada. This is how a plateau in output might be maintained for a few years as increased output from the OPEC Big 4, Canada, Brazil and Guyana offset decline in the rest of the World up to 2028 (about 5 years) from 2028 we might see marginal decline in output up to 2033 (depends in part on oil demand and the price of oil and natural gas.) Beyond 2033 my expectation is falling oil prices as demand becomes less than available supply at 2032 market clearing oil prices.
US consumption peak in 2006 (global conventional oil peak):
A better measure of oil consumption is refinery and blender crude oil net input.
https://www.eia.gov/dnav/pet/pet_pnp_inpt_dc_nus_mbblpd_a.htm
The annual average peak was in 2018 at 16969 kb/d. In 2004 it was 15475 kb/d annual average, 2006 was lower. We should follow Ron’s advice and ignore bottled gas IMHO.
Refinery and Blender net input of crude, annual data from EIA
2006 was not the World conventional peak for C plus C, that was in 2016 at 73.6 Mb/d which was about 2 Mb/d higher than in 2006 (when World conventional C plus C was 71.6 Mb/d) and 105 Mb/d higher than in 2005 when World conventional C plus C was 72.1 Mb/d.
Curious…here’s Gasoline, seems like a ~2006 peak?:
U.S. Product Supplied of Finished Motor Gasoline (Thousand Barrels per Day):
Current level is similar to 2001 timeframe…
Same story for distillates:
Peak demand plateau for the stuff. Or else the price would be much higher.
Using data from
https://www.eia.gov/dnav/pet/pet_cons_psup_dc_nus_mbblpd_a.htm
and adding the average annual product supplied for the 3 major uses of crude oil products in the US (gasoline, distillate fuel, and jet fuel), I get the following in kb/d, peak is 2018, previous peak was 2007.
The weekly data is inaccurate and is never revised, the monthly or annual data is far better and is revised as estimates improve.
I still get ~2006 using the monthly distillate data…
Kengeo,
Using the annual data, I get 2007 as the peak if we look at only distillate and gasoline (call it land transport), but 2018 is pretty close (only 7 kb/d less product supplied than in 2007, 13475 vs 13482 kb/d).
Nice chart.
Regarding gasoline, starting with 2008 you had the double whammy of a very bad recession and Obama’s new CAFE standards. Then, as things recovered by 2019, you had the major COVID disruption. New peak will likely come in the next few years, unless there is another major calamity. USA is still growing its population, it is relatively young, so mobility demand should be growing.
Keep in mind that these volumes reported by EIA do not include ethanol, that’s an additive that has been growing fast over the past couple of decades, and it explains part of the stagnation in mogas demand. Unless the US mandates 15% (which is possible) that is pretty much behind us.
On the diesel volumes, the last few years have seen remarkable growth in renewable diesel. It is now estimated to be ~ 300kbpd in the US. (200kbpd locally produced and 100kbpd imported). That’s a pretty big number, 7-8% of total diesel consumption, an it is not included in the EIA figures. For comparison, we estimated that EV have only displaced less than 100kbpd of gasoline…
I am not sure how much renewable diesel can grow from here, seems to me like a non-scalable, heavily subsidized fuel. Once that stops growing, diesel will likely reach a new peak. However, another thing to keep in mind is that many industrial machines are moving away diesel drive towards gas drive or electric drive. The fracing industry is a good example: the pressure pumps used to be 100% diesel, now it is gas and electric.
What fantasy land are you living in?
New peak? Plateau from ~2006 to 2018, current levels near 2001…around 6 years since last peak, and a future additional peak in “some number” of years?
Total oil consumed to date of ~1500 GB.
1P reserves of ~250 Gb, 8 years and change at current consumption level.
86% of the ‘easy to get’ oil has already been exhausted, it’s tar sands and shale that we are running on…
Energy landscape is changing and supply has no option but down from hear…
We can expect continued stair steps down (not some steady downward march).
Not sure how people think that sucking the dregs out of the oil basins will keep production at high levels, if a new peak were in the cards it would have already happened by now…
Kdimitrov,
I believe you are wrong on the ethanol, finished motor gasoline includes the ethanol. See screenshot below from page lined below
https://www.eia.gov/dnav/pet/pet_pnp_refp_dc_nus_mbblpd_m.htm
click on figure for larger view.
US consumption of biodiesel/renewable diesel was 255 kb/d in 2023, about 6.5% of 2023 distillate consumption, you are correct that I did not include this as part of distillate production. You are incorrect on the ethanol however, that is included in the gasoline figures.
Kengeo,
Alternatively, Mr. Laherrere and the USGS are correct and URR may be 3000 Gb or more.
In addition cumulative output at the peak in 2018 was about 1358 Gb, if we assume the peak occurs at 50% of URR that would imply at least a URR of 2716 Gb, if the peak is 2027, cumulative output will be 1625 Gb at that point which would imply a URR of about 3250 Gb. My best guess scenario has URR of 2950 Gb, probably about half way through the oil resource currently, focus on 2PCX estimates, those are far more reasonable.
Kengeo,
if we’re talking demand, there is no plateau, that’s a disingenuous way of looking at the data. there is a clear secular trend-line of growth, that was disrupted twice, as I explained. How do you explain the growth between 2011 and 2018?
The oil supply issue that you allude to is a separate issue. If the demand cannot be supplied at reasonable prices, it will go down, no question. that’s basic econ.
Dennis,
you’re right about ethanol in the monthly data source that you used. I am just used at people plotting the implied mogas data from the weeklies, which doesn’t include ethanol.
Dennis –
OPEC peak (centered) was ~2011 or so, currently only producing 80% of peak.
Is it possibly that worldwide, a peak closer to ~2006 occurred?
Is there a possibility that some/many of the oil reserves are overstated/not economic and therefore not producible? Need to treat conventional oil separately from unconventional…at this point, we know that the future peak(s) will not come, it’s been several years since covid and it’s no longer the scapegoat…
Kengeo,
see
https://www.eia.gov/international/data/world/petroleum-and-other-liquids/annual-petroleum-and-other-liquids-production?pd=5&p=00000000000000000000000000000000002&u=0&f=A&v=line&a=-&i=none&vo=value&vb=173&t=C&g=none&l=249–249&s=94694400000&e=1672531200000&ev=true
I expect the plateau that started in 2015 or so will continue. OPEC decline from 2016 or so was due to sanctions on Venezuela and Iran, OPEC cuts, pandemic and more OPEC cuts. Current OPEC spare capacity about 2500 kb/d minimum. Click on chart for larger view.
Curious that you select the data you like, include all of it.
Kengeo,
Using all of the data from
https://www.eia.gov/international/data/world/petroleum-and-other-liquids/annual-petroleum-and-other-liquids-production?pd=5&p=00000000000000000000000000000000002&u=0&f=A&v=line&a=-&i=none&vo=value&vb=173&t=G&g=none&l=176–176&s=94694400000&e=1672531200000&ev=true
I get the chart below with a quadratic fit to the data (which is silly, there is no logical reason output would behave in that way, such a curve fit should be ignored IMHO). The actual peak for OPEC was in 2016 (prior to Iran and Venezuela sanctions by US).
Looks like you are using all liquids for OPEC, only crude or C plus C should be on that chart, you can do better. Where did you find that data?
Kengeo,
Also note that all of OPEC spare capacity is in the Big 4 (Saudi Arabia, UAE, Iraq, and Kuwait). If we look at the EIA data for those 4 nations as a group from 1990 to 2023 we get the following (again I fitted a quadratic to the data and extrapolated forward to 2050, such a curve is nonsense just as before).
Kengeo,
Using EIA data for OPEC all liquids data from 1990 to 2023 and fitting a quadratic to the data, I get the following, note that this is a very ppor way to analyze this data in my view, also the focus should be on crude or C plus C.
Not sure Dennis, here’s ChatGPTs take:
Average for 2023 was ~28 mbpd:
Kengeo,
You told ChatGPT to set it to 28 Mb/d in 2023, that is GIGO, give ChatGPT accurate information and it will give better results. Maybe you should use available data.
https://www.eia.gov/international/data/world/petroleum-and-other-liquids/monthly-petroleum-and-other-liquids-production
Kengeo,
It occurs to me that you are mixing all liquids data and crude only data. In 2023 OPEC crude output (excludes condensate output) was 27 Mb/d, but if you want to use OPEC all liquids data you need to add OPEC NGL and non-conventional which was about 5.4 Mb/d in 2023 for an OPEC all liquids total of 32.4 Mb/d (OPEC estimate from April 2023) in 2023. So your guess for 2023 is about 4.4 Mb/d too low.
see https://peakoilbarrel.com/opec-update-april-26-2024/
https://www.eia.gov/international/data/world/petroleum-and-other-liquids/monthly-petroleum-and-other-liquids-production
If you prefer OPEC data you will need to wait until July 2024 because the OPEC ASB data for OPEC includes Angola which has left OPEC, or you can use the 2023 data and subtract Angola form the OPEC totals.
https://asb.opec.org/data/ASB_Data.php
Chart below has a reasonable scenario in my view with quadratic trendline fit to data and scenario for 2024 to 2040. The trendinine can be ignored, it is a randome trendline with no underlying reasoning for why we should expect a quadratic function.
Kdimitrov,
Chart below adds the biodeiesel and renewable diesel to gasoline, distillate and jet fuel. Keep in mind that younger people these days drive less than when I was young, people shop online, watch movies at home and often work from home these days so less need to drive than before. Electrification of the vehicle fleet will also take a bite out of demand.
thanks, Dennis. So 2023 is 400kb/d below the peak? New peak will be 2025 or 2026 at the very latest.
Kdimitrov,
We will see, there has not been much growth from 2006 to 2023, even if we drop 2020 the trend is pretty flat despite relatively volatile prices over this period. The long run US gasoline and distillate product supplied, centered twelve month average (CTMA). Pretty flat for past 20 years compared to previous 60 years.
Also keep in mind that the average mile per gallon for the US ICE light vehicle fleet has gone up about 20% in the past two decades.
Hickory,
The improved fuel economy started in the 1980s, so it has been about 44 years (since 1980). The CAFE standards were passed by Congress in 1975. The law actually began to take effect in 1978 with CAFE for passenger cars rising from 18 MPG to 27.5 from 1978 to 1985. Then rules were relaxed in 1986 with CAFE falling to 26 MPG for passenger cars from 1986 to 1988 then increasing to the 1985 level of 27.5 MPG in 1989 and remaining at that level until 2010. For light trucks (including SUVs) the standards were lower starting at 17.5 in 1982 and rising to 20.5 in 1987- 1989 falling to 20.0 in 1990 and rising to 20.7 by 1996, then remaining at this level until 2004. The standard for light trucks/SUVs rose to 23.4 MPG by 2010. Then cars rose to about 43 MPG by 2020 and light trucks SUV rose to 31 MPG by 2020.
More info at
https://en.wikipedia.org/wiki/Corporate_average_fuel_economy
https://www.youtube.com/watch?v=WchmGYfOcuE
3 minutes
Biden Administration to liquidate US Northeast gas reserves.
At the recomendation of GSA and bill sponsored by Texas Republican to end Obama era program to address effects of hurricane Sandy that left many gas stations empty for weeks. Also to prevent Biden from initiating a similar program w/o Congressional say so. Looks like a throwaway concession to Republicans.
“China’s Oil Demand to Peak Before 2027, Says Sinopec”
– China’s oil demand is expected to peak before 2027, earlier than previously forecast.
– China’s coal consumption will stop growing around 2025, while natural gas usage is projected to peak by 2040.
– Non-fossil energy is set to dominate China’s total energy supply by around 2045
https://oilprice.com/Energy/Crude-Oil/Chinas-Oil-Demand-to-Peak-Before-2027-Says-Sinopec.html
This is an interesting report – don’t think I’d seen before:
(The Institute of Energy Economics, Japan – IEEJ)
2024 Outlook (November 2023)
https://eneken.ieej.or.jp/data/11434.pdf
In this post by Tim Watkins, he explains very clearly why electric vehicles and solar and wind are going to have the same outcome as supersonic passenger flight. The Concorde could only exist with government subsidies, and the same will be true, solar and wind, and the subsidies can’t be given in perpetuity, because ultimately they come out of the taxpayers .
https://consciousnessofsheep.co.uk/2024/01/16/but-profit-sort-of-matters/
False analogy, since fossil fuels are a depleting resource. The concorde was not replacing or augmenting a depleting resource.
Non-fossil energy sources are highly valuable as a mechanism to (at least partially) offset the pending loss of available/affordable fossil fuel energy. And as such become more valuable over time.
JT —
Woopsie daisy the car industry has already invested trillions in this new tech.
we cannot conjure energy and resources out of thin air.
But we clearly can from sunlight and wind. For example Germany has generated about half its electricity so far this year from solar and wind alone.
https://energy-charts.info/charts/energy_pie/chart.htm?interval=year&datetimepicker=30.05.2024
I’m not making a prediction here, I’m discussing what has already happened.
But anyway this is just another ridiculous claim that money is energy and vice versa.
Renewables pass 30% of world electricity supply
https://amp.theguardian.com/environment/article/2024/may/08/renewable-energy-passes-30-of-worlds-electricity-supply
So the solar panels on my roof, batteries powering my cars and house will stop working? Glad I have a warranty!
Even with 180k miles my 2018 Model 3 still gets 290 miles to a charge…what happens to ICE vehicles when oil stops flowing to refineries? I would like to see more hybrid options with 40-50 miles of EV range…
What happens to solar panel production and wind turbine production when oil stops flowing to refineries?
The solar panels on your roof and mine will eventually stop working, they are machines that need replacing at the end of their lives.
We use fossil fuels to make the machines and we are not making any serious attempt to change this, despite the trillions of dollars spent on the non existent transition.
Solar and wind will continue to provide humanity with energy, just like they have for thousands of years, for thousands of years more, in pretty much the same way. Once the fossil fuels are no longer used from either depletion or law, then the making of the machines will also fall, with all existing ones wearing out over a relatively short period of time…
BTW of what use will your EV be when oil has stopped flowing to the refineries, and food is no longer available in the supermarkets? Will you still dare to drive it anywhere?
HIDEAWAY —
Oil isn’t a very good source of energy, though the petrochemical industry likes to call itself the energy industry. It’s too expensive to compete with coal except in niches like small islands and oil producing countries where it is sold far under market price.
Gas is better, but hard to handle and has to be flared off in vast quantities because it isn’t worth bringing to market or using locally. The shale oil fields in Texas light up like Christmas trees from flaring while importing electricity from the grid. That electricity is about 30% renewable, and the percentage is increasing quickly.
The primary use of oil is for storing energy in moving vehicles. It competes with batteries, not with wind and solar.
“What happens to solar panel production and wind turbine production when oil stops flowing to refineries?”
Oil will be flowing to refineries for a long time, and the derived products will increasingly be used for important uses rather than applications that are readily replaceable like light vehicle transport sector and optional air travel (all of it).
US March Oil Production
US March oil production increased by 77 b/d to 13,182 kb/d. However relative to the previous month’s February production which was revised down from 13,154 kb/d to 13,105 kb/d, March production is up by 18 kb/d.
Production has been flat since September 2023.
Full US report on Tuesday or Wednesday.
So does that mean that moving the goalpost really work?
???
My initial immediate thought of the numbers were that showing somewhat of an increase (even in a deteriorating environtment) is better than flat numbers, hence you make a slight adjustment of some kind…
Especially in current times. But I may be wrong, it happens.
Laplander
It means that the EIA’s estimating methodology is a bit optimistic. It is interesting to note that the EIA’s weekly estimates have been flat at 13,100 kb/d for the last 7 or 8 weeks indicating a period of slow growth.
Also missing drilling opportunities during bad weather really bites because the daily decline in the producing wells isn’t being offset with new wells daily.
Laplander
Not understanding entirely this post, but it can give me the opportunity to add some comments.
The oil market as I see it is a slippery one. At least when it comes to light and medium oil, it is pretty liquid in the sense that it can find its way to the market in most cases. Not that decline rates does not matter, but we are not done yet on the bumpy plateau. We are going to move towards a decline phase and the adaptation to that, but currently the gas pedal is on a lot of places around the world.
Permian horizontal oil rig (HOR) count down 2 from last week and down 5 since May 1, 2024. The average HOR count from July 1, 2022 to June 30, 2023 was 330. From August 4, 2023 to May 31, 2024 the average Permian HOR count was 299.
Dennis
When do we see the impact of this drop in rig count on Permian production? At this point there is no visible impact except that production is flat. How to explain this lack of production drop? Is it due to the longer laterals or more effective fracking or both?
Ovi,
There has been a gradual drop from Novembner to now, or at least less of an increase, maybe it will be more apparent by summer.
Ovi also see this comment and chart
https://peakoilbarrel.com/short-term-energy-outlook-may-2024/#comment-775842
The decrease in completions may have stopped the increase in output, leading to plateau, so there may have been an effect already,
Also note that the peak in May 2023 for rigs might result in a peak for completions 7 months later (if we assume no change in DUCs), so with the lag we would see some change around early December 2023, this is roughly when we see a slope change in Permian output (from increase to plateau for my scenario). Also note my scenario assumes an increase in completion rate, but rigs have been pretty flat, so my scenario should be revised to flat completions through December 2024.
Also note the low point for Permian HOR was reached in early October, so with the 7 month lag that shows up in early May, currently we are looking at March data, so a couple more months (again assuming little change in DUC counts).
Hi Ovi,
The scenario below assumes about 1.5 completions per drilling rig (with completions lagged by 7 months from drilling rig count). After December 2024 I simply assume the rig count remains at the May 2024 level (7 month lag from May is December, I essentially assume the rig count remains about 299 rigs for the June 2024 to May 2025 period and completions are 449 wells per month from Jan 2024 to Dec 2025. Note that I also assume average new well EUR falls at an annual rate of 3.35% in 2025 (and by about 3.4% per year in 2024).
Dennis
I think we are close to a peak in the Permian. However Lea and Eddy counties are still increasing production. They appear to be near a peak and production could start dropping in April or May.
Attached is a chart for Lea county production along with the average weekly rig count. It appears that Lea is defying gravity. The eyeball visual alignment with rig count is 3 1/2 months. All of the other counties are 7 to 8 months. Not sure why Lea is so different. We will have to wait a few months to see if Lea production starts to drop or continues to defy this new force known is Rig Gravity.
Ovi,
Note that as your rig chart shows, most of the drop in rigs in the Permian has been in Texas, I think it makes more sense to use a 7 month lag for rigs everywhere. I would also look at monthly average rig count (pushed 7 months forward) and compare with monthly output.
I agree the Permian may be at a temporary peak, rig count will need to rise if there is to be higher output in the future. Probably doesn’t happen without an increase in oil and natural gas and NGL prices.
Dennis
This how the Lea chart looks with rigs shifted forward by 7 months.
To my eye it doesn’t look as good, but it does tie up better with what is happening with production from January to March.
Ovi,
Yes I can see why you chose the smaller lag, but it makes sense in my view to stay with the 7 months that Mr. Shellman has suggested in the past. When they diverge it may be due to higher rate of DUC inventory use (in both late 2022 and late 2023 on chart above).
Longer time frame for previous scenario (Jan 2023 to Dec 2025).
The Rig report for the week ending May 31
– US Hz oil rigs decreased by 2 to 446. This is the fourth consecutive drop, down 12 from 4 weeks ago.
– Texas and New Mexico Permian were down by 1 each to 195 and 102 respectively. The Texas Permian is down 49 rigs from May 2023 high of 244.
– In New Mexico, Lea county was unchanged at 49 and Eddy dropped 1 to 52.
– In Texas, Martin added 1 to 33 while Midland dropped 1 to 20.
– Eagle Ford added 1 to 47. EF has been 46 ± 2 rigs for the last 4 months
– NG Hz rigs added 1 to 89. (Not shown)
Frac Spread report for the week ending May 31
The frac spread count dropped by 4 to 253 and is down by 3 from one year ago. The chart continues to indicate the frac spread count will bounce between 250 and 275 going forward but with a current bias trending closer to 250.
It is down down 19 frac spreads from the week ending March 1 when there were 272 frac spreds operating.
https://www.thesun.co.uk/news/28224854/ukraine-double-strike-oil-depot-russia/
Raging flames could be seen as oil tanks were blown up at the sites key to supplying Vladimir Putin’s brutal war machine.
The latest attacks of the war came as Politico reported President Joe Biden had secretly approved strikes by Ukraine with US weapons on targets inside Russia.
Britain had already permitted such strikes with its Storm Shadow missiles.
A few posts ago Dennis said my idea that Russia might respond to Ukrainian attacks on oil infrastructure
with tactical nukes was silly.
I really like Internet Dennis and appreciate his work and didn’t take it personally, but….
Exactly how is Russia supposed to respond now that its been exposed that they can’t defend their oil infrastructure and apparently US and Britain are upgrading the weaponry that can attack it….
Am I the only one that thinks it is really risky to fire USA and British missiles at Russian infrastructure?
Andre the Giant,
The attacks on Russian oil refineries etc have not been with British or US weapons, these are homemade drones produced in Ukraine. My understanding is that the UK and US weapons are being allowed to target Russian artillery that is attacking Ukraine from Russian territory. Perhaps Russia will decide to use tactical nukes, but they risk the potential for Nato to respond in kind. Putin has constantly underestimated the Western response to his attack on Ukraine and has weakened his position through his policy. Perhaps he will learn, we will see.
Also note that at the time I made my previous comment, western weapons were not being allowed to target positions in Russia, I agree that change may be a mistake.
The bottom line is that US and British forces are not using these weapons, the Ukrainians are. If Russia attacks Ukraine they should expect return fire.
” If Russia attacks Ukraine they should expect return fire”
Yes. But sit back and watch it happen, especially to something as critical as your oil infrastructure.
The USA attacked Iraq, should it sit back and expect return fire on the Permian Basin.
You know damn well, that wouldn’t happen.
“President Joe Biden had secretly approved strikes by Ukraine with US weapons on targets inside Russia.”
I have no idea if this is actually true or not.
Just jokes and entertainment for me. Thanks for your work Dennis.
Andre,
It is much more difficult to attack the US from Iraq, than to attack Russia from Ukraine. As I said the attacks by Ukraine on Russia so far have been with Ukrainian weapons. The Neptune missle from the Sun article is a Ukrainian made weapon.
https://en.wikipedia.org/wiki/R-360_Neptune
In any case I agree with your main sentiment that this is a dangerous game, the World learned in 1938 that appeasing a bully is not always the best strategy.
My understanding is that the allowed targets by US weapons to Russian soil are limited.
https://www.bbc.com/news/articles/cy770l9llnzo
As this war drags on I feel it’s only a matter of time before all pipelines leaving Russia are targeted by drone attacks.
Blow up a pipeline in 200 different places at once. They won’t be able to safely rebuild.
Since they don’t have any significant storage, wells will have to be shut in. Oil and gas exports by pipeline could go to zero.
I have read and I am in no way an expert.
But blowing up siberian pipelines would be very difficult, if not impossible to repair.
Don’t know.
However, HHH, there are countries somewhat south and southeast of Russia that would really enjoy cheap NG and oil. Primarily India and China comes to mind, but there are plenty more. Regarding pipelines, I think there is a thing in progress (maybe already finished) called the Power of Siberia? Not heading west from what I´ve read, and thus fairly hard to hit.
”Just jokes and entertainment for me”. Apparently, some atacms (?) have been fired in the area of Belgorod. Results unknown.
I meant disagreeing with Dennis. I don’t think war is funny.
”Perhaps Russia will decide to use tactical nukes, but they risk the potential for Nato to respond in kind. ” The China from whom Russians are depending would be pissed of as it would decide Taïwan to produce its own nuclear weapons. As far as i know, the answer would be the obliteration of Russian army by NATO airforces on the territory of Ukraine.
Why would that cause Tawian to develop nukes?
Taiwan should already be developing nukes if they think they can pull it off. That is one place that needs them if they want to remain independent.
China/Taiwan is a wildcard. We would have to kiss the AI bubble goodbye because the chip’s to run AI would be pushed off another 7-10 years as manufacturing would have to be moved back to the US.
All the demand surrounding AI, metals, electricity etc would be greatly reduced. Globally stock markets would get crushed.
While I think a Chinese invasion of Taiwan would be short term bullish for oil prices. I don’t think it would last long. It would likely lead to a global depression. Global trade would be reduced greatly.
If Russia uses nuke on Ukraine, Taïwan will think that since a nuclear power is able to use nuclear weapon outside the scope of strategic defense on a non nuclear country, in order to protect themselves of China, they will have to produce nuclear weapons as the fact to be a non nuclear power is no more a protection against nuclear strike. As they have a bunch of vectors to carry nuclear weapons, China would be stopped in any attempt to seize TaÏwan.
https://www.dailymail.co.uk/news/article-13488935/Kremlin-warns-fatal-consequences-America-footage-shows-use-missiles-destroy-military-targets-inside-Russia.html
Kremlin warns of fatal consequences as allegded USA missile used inside Russia.
OPEC+ extends oil output cuts into 2025
The Organization of the Petroleum Exporting Countries and its allies — a group of leading oil producers known as OPEC+ — agreed Sunday to extend a voluntary production cut of 2.2 million barrels of crude oil a day into 2025.
The cuts, first agreed in December, were due to expire at the end of this month. They came on top of previously agreed reductions of 3.66 million barrels per day announced in 2022 and 2023 as the group — led by Saudi Arabia and Russia — tried to counter slowing demand and rising output from the United States.
The group also released its 2025 production requirements for member and nonmember countries, which were essentially the same as this year’s. The United Arab Emirates’ production quota increased by 300,000 barrels per day. The uptick “will be phased in gradually” from January through September 2025, the group said.
Despite the OPEC+ cuts, equivalent to about 5.7% of global crude supply, and ongoing tensions in the Middle East, global oil prices have fallen by about 10% since hitting a five-month high in early April.
The price of Brent crude, the global oil benchmark, traded at $82 a barrel on Friday, down from $91 in early April when a suspected Israeli airstrike on Iran’s embassy in Syria sent jitters through oil markets.
The price of West Texas Intermediate crude, the US benchmark, has dropped from nearly $87 per barrel to $78.
The above is about half the article. Click on link to read the rest.
not entirely correct. The voluntary cuts will start tapering in October of this year and continue through 2025.
This agreement was made today, Sunday, June 2nd, at OPEC headquarters in Vienna. It overrides any previous agreements. The voluntary production cuts will remain at 2.2 million barrels of crude oil a day into 2025.
Ron
The agreement today is to unwind the 2.2 Mb/d cut.
“Moreover, these countries will extend their additional voluntary cuts of 2.2 million barrels per day, that were announced in November 2023, until the end of September 2024 and then the 2.2 million barrels per day cut will be gradually phased out on a monthly basis until the end of September 2025 to support market stability as per the attached table. This monthly increase can be paused or reversed subject to market conditions.”
https://www.opec.org/opec_web/en/press_room/7339.htm
OPEC Plus to Increase Production Starting in October 2024
Attached is a table that shows the OPEC Plus countries that are allowed to increase production starting in October 2024. I have checked the June/Sept starting production levels against a table from the IEA. The production levels are consistent with the IEA numbers except for Russia.
Russia has an October 2025 target much is the same as the IEA reports for today, 9,450 kb/d. However it is 500 kb/d lower than the original target of 9,949 kb/d, lower right hand corner in the table. I think this is to make up for their current over production. Will Russia really try to decrease production?
Note Saudi Arabia will undo their 1,000 kb/d production cut starting in October 2024 at a rate of 83 kb/d/mth.
https://www.opec.org/opec_web/en/press_room/7339.htm
Attached is a chart which shows how the increases will phase in between October 2024 and September 2025.
Thanks Ovi.
I think if this plan is followed we may see oil prices fall over the Sept 2024 to Sept 2025 period. Depends of course on demand.
Dennis
Yes it is all about demand and they have retained the option to stop the unwinding. Attached is a pretty good article explaining the three different cuts.
“The return of this third set of voluntary cuts is not a foregone conclusion. The group noted that unwinding the cuts could be paused or reversed subject to market conditions.
“We maintain the choice that we could pause or could reverse. This is not new, we’ve been doing it over the last three years and I think it has proven to be effective,” Saudi energy minister Prince Abdulaziz bin Salman said following the announcement of the deal.”
Did you see the Lea chart I posted after your Permain projection above?
https://www.argusmedia.com/pages/NewsBody.aspx?frame=yes&id=2574067&menu=yes
Ovi,
Now I have and I responded, I doubt OPEC follows that plan, seems demand is kind of soft lately. To me an increase at about 800 kb/d or less per year would be more sensible, so ramp up at about 67 kb/d per month for OPEC plus nations that are capable of increasing output (most of this will be from OPEC Big 4). The ramp up would be less steep and would take about 28 months rather than 12 months, even this steep a ramp may be too fast with future demand possibly declining (800 kb/d is the historic rate of increase from 1982 to 2019 for C plus C demand, with more BEVs and plugin hybrids sold each year this rate may decrease from 2024 to 2030). If 14 million plugin vehicles are sold Worldwide in 2024 and replace ICEVs this could potentially reduce the demand increase by 300 kb/d from historic rate to about a 500 kb/d increase.
Ovi,
This total is only for the eight countries that are reversing their vol cut, right?
I have OPEC+ at ~ 43.5 MMbpd by next October, which includes ~ 5MMbpd of Iran/Venny/Libya, which don’t have set targets.
Kdimitrov
That is correct. It is only for those 8 that promised the 2.2 Mb/d cut. Below is a summary of the best I can figure out from what I have read and dug out this morning.
– In October 2022, OPEC + agrees to a 2 Mb/d cut.
– In April 2023 nine members agree to voluntary production cuts of an additional 1.66 million b/d from May to December 2023. This includes Russia’s previously announced unilateral cut.
– In November 2023, several members of the Organization of Petroleum Exporting Countries (OPEC) and its allies, known as OPEC+, announced on Thursday additional voluntary cuts by around 2.2 million barrels per day (bpd) for the first quarter of 2024.
The total reduction is 5.86 Mb/d. The big problem is that no one knows Russia’s current actual production. According to Argus and the IEA, Russian crude production is currently 9.3 Mb/d which is 0.32 Mb/d higher than what they are supposed to be currently producing according to the table above, which is 8.98 Mb/d. If Russia continues producing 9.3 Mb/d, it will come into compliance in June 2025, according to the above table.
Not knowing what will happen with Russian production, attached is a chart showing how production from the other 7 countries will increase. Their total production increase will be 1.94 Mb/d.
Is 5,86 Mb/d the figure of the collective oil production decline?
Jean
Cut #1: 2.0 Mb/d
Cut #2: 1.66 Mb/d
Cut #3: 2.2 Mb/d
The 5.86 Mb/d is the total of all 3 OPEC production cuts. It is the last cut that is being reversed, slowly and Maybe depending on how prices hold up.
Opec continues its policy of making it hard for anyone to hedge ahead at good prices.
Apparently German e-car owners are disappointed due especially to “rising electricity prices”.
Recently we reported here that the German e-car industry was “a crisis headed for a catastrophe” and that sales were plummeting.
Q1 2024, EV sales declined some 14.1% compared to Q1 of 2023.
e-car targets now a fantasy
Meanwhile sales of conventional engine cars have risen strongly over the same period. According to Blackout News, the share of electric cars sold from the entire automobile mix was just 12.2 percent. and new e-car registrations in the current year are “down significantly”.
Customers overall remain wary of e-cars and no sales boost is in sight. This means Germany will fall far short of its electric car targets.
According to Renate Köcher from the Allensbach Institute for Public Opinion Research: “In the long-term trend, e-mobility has always been in the minority, but now we have reached a new low.”
What really happened in Germany is that there was a subsidy for EVs in 2023 and it had to be suddenly dropped in December after the opposition sued the government.
Gasoline costs nearly €1.90 a liter, about $8 a gallon, so an electric drive train is still quite attractive, especially since lots of Germans use solar to charge their vehicles.
Electricity is round about 40 cents/Kwh, so not cheap, too. And solar roof loading is for the green better earning people in the suburbs – those who already have lot’s of electric cars. That’s why it is stalling now.
40 cents will get you about 4 miles, so it’s 10 cents a mile, roughly. Where I live it’s more like 30-35 cents.
https://www.quora.com/How-far-would-an-electric-car-on-average-go-on-1-kwh-of-electricity#:~:text=On%20average%2C%20most%20electric%20cars,on%201%20kWh%20of%20electricity.
$8 is 80 times ten cents, so you’d need to get about 80 miles to the gallon to match the price of an EV even in Germany, where electricity is very expensive. That’s something like 3 liters /100km. Not a lot of vehicles do that. The average German car consumes more than 7 liters per 100 km.
There are about 13 million single family houses in Germany and about 2.6 million solar installations. So even if all of them were on houses, which they aren’t, 80% of the houses would still be without solar.
All these numbers are rough but easily checked.
Germany is the outlier. Their car industry will figure out affordable EVs or go bankrupt.
“This year EV sales in China, the world’s biggest auto market, are projected to hit 10 million vehicles, roughly 45% of all car sales in that country. In the United States, the world’s second largest auto market, EV sales are forecast to rise 20% compared to 2023, hitting roughly 11% of all new car sales. And in Europe, the world’s third largest auto market, EV sales could rise 10%, composing 25% of total sales.”
https://www.forbes.com/sites/energyinnovation/2024/05/19/the-vibes-lie-electric-vehicles-accelerate-toward-50-of-global-sales/?sh=57ce9a9a3bce
An industry already on the ropes is not going to cut prices to match Chinese output. There’s a reason the EU and US are fighting imports of Chinese EVs.
Kleiber,
They will be competing with Chinese exports in the rest of the World so their export markets for autos outside of OECD will dry up.
Quite possibly yes. Japan and Germany could both see their auto industries disappear over the next decade
Stephen,
With the possible exception of Tesla, the same can be said of the US, though possibly protectionism may allow some European, US, and Japanese companies to survive. The Koreans are producing some EVs and may also not allow Chines imports.
As China starts exporting BEVs and plugin hybrids we may see plugin vehicle sales increase Worldwide.
China is starting to sell in India
https://www.scmp.com/opinion/asia-opinion/article/3264375/why-india-shouldnt-try-shut-door-chinese-ev-makers
I imagine they will do the same in the rest of South Asia, Southeast Asia, South America, and Africa.
WTI and Brent are both down fairly big today $74 and $78. Without some geopolitical event or a lot more bombing of Russia oil infrastructure. Oil prices are going lower.
Looks like traders are not excited about more oil coming on the market just as the summer driving season ends. OPEC may have to rethink.
The heavy drivers are the ones going EV first, not the average driver. It makes more economic sense. Imagine the analogy of a local real estate market, say a medium-sized city. Think of what would happen to the average price if just 2-3% of the most expensive properties were permanently taken off the market? That’s what’s happening with gasoline demand.
I agree, taxis, buses and delivery vans seem like the best markets for EVs.
yes, $70-80 price range is not a low price for oil. It is mildly stimulative for non-OPEC supply and mildly suppressive for demand in non-OECD. The Saudis cannot really get to their $90+ target unless they cut deeper and for longer.
Kdimitrov,
If we assume oil at $70/b and NG at $2/MCF (currently it is about $1/MCF for W Texas spot prices) and NGL at 30% of oil price, at a 10% nominal annual discount rate the discounted net revenue for the average Permian basin well is about 11.36 million for a well whose capital cost is over 12 million. We will see Permian basin output decrease at oil prices, NG prices and NGL prices at these levels. If the oil price remains at $73/b the wells barely break even, with the well paying out at about 62 months (assuming 12 million capital cost). Mr Shellman looks for a well to pay out in 36 months for an acceptable rate of return and we need $82/bo at refinery gate, $2/MCF for natural gas and $23/b for NGL to achieve a 36 month payout for the average Permian well.
In any case $70/bo does not cut it.
As to whether we see demand stimulated at $75/b, that remains to be seen, we have very different opinions on future demand, it will be interesting to see how it plays out. What is your opinion on future oil prices (in 2024) to stimulate the 1300 kb/d increase in demand that you expect in 2024?
Hi Dennis,
I was referring to OPEC, and mostly Saudi’s decision to reverse some of the cuts, I think it is premature, considering their price target.
The Saudi’s supercycle thesis – which I more or less buy – is that there hasn’t been enough Big Capex to bring the next Big Play, like North Sea or U.S. Shale, so they should be in the driver’s seat to control prices. They also think that because of that they can get a $90+ price which they need for MBS white elephant ambitions.
Now, that thesis finds some support among oil analysts, but is not at all the accepted gospel in the financial sector. There are a lot of competing narratives like your “Peak Demand” thesis, “hard landing and recession” thesis because of restrictive monetary policies, etc. So for oil to be bid to $90+ OPEC needs deficits of 2MMbpd, which is what you and I agree on, and which is what they project for Q2 and Q3 in their MOMRs. So you can see the thinking behind the cut reversal being “the upcoming 2MMbpd draws will drive price up to our target, and then we can add production in Q4”.
What I am saying is that this particular math is wrong. The price now is relatively high, which stimulates some non-OPEC supply and represses some price-sensitive non-OECD demand. So to me, a more realistic scenario for 2024 is a deficit in the order of 0.8 MMbpd (demand +1.3MMbpd, supply +0.5MMbpd), which is not enough to lift prices.
Even if you buy the supercycle thesis, there is short-cycle Small Capex that brings additional supply at $75+, such as starting-up strippers, secondary/tertiary floods, refracs, infills, etc. The Saudi target is too high, they are withholding barrels waiting for $90+, but in the meantime these barrels are getting supplied by these smaller projects, which pushes their deficit and price targets further out.
Regarding your points about the Permian, here’s an interesting figure from NOVI Labs, for Midland basin only. There are plenty of locations that can make money at $75. However, I think the Permian is in now in maintenance mode until Matterhorn comes online and gas prices tick-up a bit. There is really not much incentive to do much at the moment. Then again, in Q4 when Matterhorn is online, gas is higher due to seasonality, oil price is say $80-85, I expect the Permian to activity to pick-up, just when OPEC starts to reverse cuts, again sabotaging the Saudi target of $90+
Bottomline is that even if the Saudi thesis is correct they need to maintain or even deepen the cuts for quite a bit longer, maybe into 2026, to get their $90+, all else being the same as now.
https://x.com/tedcross/status/1796525678147326326
Kdimitrov,
I think there will not be much non-OPEC supply at $75/bo, based on what Mike Shellman and Shallow sand have said there is not likely to be much US growth in output at current oil and natural gas prices, also there is a glut of natural gas in US market, perhaps more gas pipeline to Gulf coast to export natural gas will raise NG prices, though these pipelines may be bad investments because it will be difficult to maintain Permian output unless prices go up. I expect in the short term prices may increase, but not with the increase in output that DOC is planning. It will be interesting to see if supply grows more slowly with the lower prices we are seeing, it could be that Canada, Guyana, and Brazil increase output more than the coming decrease in US output. Oil demand in 2024 might be as strong as you predict (1300 kb/d increase), EIA thinks demand will increase by 900 kb/d (all from non-OECD), my guess is perhaps a 650 kb/d increase in World oil demand in 2024. Note that the EIA only expects crude oil output to increase by 360 kb/d in 2024. Unfortunately they give no specific demand estimate for crude oil (demand is an all liquids estimate so could include a lot of NGL). The EIA predicts US NGL output increases by 110 kb/d, for the World non-crude liquids output increases by 610 kb/d in 2024. Overall for all liquids the EIA expects a slight stock draw of 80 kb/d (29.2 Mb per year) in 2024.
Dennis,
Can you elaborate on this: ” it could be that Canada, Guyana, and Brazil increase output more than the coming decrease in US output.” Is that for 2024? or 2025? Or for later?
A decrease in US output in 2024 or ’25 is a pretty contrarian take, to be honest.
Regarding the Permian, I think Mr Shellman’s math and Mr Shallow’s math is probably quite different than XOM/Pioneer’s math. Also, didn’t Mr Shallow say that he’s growing output at ~2% currently, I don’t quite remember.
I don’t know the future, I am just going by what I read from the likes of NOVI and XOM, saying that there is more growth in the U.S. shale, albeit not as dramatic as in the past…
Kdimitrov,
A decrease in US output assumes no change in oil, natural gas, and NGL prices from today’s level. On an annual basis (average output per year), US output does not decrease in 2024 (it increases by perhaps 200 kb/d from 2023), but from the November 2023 output level (recent monthly peak) at 13295 kb/d, the EIA is expecting that in August 2024 (from STEO) US output will be 13280 kb/d at an oil price of $85.5/b (WTI). The EIA then expects prices to fall with output rising, but I expect at current oil price level output may continue to fall or at best remain at the August 2023 level so that by Nov 2024 output will be less than 12 months earlier.
As I showed with Permian analysis there is not a lot of incentive to complete new wells at current price levels and the Permian may be the most attractive area for tight oil development in the US. Yes a contrarian take which assumes conventional onshore oil output continues to decline at 2% per year and tight oil and GOM output remain relatively flat to slightly down at current prices.
I remember Shallow sand saying they are plugging some wells and holding steady (no new completions) probably some slight decline in output over time (maybe 1 to 2% per year decrease in output). I believe Mr Shellman knows his stuff and has often said tight oil is not very profitable, lower oil prices will make it less so.
For 2025 a continuation of current oil and natural gas prices would also tend to lead to a decline in US output.
I admittedly haven’t done the math in several years regarding US shale. I don’t know that I ever spoke with much authority on the topic, but I definitely do not now.
I do know that there has been significant inflation in the US oil patch since prices were very high 2010-14. At least there has been in our little field, as I see the bills and the accounting every month.
The only year we have had since the price collapse in 2014, that would compare to 2005-14 (sans the short term drop as a result of the GFC) is 2022. So one really strong year out of the past nine. 2018, 2022 and 2023 were decent, 2019 was ok, 2015 and 2017 were a struggle. 2016 was bad and 2020 was the worst.
Not seeing any major price increases without the threat of significant barrels being taken off the market, or confirmation US shale has peaked. Even then, demand may drop to offset.
” I am just going by what I read from the likes of NOVI and XOM”
Peak Oil is Peak Novi.
XOM just spent billions on Pioneer. What are they gonna say…the future sucks!
I suspect XOM is doing anything to try to book reserves and don’t mind eating another companies debt rather than exploring on their own.
Kdimitrov
I think Midland has peaked and should continue to drop if it follows the time shifted rig count.
Full US update later tonight.
$75 oil today is $50 in 2007, or <$40 in 1990s…
If prices were similar to 2008, oil would be $150 right now…
I'd say current $75 level is very low, $90/$100 range will need to happen relatively soon…
Kengeo,
Even adjusted for inflation, current oil price is well above the historical median. On top of that you have to consider that the incremental marginal demand is coming from non-OECD countries, so you have to take into consideration the US dollar strength, which has been trending up for years.
Taken together, the price in the $75-80 range is moderately restrictive for demand growth and supportive of supply growth.
https://www.macrotrends.net/1369/crude-oil-price-history-chart
Kdimitrov,
The relevant period for real oil prices is Jan 2002 to April 2024 IMO, over that period the average Brent oil price was $91/bo and median was $84/bo in 2023 US$. Interestingly, the OLS linear trend for monthly average oil prices over that period was slightly negative (slope of -.0016 dollars per barrel per year). Current Brent futures price is about $77/bo and recent spot price (May 28) was $81/bo for Brent. So prices are a bit on the low side in my view.
EIA predicts $88/bo for 2024 in the most recent STEO with price falling to $85/bo in 2025, though this might change with recent news from OPEC in next STEO.
I’d say we are in a low oil price environment, if it goes to mid 80s then it’s medium price. High price is around $110 or so…with hurricane season coming quick, prices will likely hit low to mid 90s based on that alone…
Real Brent Price Jan 2005 to April 2024 in 2023 US$/b . Average price about $98/b and median price about $90/b.
I went back and looked at the stock prices for various shale players from 10 years ago. PXD and EOG are up, but lag the S & P 500. DVN, APA and MRO are down from 10 years ago. Many have been bought or merged since 2014.
Oil and natural gas prices haven’t been high enough in the last ten years for US based upstream oil and gas to have been a strong performer compared to most other US industries.
In fact, it appears that US Coal companies have outperformed US shale oil/natural gas companies in recent years.
SS
Attached is a chart of CNQ (NYSE) compared to SPY from 2000 to today. CNQ is one of Canada’s biggest oil sands producers, possibly the biggest. If one had the stomach to ride out the ups and downs they would be ahead today along with getting a very nice steady divy.
The ride from the bottom of covid, 2020, is due to picking up Shell’s oil sands assets. The story is that the CEO of CNQ also had a London office. The story I read was that he literally walked across the street when Shell announced they wanted out of dirty oil sands and made a deal.
SPY is the barely visible little green line at the bottom.
A new thread updating US March oil production has been posted.
https://peakoilbarrel.com/small-increase-for-us-march-oil-production/
A new open thread non=petroleum has been posted.
https://peakoilbarrel.com/open-thread-non-petroleum-june-5-2024/