By Ovi
The focus of this post is an overview of World oil production along with a more detailed review of the top 11 Non-OPEC oil producing countries. OPEC production is covered in a separate post.
Below are a number of Crude plus Condensate (C + C) production charts, usually shortened to “oil”, for oil producing countries. The charts are created from data provided by the EIA’s International Energy Statistics and are updated to September 2024. This is the latest and most detailed/complete World oil production information available. Information from other sources such as OPEC, the STEO and country specific sites such as Brazil, Norway, Mexico and China is used to provide a short term outlook.
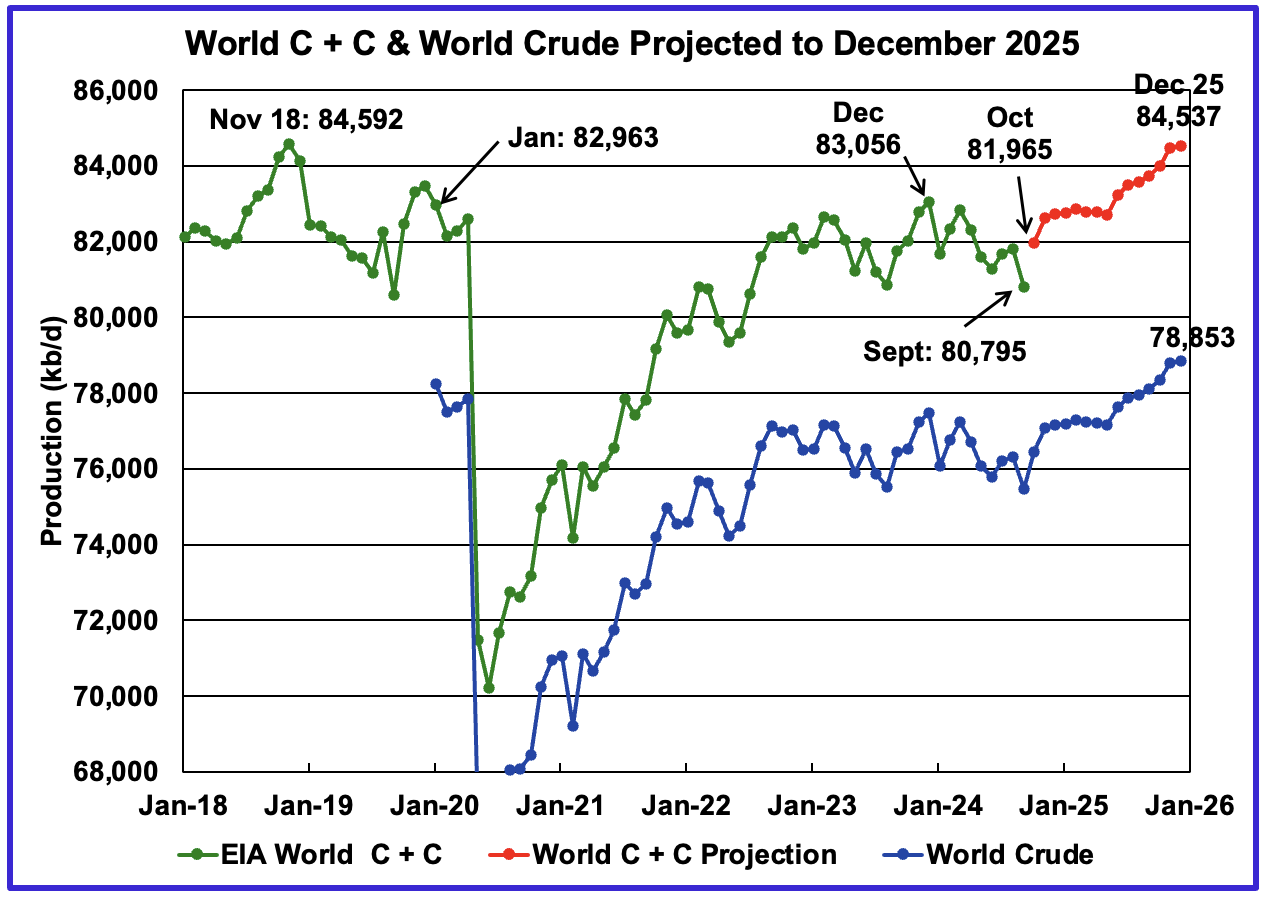
World oil production decreased by 1,014 kb/d in September to 80,795 kb/d, green graph. The largest decreases came from Libya, 350 kb/d, and Canada, 244 kb/d. October’s World oil production is projected to increase by 1,170 kb/d to 81,965 kb/d. Of that increase, Libya is expected to contribute close to 550 kb/d as its internal politics/oil dispute is settled.
This chart also projects World C + C production out to December 2025. It uses the December 2024 STEO report, which is the same as used last month, along with the International Energy Statistics to make the projection. The January 2025 STEO is not available until January 14 and an updated chart will be published in the comments section.
For December 2025, production is projected to be 84,537 kb/d. The December 2025 oil production is essential flat relative to the November 2018 peak, a mere difference of 55 kb/d and well within the margin of error.
From October 2024 to December 2025, World oil production is estimated to increase by 2,572 kb/d. The majority of the increase starts in June 2025.
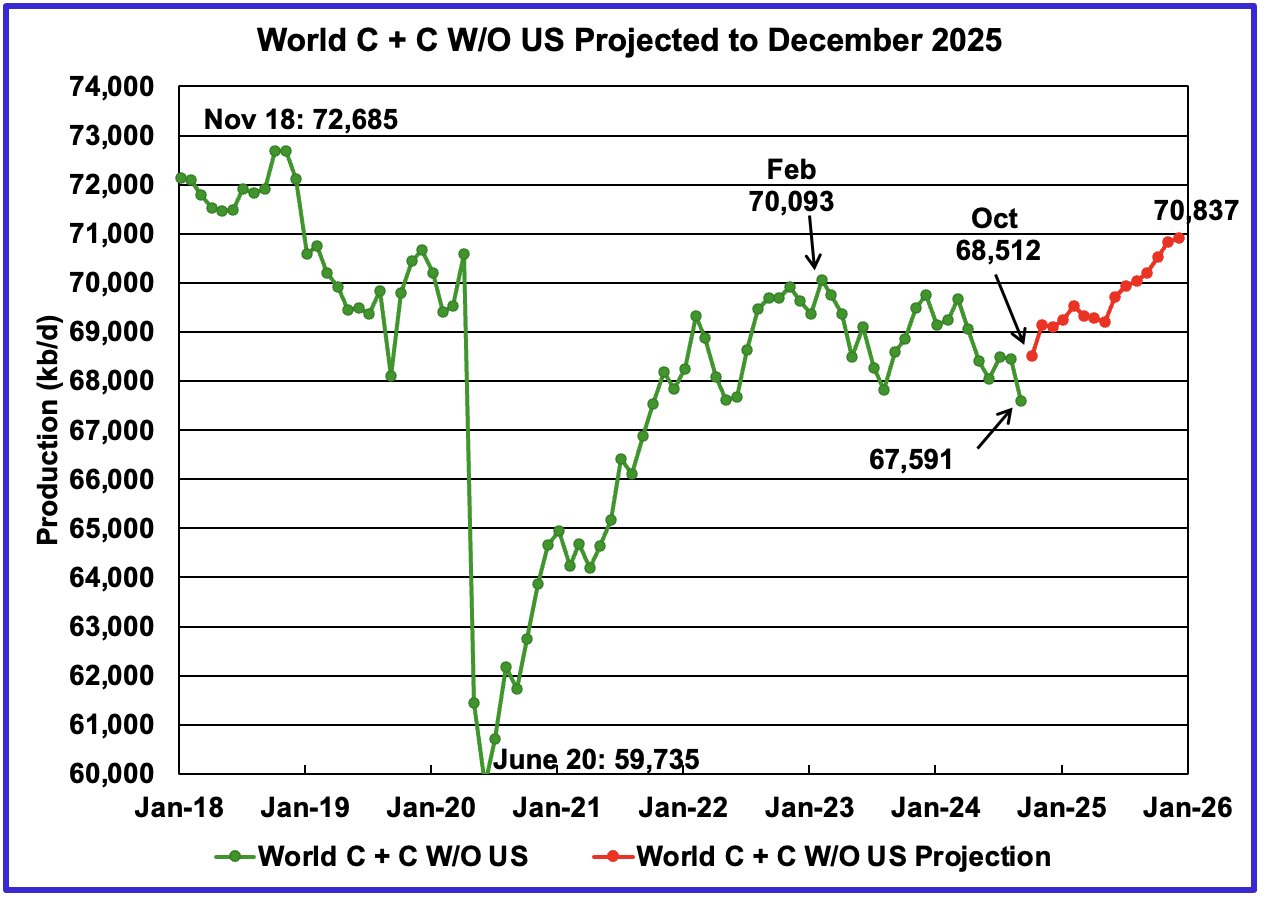
World September oil output without the US decreased by 857 kb/d to 67,591 kb/d. October’s production is expected to rebound by 921 kb/d to 68,512 kb/d.
The projection is forecasting that December 2025 crude output will be 70,837 kb/d. Note that the December 2025 output is 1,848 kb/d lower than the November 2018 peak of 72,685 kb/d.
World oil production W/O the U.S. from October 2024 to December 2025 is forecast to increase by a total of 2,325 kb/d.
A Different Perspective on World Oil Production
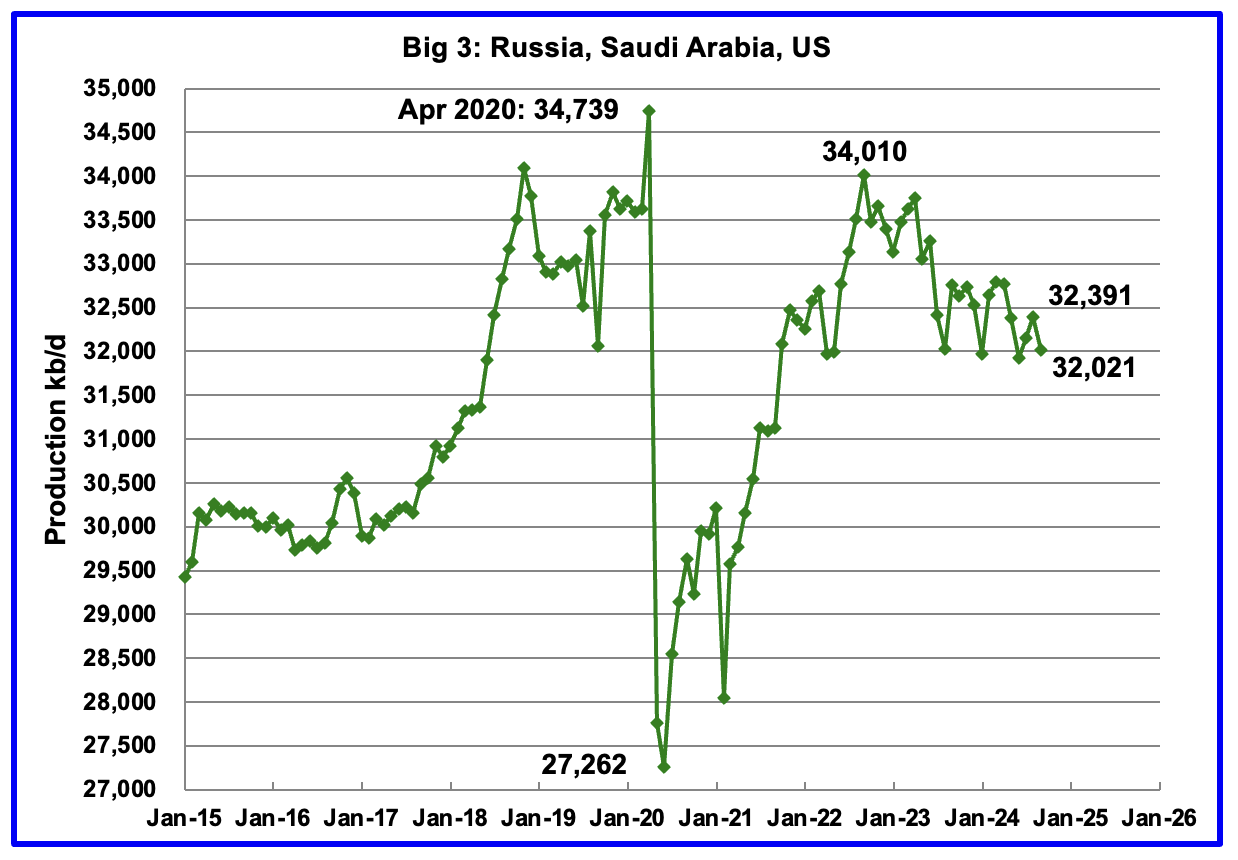
Peak production in the Big 3 occurred in April 2020 at a rate of 34,739 kb/d. The peak was associated with a large production increase from Saudi Arabia. Post covid, production peaked at 34,010 kb/d in September 2022. The production decline since then is primarily due to cutbacks by Saudi Arabia and Russia.
September’s Big 3 oil production decreased by 370 kb/d to 32,021 kb/d. Production in September was 1,989 kb/d lower than the September 2022 post pandemic high of 34,010 kb/d. Of the Big 3, the country with the largest September decrease was Saudi Arabia with a drop of 210 kb/d, see Table below.
Saudi Arabia along with other countries that were scheduled to reverse their cuts in October 2024 have now delayed them to April 2025 because of lower than expected China/World oil demand.
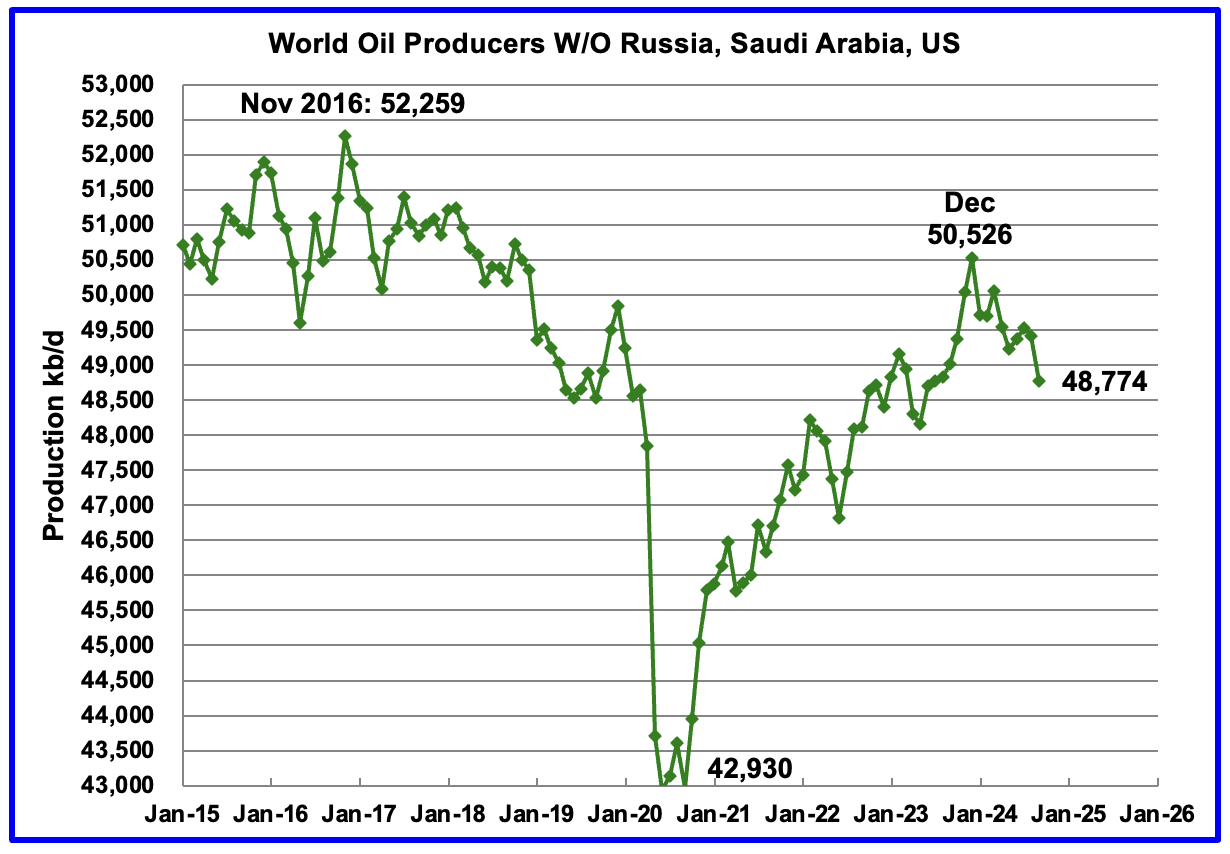
Production in the Remaining Countries had been slowly increasing since the September 2020 low of 42,930 kb/d. Output in December 2023 reached 50,526 kb/d, a new post covid high. However production began to fall in January 2024. September’s production decreased by 644 kb/d to 48,744 kb/d and is now down by 1,752 kb/d below December 2023.
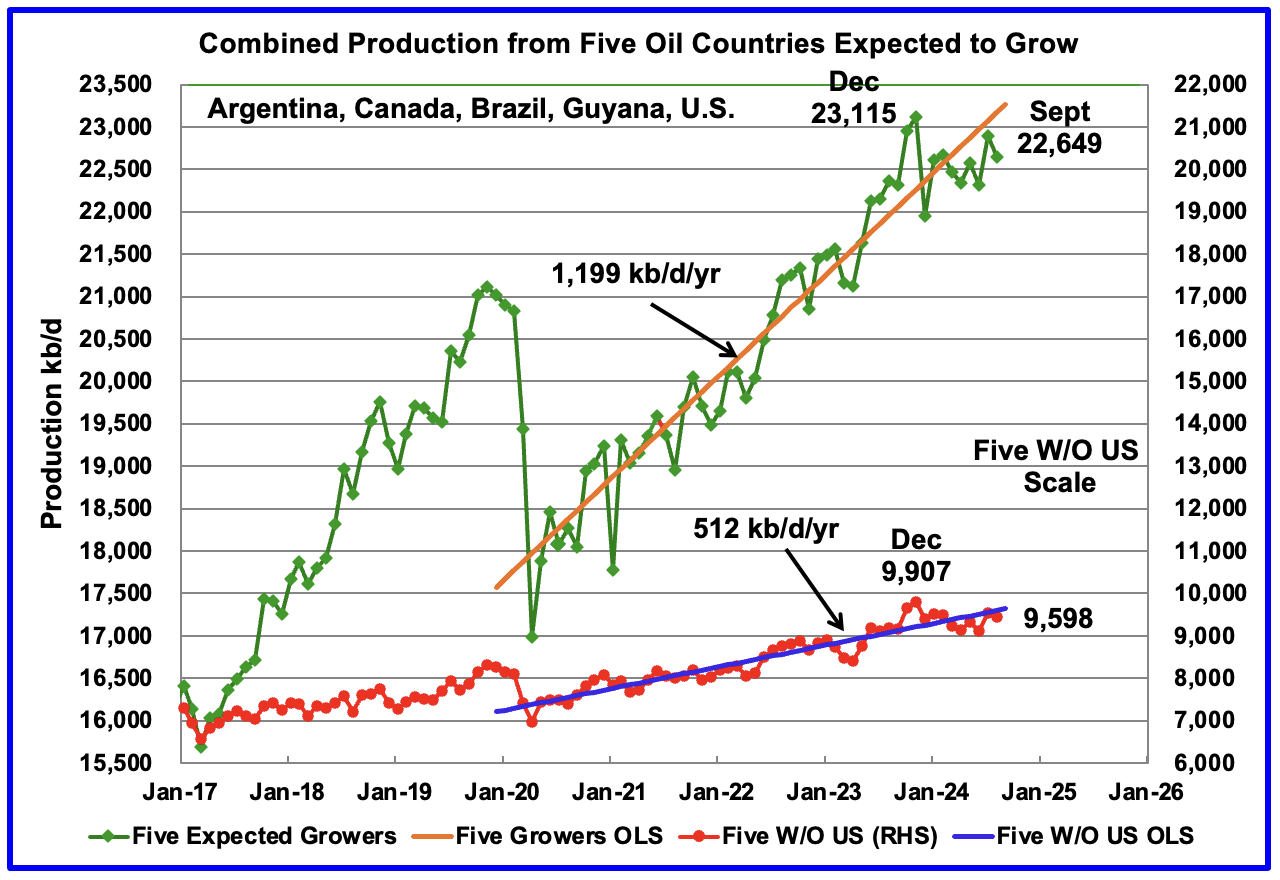
This chart was first posted last month and shows the combined oil production from five Non-OPEC countries, Argentina, Brazil, Canada, Guyana and the U.S. whose oil production is expected to grow. These five countries are often cited by OPEC and the IEA for being capable of meeting the increasing World oil demand for next year while OPEC withholds its oil from the market. For these five countries, production from April 2020 to August 2024 rose at an average rate of 1,199 kb/d/year as shown by the OLS orange line.
September has been added to the chart, down 316 kb/d to 22,649 kb/d.
The OLS lines have not been updated and will not be updated going forward unless there is a strong indication that production is rising.
The production up to December 2023 may be a situation where the past is not a good indicator of the future. In this case it may be more important to focus on what has happened to production after December 2023 rather than before. In both cases oil production has fallen since then.
Countries Ranked by Oil Production
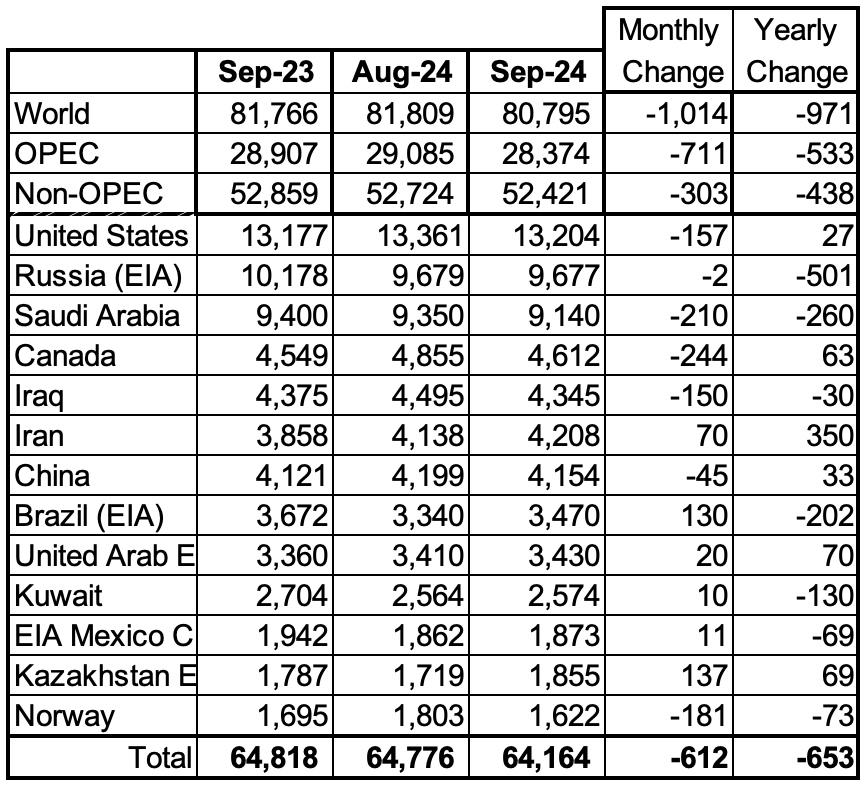
Above are listed the World’s 13th largest oil producing countries. In September 2024, these 13 countries produced 79.4% of the World’s oil. On a MoM basis, production decreased by 612 kb/d in these 13 countries while on a YOY basis, production dropped by 653 kb/d. Note the large YoY production increase in Iran and the large drops in Saudi Arabia and Russia. Will the upcoming more stricter U.S. sanctions on Iran curb/slow that increasing trend?
September Non-OPEC Oil Production Charts
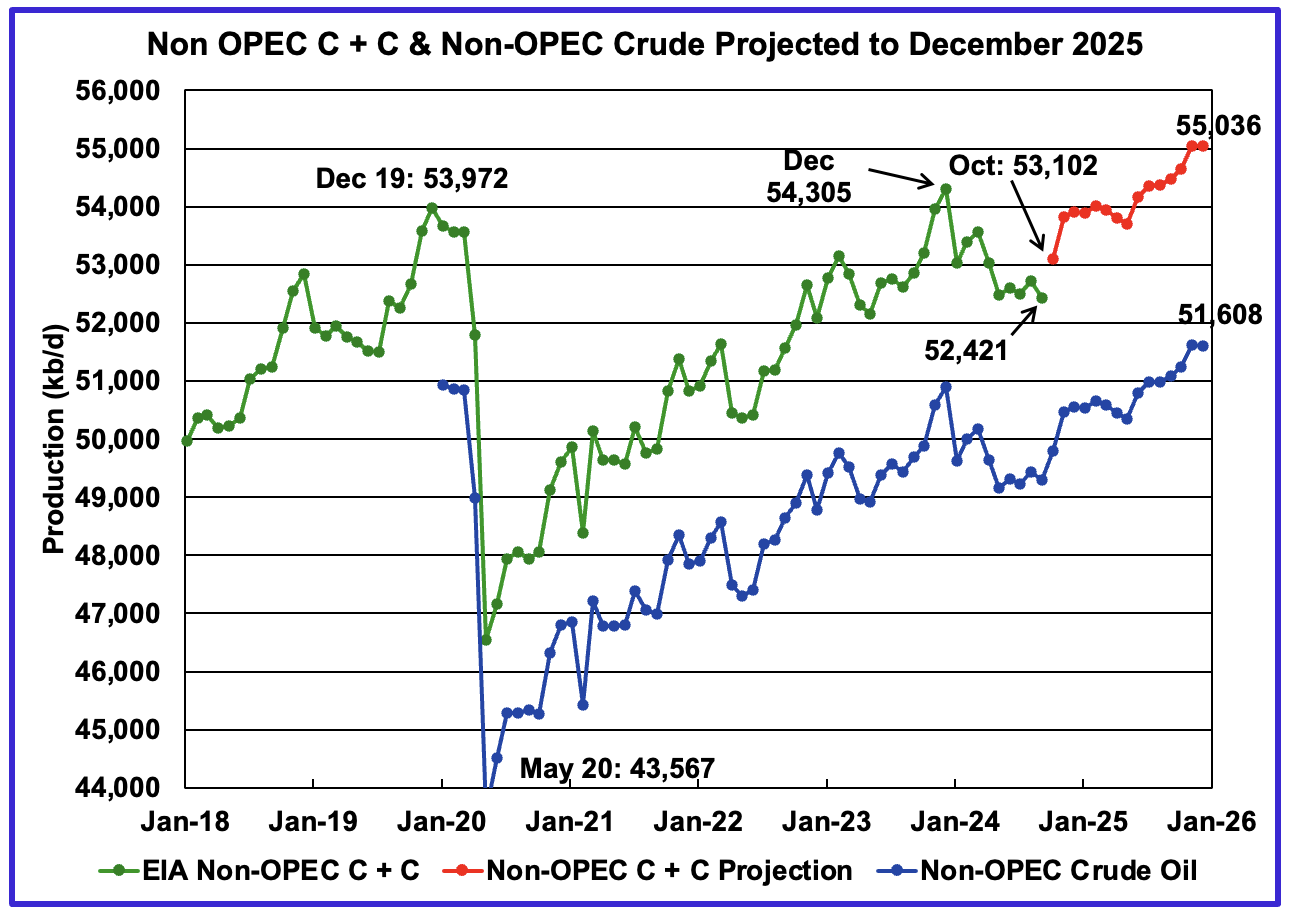
September Non-OPEC oil production decreased by 303 kb/d to 52,421 kb/d. The largest decreases came from the U.S., Norway and Canada. Note that Non-OPEC production now includes Angola.
Using data from the December 2024 STEO, a projection for Non-OPEC oil output was made for the period October 2024 to December 2025. (Red graph). Output is expected to reach 55,036 kb/d in December 2025, which is 1,064 kb/d higher than the December 2019 peak of 53,972 kb/d.
From December 2023 to December 2025, oil production in Non-OPEC countries is expected to increase by 731 kb/d.
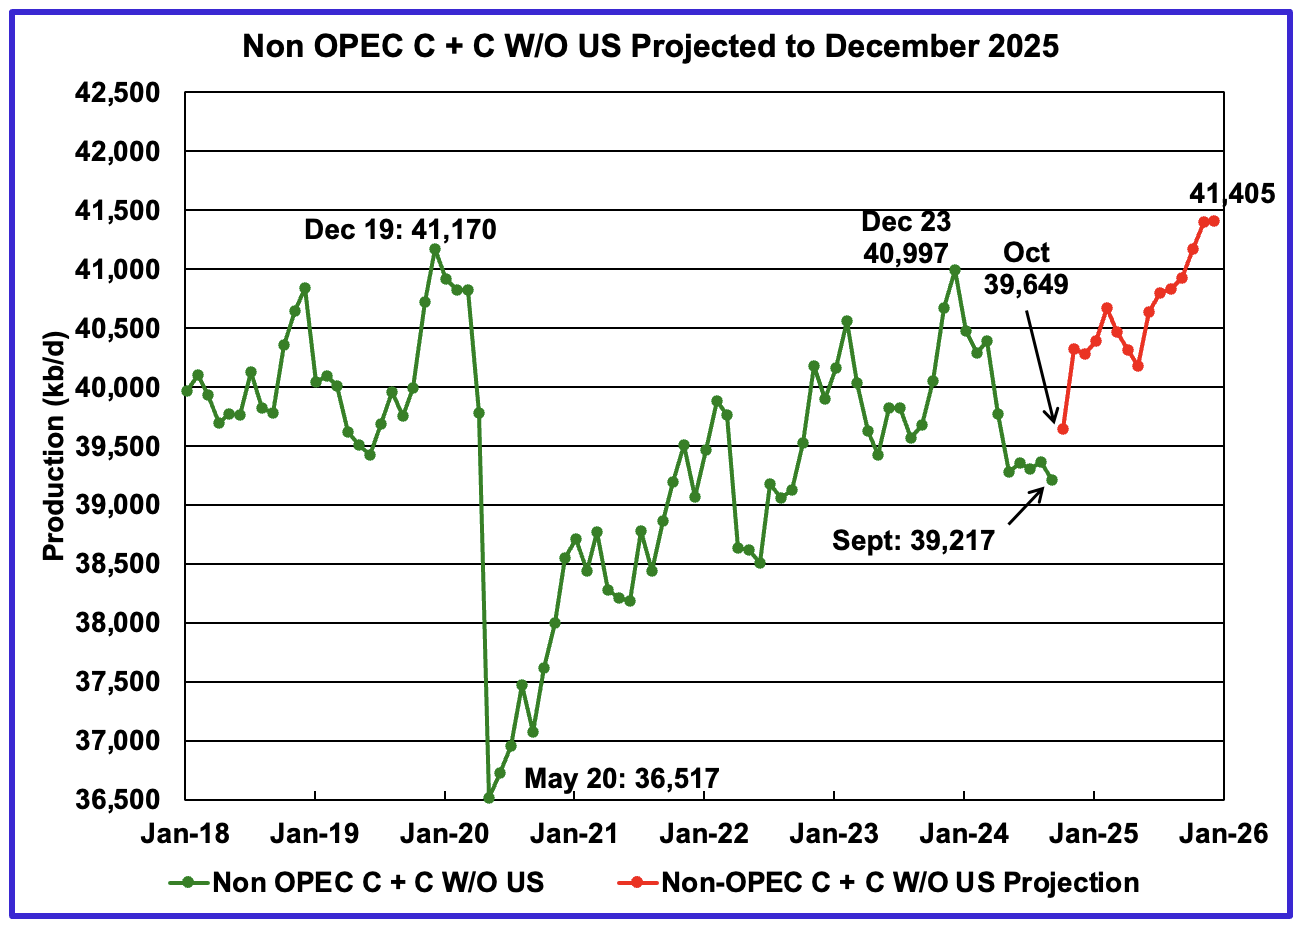
September’s Non-OPEC W/O US oil production dropped by 146 kb/d to 39,217 kb/d. October’s production is projected to rise by 432 kb/d to 39,649 kb/d.
From October 2024 to December 2025, production in Non-OPEC countries W/O the US is expected to increase by 1,756 kb/d. Canada, Guyana, Norway and Kazakhstan are expected to be major contributors to this increase. December 2025 production is projected to be 235 kb/d higher than December 2019.
Non-OPEC Oil Countries Ranked by Production
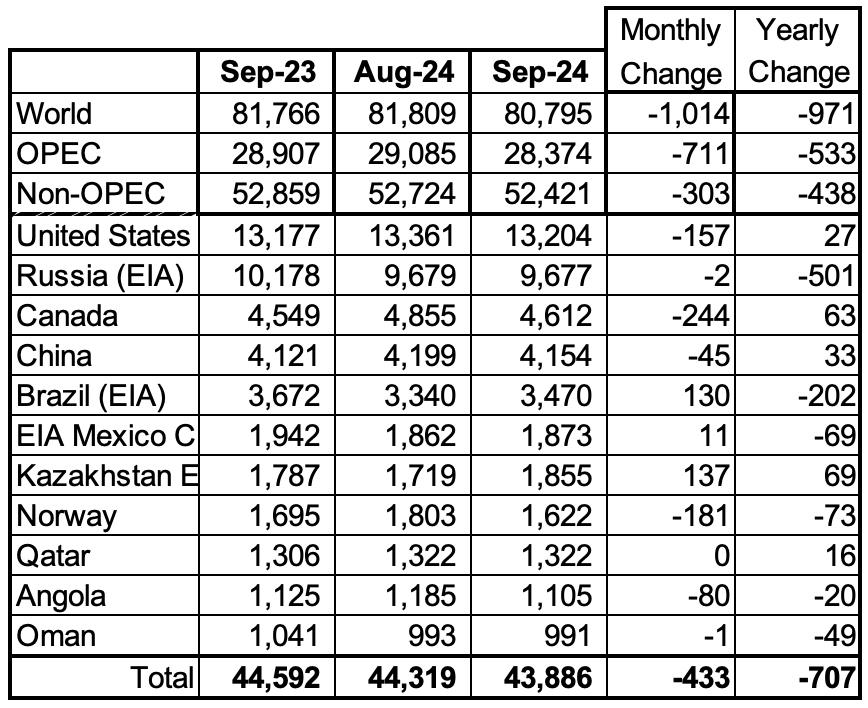
Listed above are the World’s 11 largest Non-OPEC producers. The original criteria for inclusion in the table was that all of the countries produced more than 1,000 kb/d. Note that Angola has been added to this table and that Oman has recently fallen below 1,000 kb/d.
September’s production decreased by 433 kb/d to 43,886 kb/d for these eleven Non-OPEC countries while as a whole the Non-OPEC countries saw a monthly production drop of 303 kb/d to 52,421 kb/d.
In September 2024, these 11 countries produced 83.7% of all Non-OPEC oil.
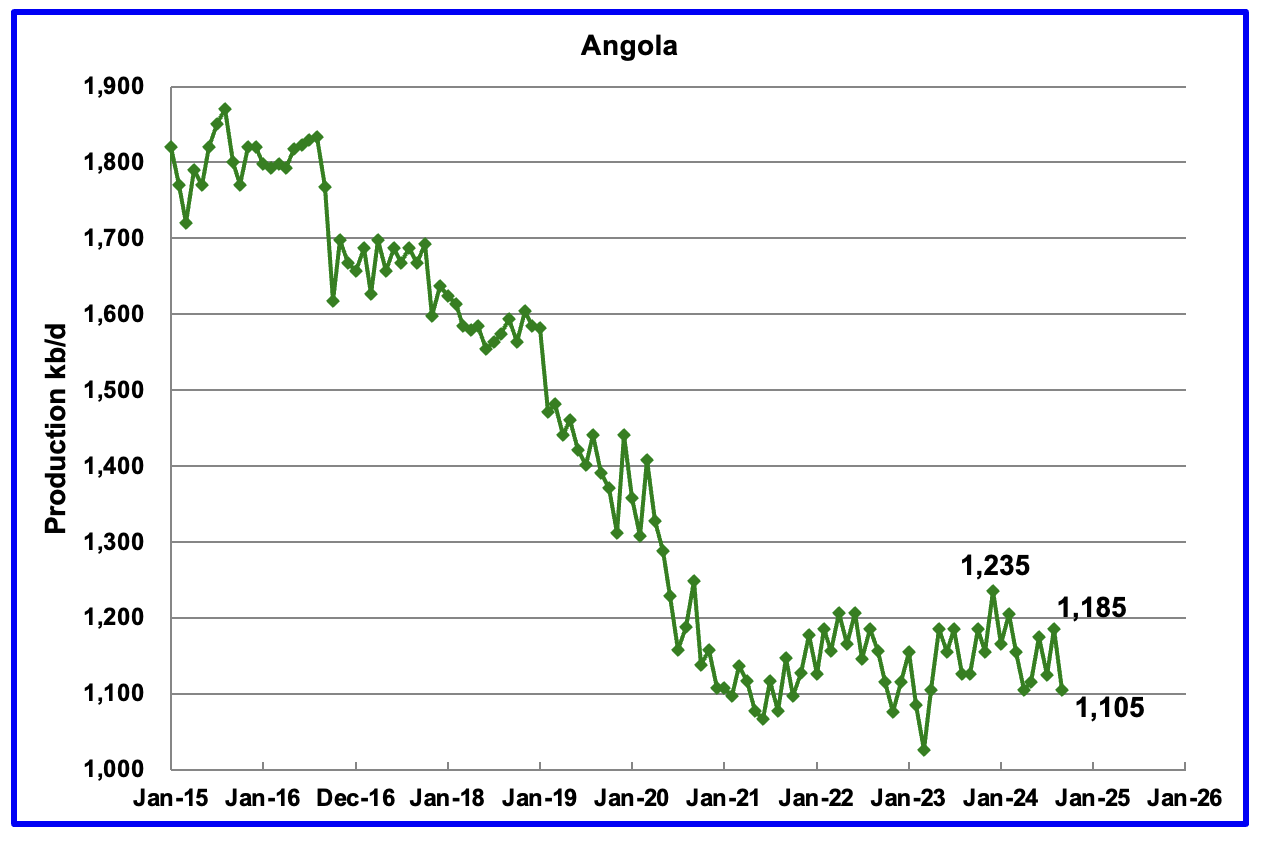
Angola’s September production decreased by 80 kb/d to 1,105 kb/d. Since early 2022 Angola’s production appears to have settled into a plateau phase between 1,100 kb/d and 1,200 kb/d.
Angola’s declining production appears to have stopped in 2021. According to this Article, Angola is looking to increase its production and attract more investments. The African oil producer plans to launch additional multi-year oil and gas licensing rounds from 2026.
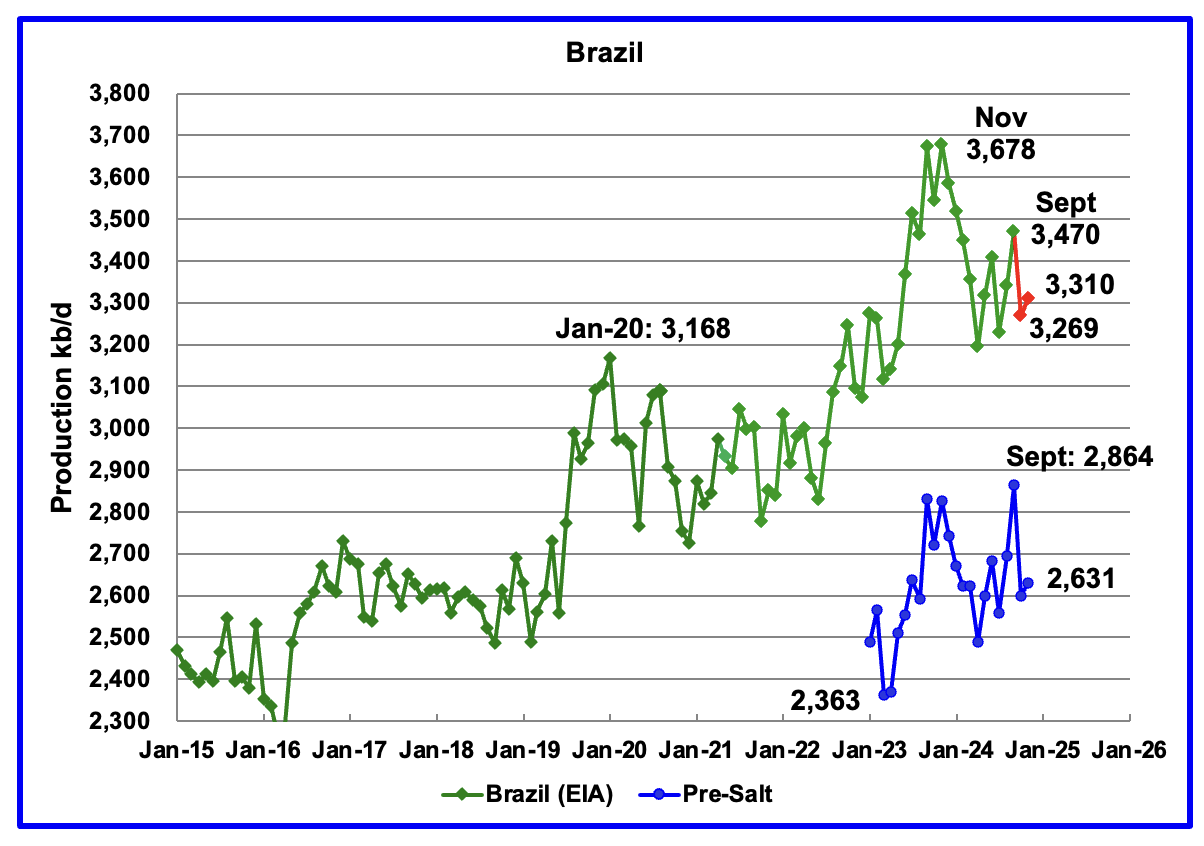
The EIA reported that Brazil’s September production rose by 130 kb/d to 3,470 kb/d.
Brazil’s National Petroleum Association (BNPA) reported that production decreased in October to 3,269 kb/d and then rose by 41 kb/d in November to 3,310 kb/d. The pre-salt graph tracks Brazil’s crude oil graph. For November, pre-salt production increased by 32 kb/d to 2,631 kb/d.
Overall Brazilian production after November 2024 has to increase by 368 kb/d to exceed the November 2023 high. However production has been very erratic since the November 2023 high. The December OPEC report states that two new floating production storage and offloading (FPSO) platforms came online in November. It also mentions operational issues and slow ramp-ups in several offshore platforms continue to be an issue. November does show a small increase in production.
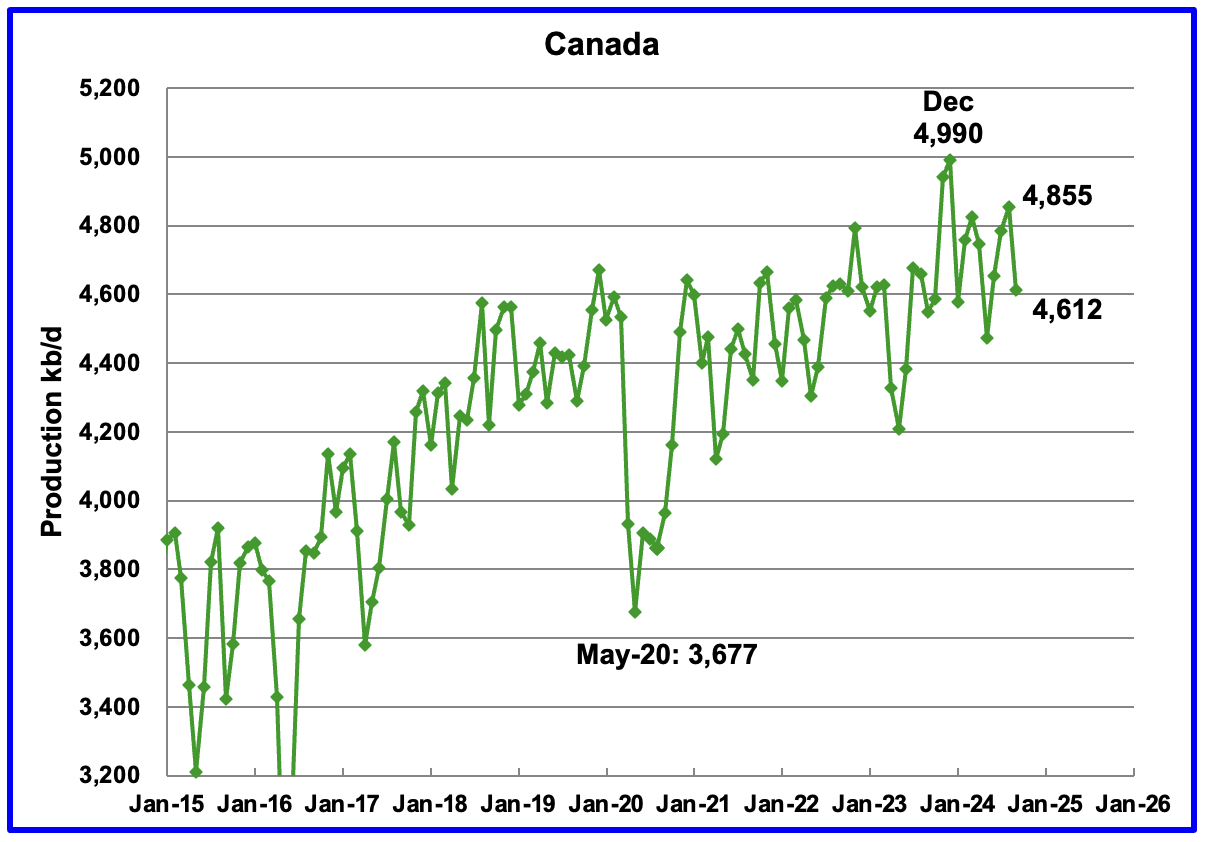
Canada’s production decreased by 244 kb/d in September to 4,612 kb/d. The decrease is primarily due to wild fires in the oil sands area around Fort McMurray.
According to this Report, “There are currently 17 active wildfires in the Fort McMurray Forest Area. Currently, nine are being held and eight are under control. “
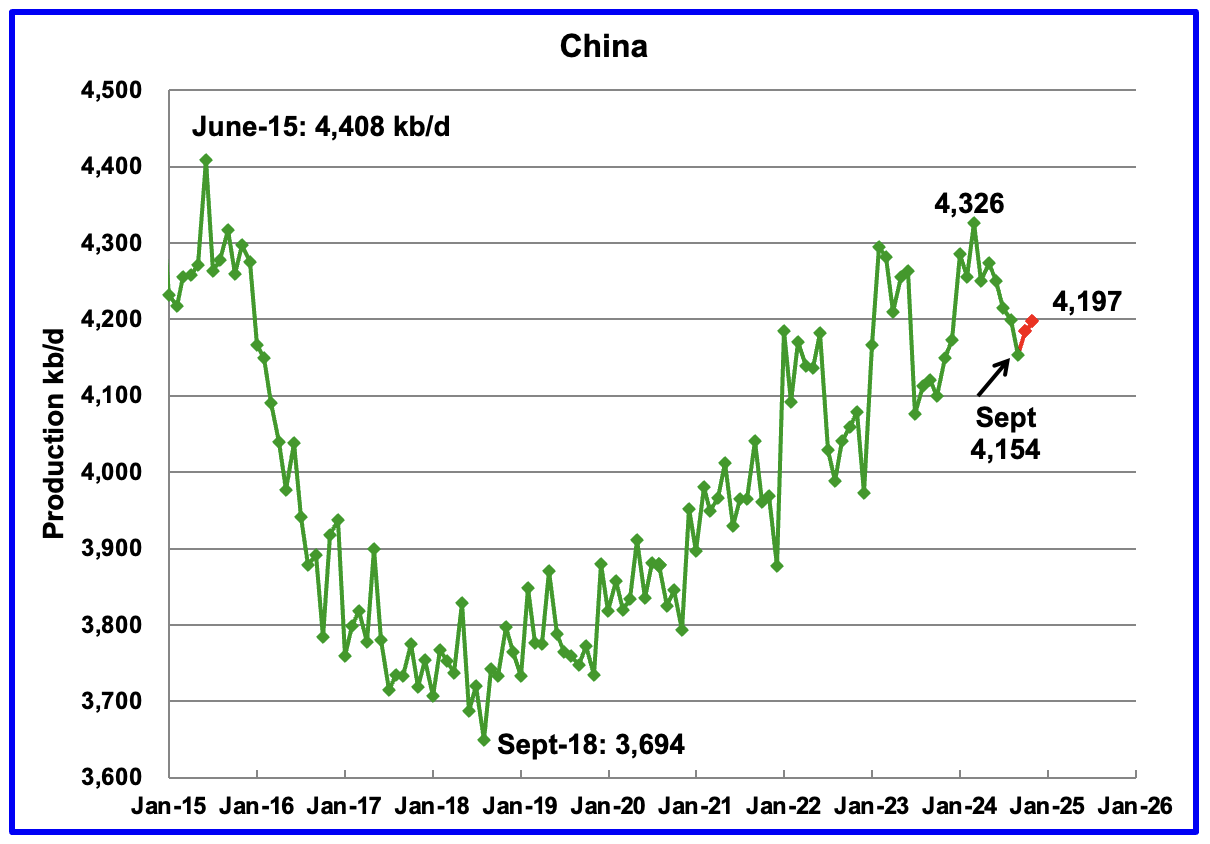
The EIA reported China’s September oil output decreased by 45 kb/d to 4,154 kb/d.
The China National Bureau of Statistics reported production for October and November. October production rose to 4,184 kb/d and November added 13 kb/d to 4,197 kb/d, red markers.
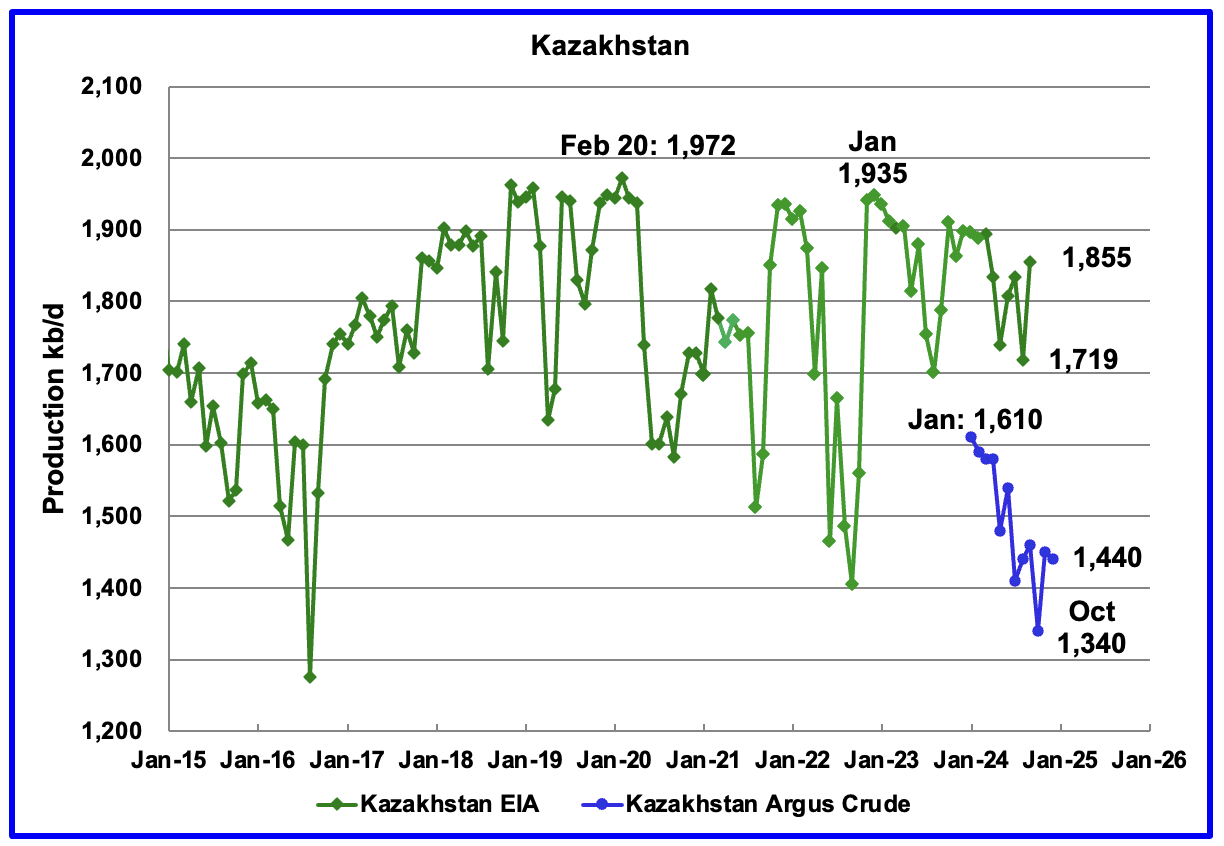
According to the EIA, Kazakhstan’s oil output increased by 137 kb/d in September to 1,855 kb/d.
Kazakhstan’s recent pre-salt crude oil production, as reported by Argus, has been added to the chart. In October pre-salt crude production dropped by 120 kb/d to 1,340 kb/d and then rebounded by 110 kb/d in November to 1,450 kb/d. December production dropped to 1,440 kb/d.
Kazakhstan’s OPEC production target is 1,470 kb/d. At 1,440 kb/d, Kazakhstan is 30 kb/d under their target. According to this Article it is not clear how Kazakhstan will meet its quota target when Chevron starts increasing production at its Tengiz field.
This Article claims that Kazakhstan’s Ministry of Energy has lowered its 2025 oil production target by one million tons as part of the country’s commitment to meeting its obligations under the Organization of the Petroleum Exporting Countries (OPEC+) agreements.
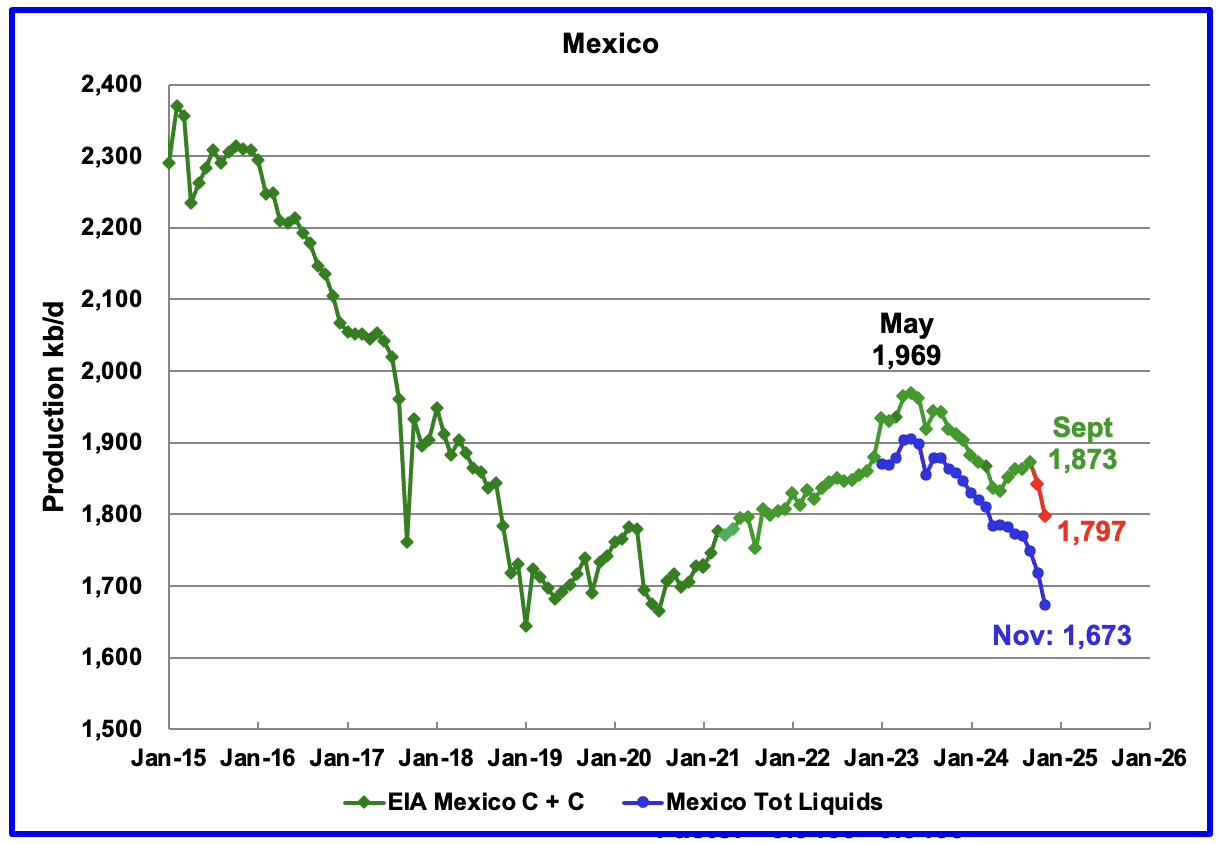
According to the EIA, Mexico’s September output rose by 11 kb/d to at 1,873 kb/d.
In June 2024, Pemex issued a new and modified oil production report for Heavy, Light and Extra Light oil. It is shown in blue in the chart and it appears that Mexico is not reporting condensate production when compared to the EIA report.
In earlier reports, the EIA would add close to 55 kb/d of condensate to the Pemex report. However for July and August, the condensate contribution increased to 90 kb/d and for September it has increased again to 124 kb/d. Not clear if this is the result of better communications with Pemex officials.
For September and October, 124 kb/d has been added to the Pemex production to estimate Mexico’s October and November C + C production, red markers. Note that Mexico’s production, according to Pemex, has continued to fall every month since May 2023, except for one month.
Since May 2023, Mexico’s total liquids production has been falling at an average rate of close 12.8 kb/d/mth or 154 kb/d/yr. Just considering the Pemex production for the last four months, production has dropped at the rate of 25.3 kb/d/mth or 304 kb/d/yr.
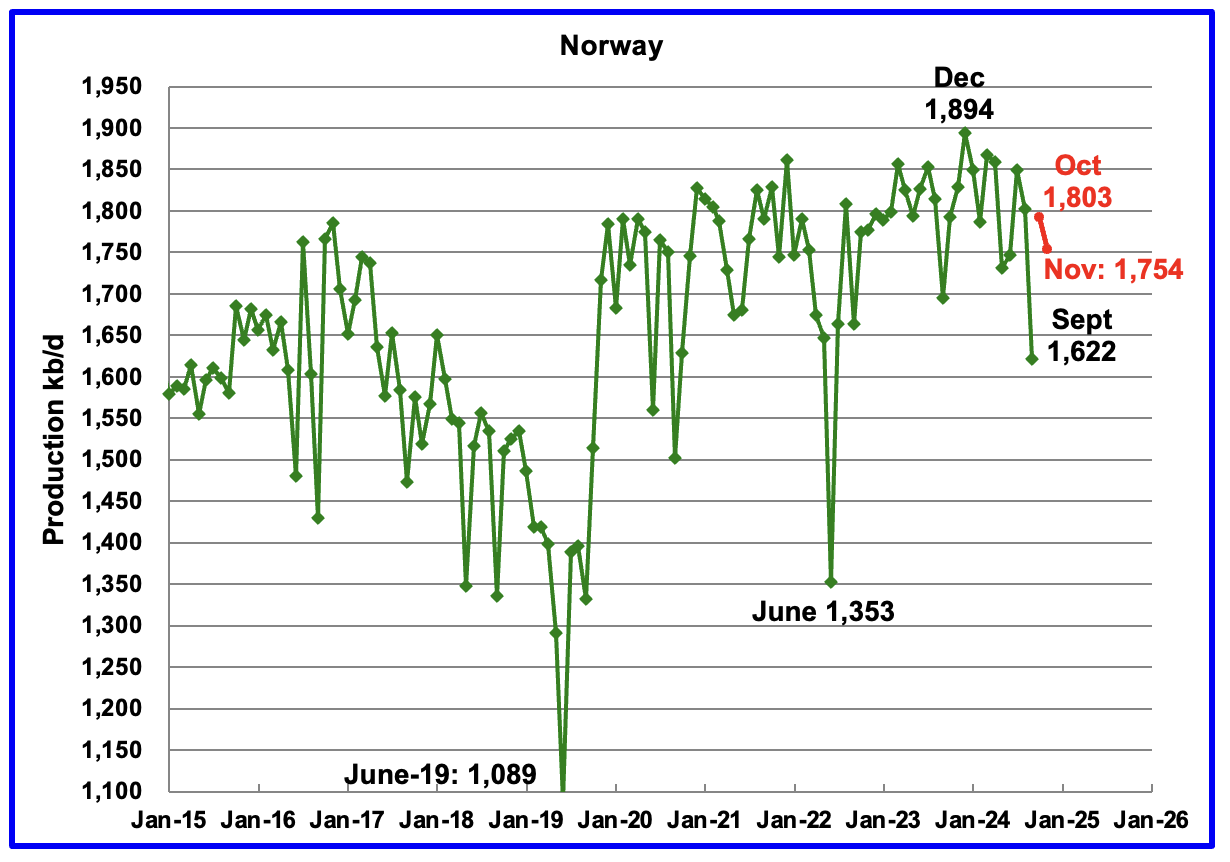
The EIA reported Norway’s September production decreased by 181 kb/d to 1,622 kb/d. The decrease was due to maintenance and a major power failure.
Separately, the Norway Petroleum Directorate (NPD) reported that October rebounded by 181 kb/d to 1,803 kb/d and November dropped to 1,754 kb/d, red markers.
The Norway Petroleum Directorship stated that November’s oil production was 3.2% more than forecast.
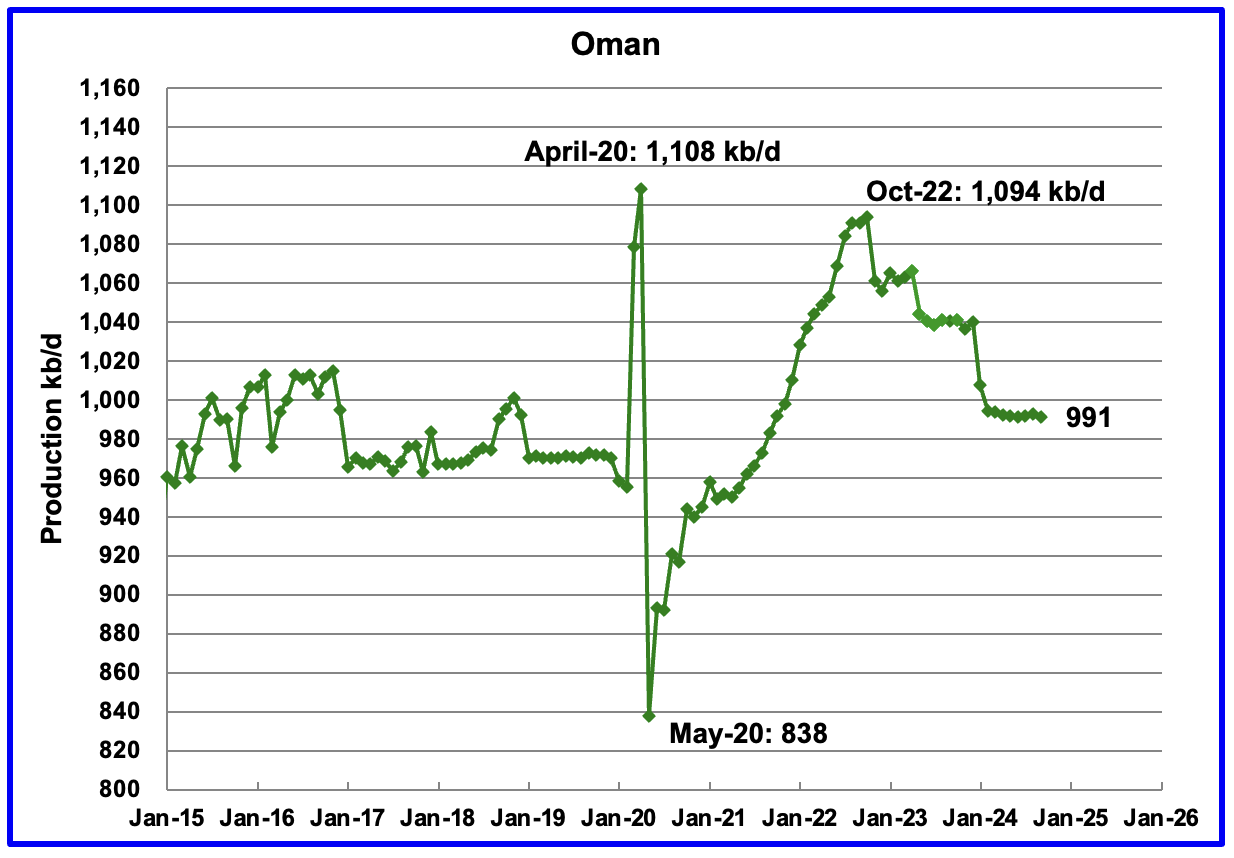
Oman’s production had risen very consistently since the low of May 2020. However production began to drop in November 2022. According to the EIA, September’s output dropped by 1 kb/d to 991 kb/d.
Oman produces a lot of condensate. The OPEC MOMR reports that crude production in September was 765 kb/d, 226 kb/d lower than the EIA’s C + C.
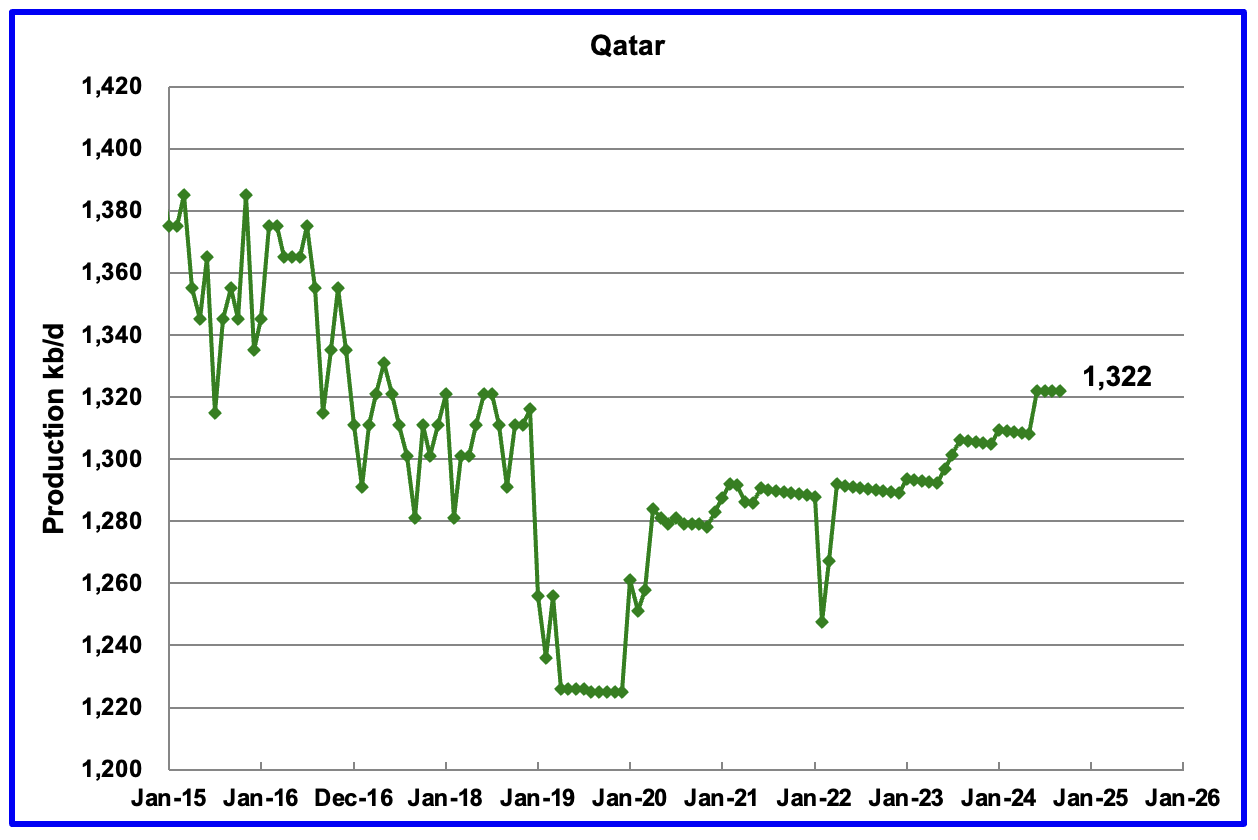
The EIA had been reporting flat output of 1,322 kb/d for Qatar since early 2022. However the current September update has revised down all of the previous production data. Qatar’s Saptember output was reported again to be 1,322 kb/d.
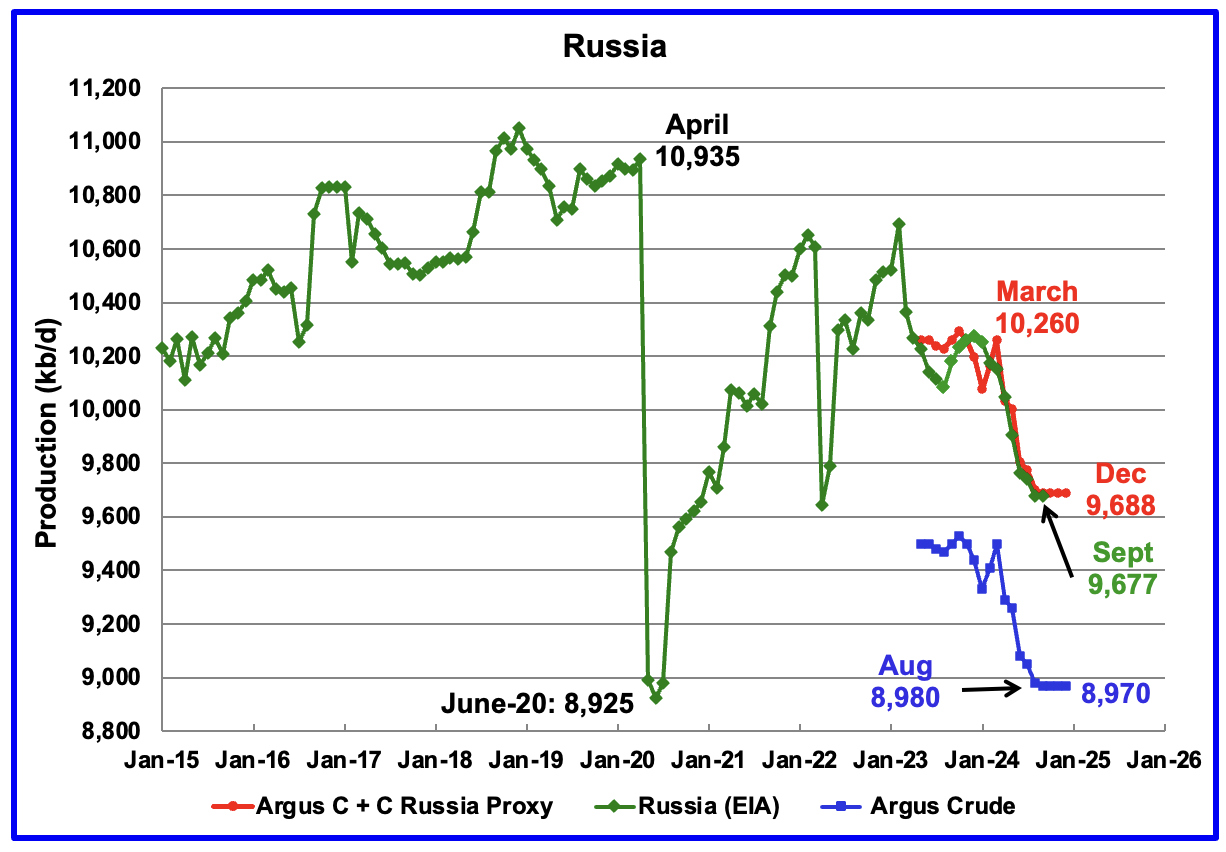
The EIA reported Russia’s September C + C production dropped by 2 kb/d to 9,677 kb/d and was down by 501 kb/d from last year.
Using data from Argus Media reports, Russian crude production is shown from May 2023 to December 2024. For December 2024, Argus reported Russian crude production was 8,970 kb/d, unchanged from October and November, blue markers. Adding 8% to Argus’ December crude production provides a C + C production estimate of 9,688 kb/d for Russia, which is a proxy for the Pre-War Russian Ministry estimate, red markers.
According to Argus, Russian crude production of 8,970 kb/d is in compliance with their OPEC target of 8,980 kb/d.
In pre-war times, the Russia Energy Ministry production estimate used to be 400 kb/d higher than the EIA estimate. For September, the Argus proxy estimate is essentially the same as the EIA’s estimate.
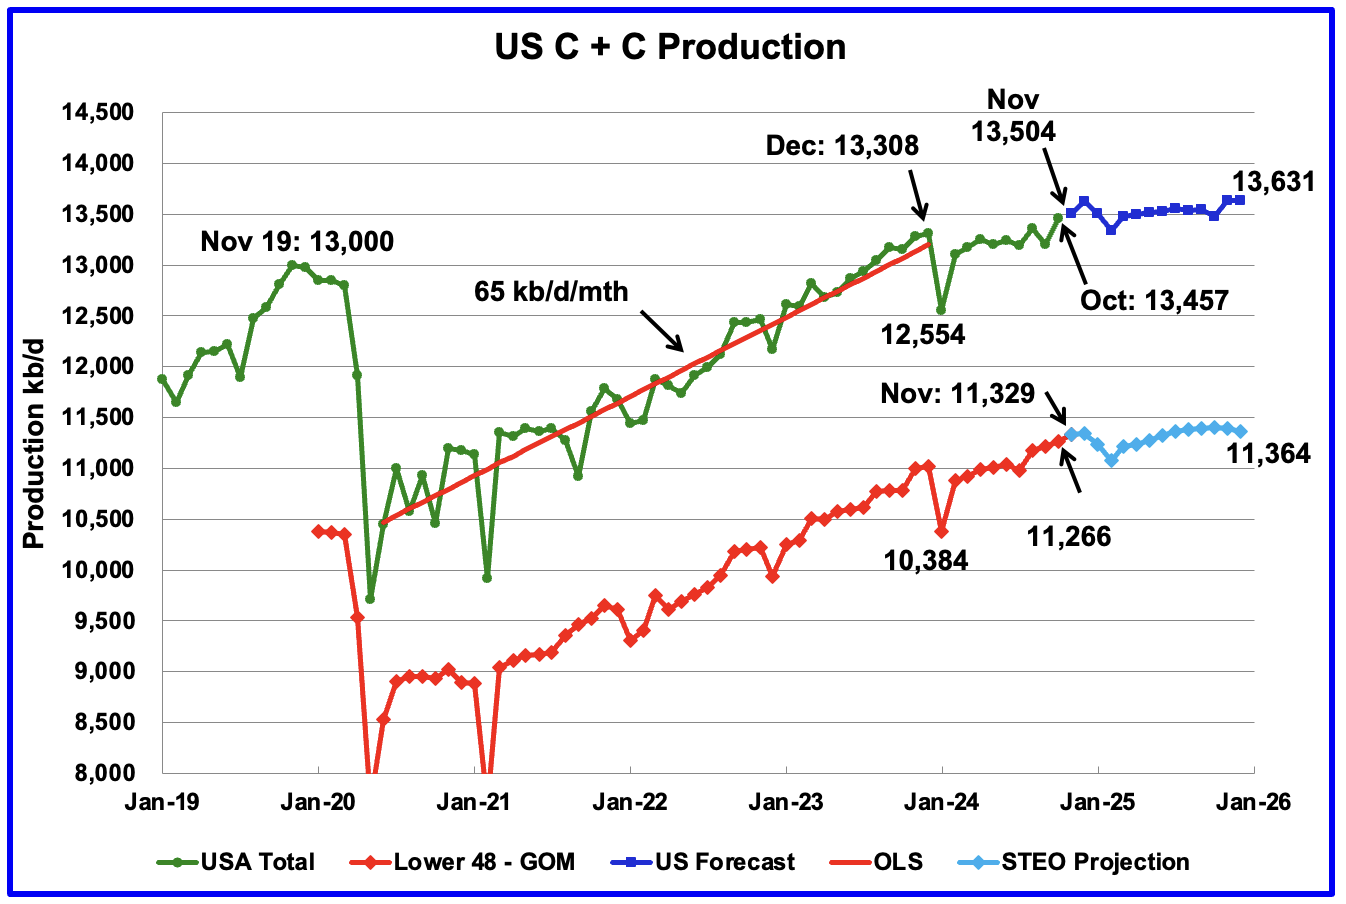
This US production chart is the same as the one published last week in the US update post. The STEO portion of the graphs could not be updated since the January STEO will not be available till next week.
U.S. October oil production increased by 259 kb/d to 13,457 kb/d. The largest increases came from the GOM, 191 kb/d and Texas, 55 kb/d.
Changing Net Decline Rates
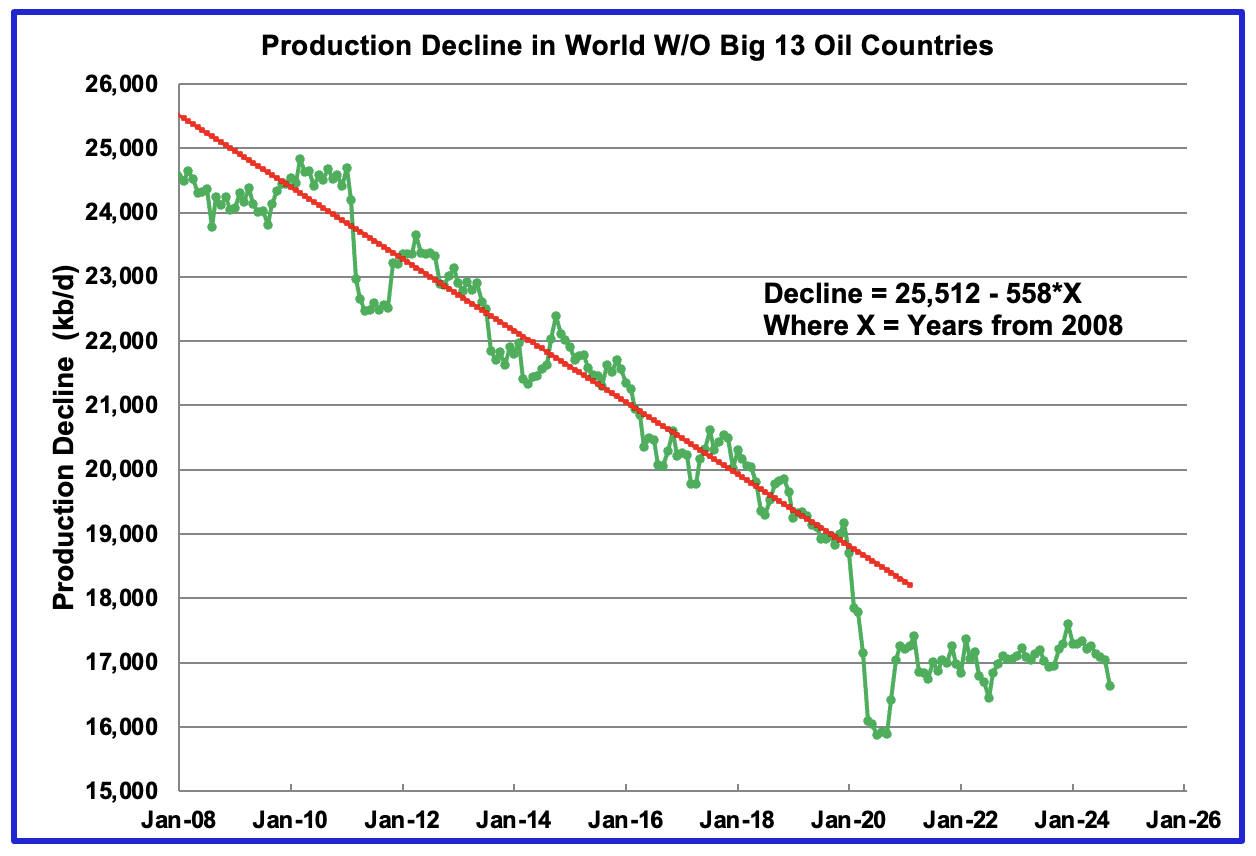
Above is the oil production from those countries not included in the Big 13 table. For these 217 countries, the net decline rate from January 2010 to January 2020 was 558 kb/d/yr. However starting in 2021 it appears the production decline in these countries has essentially stopped.
Since drilling is constantly offsetting/masking the “real natural decline rate”, I am saying that the red OLS line represents the difference between the yearly production increase minus the natural decline, i.e. the net decline rate.
What has changed? Looking more closely at production from all 230 countries three stand out. See next chart.
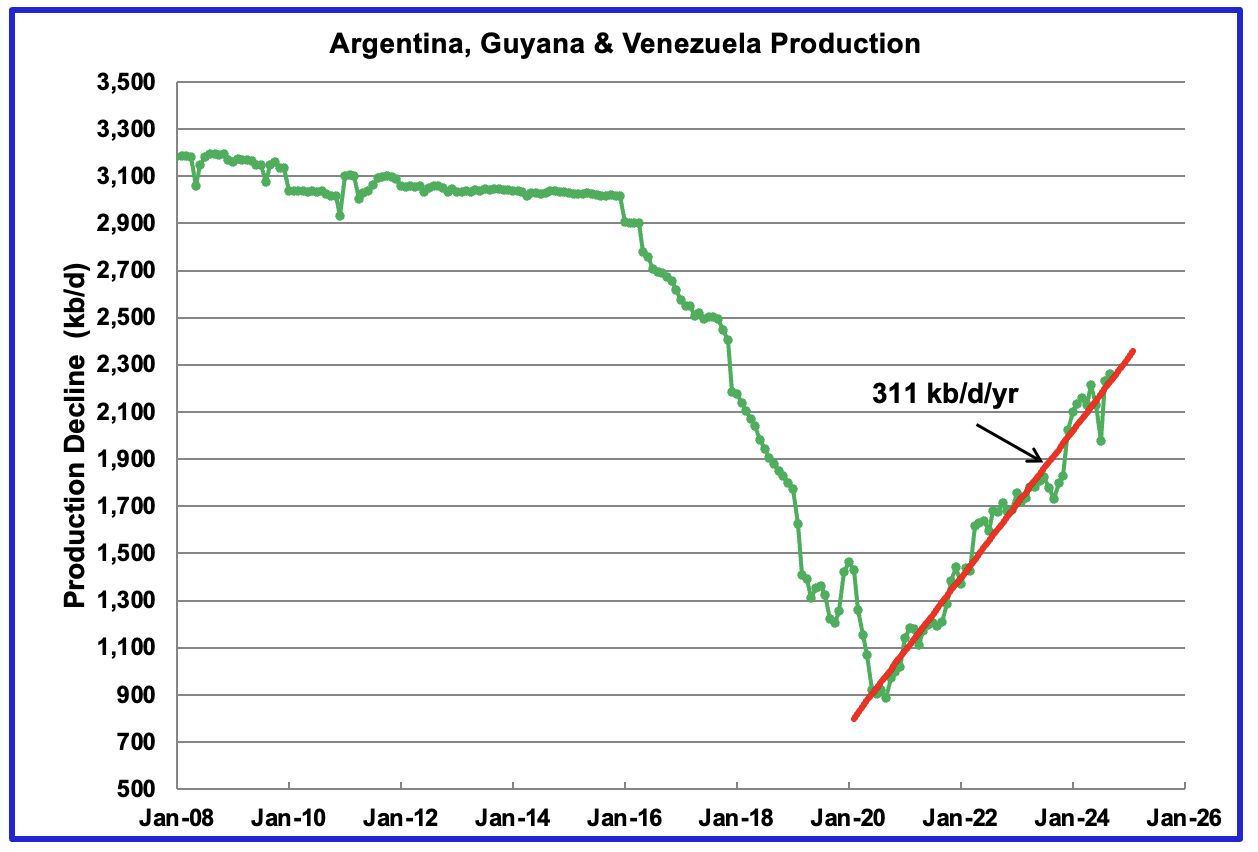
This chart shows the oil production from Argentina, Guyana and Venezuela. After a steady decline from 2016 to 2020, production in these three countries began to rise in mid 2020. From August 2020 to September 2024, production in Argentina grew by 260 kb/d, in Guyana by 561 kb/d and in Venezuela 520 kb/d.
An OLS line for production from August 2020 to September 2024 estimates that production rose at the rate of 311 kb/d/yr. Making the rough assumption that there is no decline from mid 2020 for those 217 countries not in the Big 13 implies that the net decline for those countries not part of the Big 13 plus Argentina, Guyana and Venezuela is close to 311 kb/d/yr.
186 responses to “September Non-OPEC and World Oil Production Drops”
As always, great job!
However, related but not in the post per se, how would Ukraine closing the pipelines to Hungary and Slovakia be beneficial to the EU?
Might help LNG sales a bit though, but who would benefit? In the longer term, the red line projections looks nice but has little foundation in my modest view, seems more like hope.
But time will tell, feel free to post or not.
Laplander
Thanks
My understanding for cutting natural gas through Slovakia and then onward to other European countries is to stop the flow of cash/money to Russia to impede their production of weapons and funding of the war. Yesterday the US imposed sanctions on a number of ships that transport oil to China and India with the same intent. The payments for that gas and oil are funding the Russian aggression.
The red lines are an attempt to take the EIA’s crude oil projection and convert it into a C + C projection. A large part of that projection is the planned unwinding of the OPEC cuts starting in April.
The price action of WTI and Brent over the past week along with the current steep backwardarion in the WTI futures contract leads me to believe that there is a slight shortage of crude in the market and that OPEC will begin to unwind their cuts in April. The issue will be how much crude oil will the market be able to absorb before inventories begin to rise and prices begin to fall. The US driving season starts in June so OPEC’s unwinding should continue up to September. After that, difficult to know. To some extent it will depend on US oil production.
Thanks for the detailed analysis, as always.
Big picture, it is really interesting how the world continues to produce larger amounts of fossil fuels.
Fossil fuels per capita consumption has been relatively flat since 2007 and population growth is slowing worldwide, with a peak of over 10 billion people around 2080.
However, that is still adding over 2 billion people.
Yet the world continues to produce enough oil, gas and coal and prices have been low, outside of 2022, since 2014.
True, and so far the collective humanity purchasing power has been able and eager to fund the project.
The ‘bang for the buck’ is a great deal, and will remain so indefinitely considering the alternative. Regardless of the downside…hot earth.
Dennis has often made the important point that the combustion has become gradually more efficient/effective, and that trend will surely continue.
I generally think of non-fossil energy sources and mechanisms as fossil fuel extenders. Currently about 81% of primary energy comes from fossil fuels, with some countries much higher or lower on that metric. That percent of energy coming directly from fossil fuels will continue to gradually decline, and the deployment of extender mechanisms will continue to become more important factors in economic resiliency.
China seems to get this challenge better than most. Being reliant on imported fossil fuel with the shipping lanes being controlled by impulsive adversaries makes the take home message pretty obvious I suppose.
Hickory,
Looking at this data from 2022. How is China getting the message when their coal, oil and gas consumption is increasing. Especially their coal usage.
https://www.iea.org/countries/china/energy-mix
Yes they are still on the trend of combustion up, perhaps for a bit longer.
But I do think they see the writing on the wall clearer than most.
They are working hard to build out the various non-fossil mechanisms,
and are outdoing the rest of the world combined on those efforts.
They also know that a country without cheap and abundant electricity will be left in the dust in these coming decades of digital cultural, corporate and industrial warfare…cold or hot. They have just approved the construction of a dam with 3 times the capacity of Three Gorges, upstream in the Brahmaputra River Basin.
I believe the Japanification of China is around the corner. But we’ll see whose right when the time comes.
Hickory
I don’t really think that China believes in the effects of CC. Their goal to me seems to be to use up all the coal they have and reduce reliance on crude.
Ovi, I’m not sure what CC is?
I think that China’s priority on energy #1 thru 10 is energy security, plain and simple.
All the mechanisms they are deploying (including aircraft carriers and other weaponry) are primarily towards the goal of energy security.
And that you the excellent report, as always.
Climate Change
I think it’s clear that China cares about FF pollution, and FF import cost & insecurity.
They simply make adequate energy supply their top priority, so they do “all of the above”.
But look at the growth rates of solar power and EVs in China: they’re serious about moving away from FF.
Nick G
China understands that their Achilles heal is oil importation both for economic and security reasons. They use close to 13,000 kb/d and produce 4,000.
There goal is to FF independent. That is why they started developing EV technology in a dedicated national effort before anyone else.
I agree. They are pursuing a very sensible policy.
It’s worth noting that they’re also acutely aware of FF pollution. There is an enormous cost in China to coal pollution in particular. They’ve been building a lot of coal generation, but a large part is replacing old, very inefficient plants.
OTOH, much of the coal plant construction has been a provincial jobs program…
Hypothetically, and a bit of a tangent, if China were to be blockaded from oil/coal imports, would they launch “Pearl Harbor 2”? And in what form then?
History seldom repeats I´ve learned, but it sure would rhyme.
Interesting times indeed.
Ovi,
On China’s C plus C consumption their crude input to refineries was about 14.28 Mb/d in 2024, down by about 500 kb/d from 2023 based on the January MOMR. EIA has C plus C for pat 12 months at about 4200 kb/d, so oil imports are about 10.1 Mb/d. The rapid expansion of EVs and solar may eventually allow China to reduce its dependence on energy imports. It will require 20 to 30 years to reduce their energy imports significantly. The US imported 6.6 Mb/d of oil in the most recent 12 months and in 2005 and 2006 the US imported 10.1 Mb/d of oil.
One big issue in Chinese energy production is that the central government has not been able to control the provinces. The provinces are building capacity like crazy, coal, solar and wind, and Beijing hasn’t been able to do much to stop them.
non-fossil energy sources and mechanisms as fossil fuel extenders.
For the moment. But when ExxonMobil declares that their goal is to become net-zero, you know that there is a general consensus in the world that FF can be eliminated. Of course, there still is a lot of resistance from the Kochs of the world, so the transition will be unnecessarily long, but the writing is on the wall.
Nick G,
Umm no, they said that only about the Permian and by 2030.
Here is a review of the company in terms of climate:
https://www.climateaction100.org/company/exxon-mobil-corporation/
Mike,
I don’t see where the commitment is limited to the Permian. Could you point me to it?
Nick G,
This is the only net zero announcement i found from Exxon:
https://corporate.exxonmobil.com/-/media/global/files/advancing-climate-solutions/pathway-to-net-zero-in-the-permian-by-2030_infographic.pdf
I wouldn’t believe a word they say.
Well, I found this. Scope 1&2 are emissions internal to the company.
“ These actions support our 2030 greenhouse gas emission-reduction plans and our ambition to achieve net-zero operated Scope 1 and 2 emissions by 2050.”
https://corporate.exxonmobil.com/sustainability-and-reports/sustainability/our-approach-to-sustainability/performance#SupportingtheUnitedNationsSustainableDevelopmentGoals
Shallow sand,
Some demographers have lower scenarios for peak population of around 9.2 billion in 2057/2058
see SSP1 scenario at link below
https://dataexplorer.wittgensteincentre.org/wcde-v3/
Chart with SSP1 and SSP2 scenarios from Wittgenstein Center
What runs short first…combustibles or habitability?
Hickory,
It depends on the choices humans make. In the US there was the Clean Air and Clean Water Act, there was also the Montreal Protocol for protecting the Ozone layer. Perhaps solar and wind continue their rapid expansion and reduce the use of fossil fuel, impossible to predict.
The rate of increase (in percentage terms) of fossil fuel primary consumption has been falling.
From 1965 to 1979 the rate of increase was about 4% per year for the World. From 1982 to 2008 the rate of increase averaged about 1.9% per year. From 2009 to 2018 the average increase was about 1.4% per year, and from 2018 to 2023 the average increase was about 0.7% per year. Future rates of increase are unknown.
I don’t think that world population will keep growing until 2080. I think the energy shortages will lead instead to a decrease of world population. Just my opinion.
Tougher U.S. sanctions to curb Russian oil supply to China and India
Summary
143 sanctioned oil tankers shipped over 530 mln bbls Russian crude in 2024 – Kpler
New sanctions will disrupt Russian oil supply to top buyers China, India
Refiners will seek more oil from Mideast, Africa, Americas driving up spot crude prices and freight costs
Chinese independents will cut runs if ESPO supply hit – traders
NEW DELHI/SINGAPORE, Jan 12 (Reuters) – Chinese and Indian refiners will source more oil from the Middle East, Africa and the Americas, boosting prices and freight costs, as new U.S. sanctions on Russian producers and ships curb supplies to Moscow’s top customers, traders and analysts said.
The U.S. Treasury on Friday imposed sanctions on Russian oil producers Gazprom Neft (SIBN.MM), opens new tab and Surgutneftegas, as well as 183 vessels that have shipped Russian oil, targeting the revenues Moscow has used to fund its war with Ukraine.
Many of the tankers have been used to ship oil to India and China as western sanctions and a price cap imposed by the Group of Seven countries in 2022 shifted trade in Russian oil from Europe to Asia. Some tankers have also shipped oil from Iran, which is also under sanctions.
Russian oil exports will be hurt severely by the new sanctions, which will force Chinese independent refiners to cut refining output going forward, two Chinese trade sources said. The sources declined to be named as they are not authorised to speak to media.
Among the newly sanctioned ships, 143 are oil tankers that handled more than 530 million barrels of Russian crude last year, about 42% of the country’s total seaborne crude exports, Kpler’s lead freight analyst Matt Wright said in a note.
Of these, about 300 million barrels was shipped to China while the bulk of the remainder went to India, he added.
“These sanctions will significantly reduce the fleet of ships available to deliver crude from Russia in the short term, pushing freight rates higher,” Wright said.
Ovi, the above is a nice job of compiling available data, but we are likely on the threshold of a major change. I have a couple of comments in the spirit of good intention, not to create disharmony. The first is my fairly obvious view on American domestic production, but the second involves something much more disruptive of world order and is highly speculative. Neither is to be considered remotely political.
1. Flat to slightly growing U.S. production has come about using a cost-cutting maneuver that cannot last forever: the 3-mile lateral. By “going the extra mile,” they have created a beautiful IP180, but then those things begin to fall off the cliff. There is enough acreage to continue this format, using fewer rigs and frac spreads, for another year. When this herd of 3-milers hits 18 months of age, they are basically done. So watch out for 2027, because over half of the 50,000 aging wells will also be hitting terminal decline at a staggering pace.
2. Now here’s my short-term global hypothesis, and it won’t be popular. Hate him or love him, Mr. Trump usually follows through on his promises, so I personally believe there is coming a major geopolitical upheaval. The fact that Hamas still holds Americans hostage really galls him, and he has promised “hell on earth.” Since Hamas is Iran’s major proxy and Iran is purportedly nearly ready with a nuclear bomb, and since Trump’s big 1st term legacy was the Abraham Accords, I strongly suspect that a joint American-Israeli military strike using the bunker-buster will happen. A cooperative KSA is needed for that, and they don’t come cheap, so it is likely that for a while the Saudis will supply the USA with Arabian Heavy (API <29) to blend in at the refinery. General chaos is coming: built largely around the energy market. U.S. exportation of oil will probably drop, as will the gasoline price at the pump (as promised). The exportation and price of LNG, though, will likely increase substantially.
I'm sure everyone–young and old–whose income depends on what happens in geopolitical circles is trying to formulate a Trumpian First Week. This is mine, and no matter how hard I come up with alternatives I keep coming back to this. I doubt there are many Americans who wish to harm our Canadian neighbors in any way, but, in the mind of Trump, it is a necessary evil. He has paved the way with insults that have prompted Canadian outrage–his modus operandi.
That is an interesting take Gerry. I think everything you said is entirely possible.
So what is your prediction for closing WTI prices and average for 2025, given those views ?
IRON MIKE:
In my view there is no way to predict prices, just ballpark. In formulating my analysis I went back and looked at Mr. Trump’s 24 promises on the campaign trail. Then I listened to and read podcasts of his preparation for his 2nd term. His new Sec of Energy will be Chris Wright, who is MIT and Berkeley trained and knows all forms of energy, including SMR’s, wind and solar, and of course shale oil & gas. Mr. Wright has educated Mr. Trump in co-trafficking of LTO & NG, including the fact that NG & NG liquids now make up 50% of the hydrocarbon stream and if NG prices are high, nobody much cares if crude oil stays low.
Conclusion: the man is laser focused on performing on those things that he promised. The initial week of his administration is going to be much more profound than anyone currently expects. Relatively low oil and relatively high NG prices would be my general expectation. I fail to come up with a scenario in which NG doesn’t excel, so I expect activity in the dry gas basins to pick up a lot.
Interesting stuff thanks for that. So one would expect high NG prices and low oil prices going forward if the Sec of energy does what he said.
An alternative scenario on Trumps stance to Iran-
He may offer a deal (under threat of force) whereby Iran commits to keeping their influence within their borders in return for an easing on sanctions. The countries of Saudi Arabia, Turkey and Israel would all cheer Iran being forced to turn inward, and it would give them a chance to cement their influence and security, perhaps even in some form of tolerance for each other.
We’ll see what influence M. Rubio can bring to bear.
It is possible that both the Iran and Russia sanction scenarios get some reversal over the next 4 years, after some sort of settlement of conflicts is achieved. Trump may find China to be in partners in alignment on that goal.
This is a painting of a rosy scenario, unless you are an Islamic fundamentalist/nationalist.
https://www.politico.com/news/2024/11/08/donald-trump-iran-assassination-plot-00188498
Iran had a plot to assassinate Trump.
Trump is not a 4 dimensional chess wizard.
If you go after him, he will go after you.
Mr. Trump usually follows through on his promises
Do you have a list of his promises in his first term, and they worked out?
Trump will do whatever Putin tells him to, and Putin doesn’t give a crap what lies Trump told on the campaign trail.
By now, the Master is not satisfied with what the servant is proposing. Whe shall see.
Gerry
The new guy has made many promises and I am not sure how he can keep all of them. Here is a list.
– Settle Ukraine war before inauguration. Now: Might take 100 days
– Cut food prices. Now: Difficult to lower prices after they have gone up.
– Cut the price of gasoline in half. Now: Drill baby Drill. As you note it will be difficult to increase US production much beyond what B did. If it drops he will get the DOE to stop publishing the monthly numbers. Cost saving.
– Promises “Hell on Earth” if hostages not released before inauguration. Now: Sending his deputy to plead with Netanyahu to please please accept a deal.
– Take over the Panama Canal
– Buy Greenland. Now: Greenland President willing to talk about more cooperation with US.
– Tariffs on Canada and Mexico. Canada is the primary supplier of heavy crude to Western and Gulf refineries. 25% tariff on Cdn crude will raise the price of gasoline in Western US from $3/gal to at least $3.75 over night. That would be a major black eye on T. Canada supplies a lot of electricity to North Eastern US states. There is talk of imposing an export tax of 25% on the electricity. T says the US doesn’t need anything from Canada. I hope some of his advisors wake him up. But of course he is the smartest man on earth and knows everything.
So the hostages is probably a big issue for him because he always criticized B for not getting hostages back and had to pay a big price to get them back. He also refuses to say what “Hell on Earth” means. Bombing more Hamas cells in Palestine will not go over well. I think that he has handed Hamas a real lever on Netanyahu, such as release more Palestinians. Also if N gives in what will he extract from T to recompense.
I fear for what happens on January 20. The world will be thrown for a loop and I hope that saner minds will prevail.
https://news.sky.com/story/donald-trumps-middle-east-envoy-pushes-for-gaza-ceasefire-deal-ahead-of-us-inauguration-13287325
Hi Ovi, I knew my note would get your blood pressure up, which was not my intent. As I said, I’m pretty apolitical on this. I have been wondering how in the world he planned on getting the price at the gas pump down when the big wells in the shale basins weren’t exactly tonning the money. Finally I came up with the idea that these wells have become so gassy that the hydrocarbon stream from them is about 50 gas, and if gas sells high while oil sells low, he can achieve his goals. The Permian boys will drill, baby, drill and sell one-half of their product at a premium while the other one-half sells at a discount. I don’t know, we’ll see, but the man has some world class help on the energy front. I hope he doesn’t tariff your Canadian tar sands oil but I fear he will–at least for a little while–in order to make nice with the Saudis. LNG can’t get too wild bc there aren’t enough LNG trains in the right spots.
24 kept; 23 compromised; 55 not done.
https://www.politifact.com/truth-o-meter/promises/trumpometer/
Gerry
Look who just got a meeting with T. She probably was able to talk real turkey with him about the stuff he doesn’t need from Canada.
Alberta Premier Danielle Smith visited Mar-a-Lago, the Florida home of U.S. president-elect Donald Trump, on Saturday.
Smith confirmed the visit in a social media post Sunday morning, in which she said she and Trump had a “friendly and constructive conversation.”
“I emphasized the mutual importance of the U.S.-Canadian energy relationship, and specifically, how hundreds of thousands of American jobs are supported by energy exports from Alberta,” Smith’s post said.
“I was also able to have similar discussions with several key allies of the incoming administration and was encouraged to hear their support for a strong energy and security relationship with Canada.”
https://ca.yahoo.com/news/alberta-premier-danielle-smith-visits-185954473.html
I’ll bet Trump likes Danielle Smith; the problem was Trudeau. Trump likes strong people who are willing to fight for something, and he can’t stand weakness. It’s like the Oilman’s verse that was made famous by J. Paul Getty: The meek shall inherit the earth, but not its mineral rights.
Trump likes strong people who are willing to fight for something
That suggests he’s willing to fight for unselfish, high minded principles. Yet he seems to promote naked self interest: America First, making money is the most important thing, etc. That fits well with the Oilman’s Verse, which seems to celebrate naked self interest at the cost of the meek. I’m not sure I’d call that strength. It seems more like aggressive theft from easy victims, as we saw Russia attempt in Ukraine. To put it another way, is the robber of a blind man strong?
Trump has been threatening Greenland, which has a population of 57k. He’s been threatening Panama, which has no military (because it trusted in its alliance with the US!). Is this strength??
Trump suggests that he has restored the US’ reputation for strength. This absolutely not true – he scares them not with strength but with destructive policies that are win/lose, not win/win. He seems to see the world as a zero-sum affair, in which you have to steal from your neighbors rather than trade with them. This is a centuries old point of view which is pre-industrial, but which Russia is still following. Sadly, Trump appears to have no knowledge of economics and be unwilling to have anyone around him who can disagree with him.
Finally, is naked self interest really what you believe in? If not, can you give examples of his taking a serious risk to promote an unselfish principle?
You need to find yourself a politically motivated person to spar with. I have merely made some observations about what I think the man plans to do, but have studiously avoided politics. As to stealing from your neighbors, I almost always overpay when I buy minerals, so the Oilman’s verse is not my mantra.
“can you give examples of his taking a serious risk to promote an unselfish principle?”
Gerry, Nick is not asking you a political question. He is simply asking you to back up your observations with examples. You are the one who started the political conversation.
“is naked self interest really what you believe in?
I almost always overpay when I buy minerals”
Gerry, from your answer I would conclude you do believe in “naked self interest”. I’m assuming no one is forcing you to purchase anything. It’s a free market. You seem to believe you should be able to purchase your desired mineral rights at your estimated value and not the market. But the truth is, the value of the mineral rights is what you paid for them or your a bad business man and make poor decisions. You seem to think you should have been able to purchase the mineral rights at a “naked self interest” price.
Gerry,
I appreciate the thoughtful response. I agree you with about deal-making: I think it’s a bad idea to insist on pushing a deal as far as possible: instead, you should sometimes leave something on the table to maintain good business relationships. I think it’s worth considering that Trump has said that he does not agree with this approach; he thinks he should squeeze everything he can.
Meanwhile…I think that what you mean by “political” is what I would call “partisan”, or “unobjective”. I try very hard to not follow a crowd, but instead to come to my own conclusions, or at least rely on people whose opinions I’m confident about. After quite a bit of research (listening to old interviews, reading one of his books, reading history including Woodward, and following science and scientific opinions) I’m confident that trump’s policies are generally umm…non-optimal, and that his statements cannot be relied upon.
I appreciate that you feel that Trump is a good thing for the FF industry. I think that probably isn’t realistic. If there’s anything normal business dislikes, it’s volatility. It’s great for speculators, but in the long run Trump will drive people away from FF, towards renewables which are domestic and relatively very stable.
Finally, if you want to avoid “political” discussions, you have to write extremely carefully and thoughtfully…
Gerry
This headline came out around 10:30 this morning and immediately reversed the rise in Cdn oil stocks associated with the $2/b jump in WTI today.
No indication Trump will back down on tariffs, but retaliating not the answer: Smith
EDMONTON — Alberta Premier Danielle Smith, fresh off a weekend visit with U.S. president-elect Donald Trump, says if Ottawa uses an energy embargo to combat the incoming administration’s promised tariffs, it would spark a “national unity crisis.”
“Oil and gas is owned by the provinces, principally Alberta, and we won’t stand for that,” Smith told reporters in a virtual news conference Monday.
Foreign Affairs Minister Melanie Joly hasn’t ruled out an energy embargo in response to Trump’s promise to impose punishing 25 per cent tariffs on Canadian products.
Alberta’s premier said Canada needs to be prepared for tariffs to come into effect Jan. 20th, Trump’s first day in office. “I haven’t seen any indication in any of the president’s public commentary, or even in the comments that he had with me, that he’s inclined to change his approach,” she said.
If Alberta’s energy exports were taken out of the trade equation, the Americans would have a trade surplus with Canada, she said.
“That’s an argument that I think should allow us to say that we should continue to have a tariff-free relationship, because they need our energy,” she said.
I have to wonder what T’s energy advisors are telling him. I wonder if he thinks the increase in gasoline prices won’t last long. Maybe he is going to ask the CEO’s of XOM and CVX to increase production immediately and production will slowly rise and the price of gasoline will be back below $3.00/gal within 6 months. Lots of luck
https://www.bnnbloomberg.ca/business/politics/2025/01/13/no-indication-trump-will-back-down-on-tariffs-but-retaliating-not-the-answer-smith/
Ovi,
I think the simple policy response would be to impose the same 25% tariff on goods that the US exports to Canada, or to do nothing, not sure there are any good policy choices when your neighboring country has elected a moron for its leader.
Dennis
The govt is looking at specific products that would upset a lot of Americans. Oranges and orange juice would be one item because it would go after the Trump base in Florida. The other thought is to put an export tax on electricity if we could get Quebec and BC to agree. Ontario has already proposed that idea. We also have some precious metals that China has stopped sending to the US and Canada is the only source.
In the meantime we send our Cdn water bombers to help put out the fires in California. I am not sure that T is happy with that. This Cdn water bomber is unique because it lands in the ocean and fills up while taxiing, takes off and dumps more water on the fire.
https://www.instagram.com/tmcbphoto/reel/DEtnxQYM2xT/
Ovi,
In any case, know that less than half of Americans voted for Trump (49.8% at last count).
It is unfortunate that the US allows convicted criminals to be elected president, but the founding fathers did not envision democracy at it currently exists in the US. Perhaps Trump will only do two years of damage and the Democrats can flip the House in 2026, the Senate is a lost cause as it is not representative of the US population with small states like Wyoming having an equal number of Senators as California (this results in each citizen of Wyoming having 66 times more representation in the Senate as a citizen of California.) This is why the US is so far behind all other advanced nations in basic services like providing affordable healthcare insurance for its citizens.
Lets not put down morons by comparing them to Trump.
Hightrekker,
Trump is in a class by himself, not quite up to the standard of common morons.
HT you must be old school. From Google AI-
“The term “moron” was coined by Henry H. Goddard, a researcher and prominent member of the eugenics movement. Goddard believed that low intelligence was linked to criminal behavior and that “better breeding” could improve the American population.
“Morons” had a higher level of development than “imbeciles”, but their intelligence was similar to a normal 12-year-old child.
The term “moron” is no longer used as a medical term. It was once used in psychology and psychiatry to describe a mild intellectual disability.”
criminal behavior- Donald Trump became the first former American president to be convicted of felony crimes Thursday as a New York jury found him guilty of all 34 charges in a scheme to illegally influence the 2016 election through a hush money payment to a porn actor who said the two had sex.
similar to a normal 12-year-old child- Trump referred to Gov. Gavin Newsom as “New-scum,” questioning the governor’s response to securing the southern border. “New-scum” joins a long list of other names Trump has used over the years, such as “Little Marco” for Marco Rubio, a slur against Senator Elizabeth Warren as “Pocahontas,” and “Sleepy” Joe Biden.
Thanks for posting that news article, Ovi. I like Danielle Smith’s approach. Whatever happens, I suspect it will be a transient dislocation in the trade balance. To be frank, there may be a little jealousy involved, as I’m suspicious that Chris Wright and Doug Burghum have informed Mr. Trump that Canada holds more oil than the USA does, and that their fracked shale has actually produced better (the Canadian drillers and frackers use wider spacing). I wouldn’t worry too much about Suncor; they’re sitting pretty.
Like I said in my original note, there is almost certainly going to be a very substantial resetting of the global geopolitical arrangement, shifting around the production and sales of energy. I have no idea where this is going but it’ll be an interesting thing to watch.
Ovi, I hope that you and all other Canadians know that most US citizens are very uncomfortable with having any sort of contentious relationship with Canada and its people.
I’d bet less than 10% of people would vote for policy along those lines.
Hickory, I would hope your right. But, I have to say I would not take the less than 10% side of that bet today. Actually, I wouldn’t be surprised if 10% of Americans couldn’t locate Canada on a map.
Trump tariffs on Canada would equal higher unemployment in Canada. It would mean aggressive rate cuts by their central bank.
Trump tariffs on China will lead to Chinese yanking their money out of Canadian real estate because they have holes to plug at home.
Canada isn’t at all prepared for what is coming. Any retaliatory measures will just make the situation worse. How far does Canada want their currency to fall? 500% or 1000% ? We could see 10 Canadian dollars equaling 1 US dollar.
Very few people grasp the gravity of the situation.
HHH
I do not understand how Canadian currency’s value can fall by more than 100%. Seems like that would be worthless.
I also do not understand why Canada is defenseless to any aggressive tariffs which could be enacted. I believe the stateside importers need that oil to produce gas in the USA just as much as Canada needs to sell it.
DCLonghorn,
It is a ratio US$ to Canadian dollar. Assume we start at 1 to 1 to make math easy. A 100% decline just means Canadian dollar falls to 50 cents US, it is worth half of what it was and the US $ costs twice as much as it did before.
You are correct that tariffs are a dumb idea, Trump was sleeping in his economics class and has very bad advisors. The tariffs will likely be matched by Canada on goods meant to create maximum pain for the US. The US exports a lot of goods to Canada and tariffs imposed will hurt those industries in the US while the tariffs on Canadian imports will result in higher prices for US consumers leading to inflation. Overall the economy will do worse due to the disruption caused which could either lead to stagflation or perhaps to a Depression. The entire World will be affected as Trump plans to disrupt everything in the World economy with tariffs so we can go back to the good old days of 1930-1933 when tariffs were in vogue.
Trump has never read a history book he is unfit to be President.
Dennis,
Sadly, Trump has revealed his primary reason for tariffs: to fund income tax cuts.
Republicans have been dying to replace progressive income taxes with regressive sales taxes for years. And, tariffs are regressive sales taxes…
It’s a classic Trump deception: he pretends to victimize foreigners, and instead is aiming at low income Americans.
Dennis
Sorry, but HHH’s question of “How far does Canada want their currency to fall? 500% or 1000%.” is not an actual math question as far as I can tell. Current exchange rates are about US $7 to CAN $10. Perhaps you can tell me how the exchange rates would be with a 500% and a 1000% relative decline.
The actual point which I was trying to communicate is that beyond the bluster of a falling sky, Ttump will have a very hard time taxing Canadian oil exports to the US because the USA needs to refine a lot of that oil.
DCLonghorn,
I think Trump tends to be a lot of hat with little cattle, so a lot of his proposed policies are just a lot of bluster and should probably be ignored.
Remember how he claimed Mexico would pay for the wall he planned to build? As far as I know Mexico didn’t pay a dime.
The tariffs are just a dumb idea, this time there are few advisors willing to tell Trump the truth, he has surrounded himself with loyalists that will tell him what he wants to hear.
Canada is down hill from the mess China has become. Via decades of hot Chinese inflows into Canadian real estate. Anybody thinking Canadian real estate can’t take a 50% hair cut is fooling themselves.
The home loans are all backed by the government. Everything they’ll have to do in response will be currency negative.
Canada will need every dollar of income it can possibly get. Hopefully direct tariffs on Canadian goods and services can be avoided. But even if they are avoided it doesn’t mean Canada is in the clear.
But if we get into a shit show. Canada will definitely be on the losing end of it.
The US needs our lumber and our oil, and our auto industries are joined at the hip. The tariffs are just stupid, and would be difficult for even a competent team to implement…and Trump’s team is not competent.
Remember the massive Military Parade Trump wanted? The Infrastructure bills? The death of Obamacare? That may be the guiding star for the Second Trump Administration: his base (and Trump himself) have very short attention spans. There is so much stupid stuff coming down the line that it will be easy for them to forget or ignore the failed threats and promises.
Trump will back down and declare victory (“My actions have resulted in continuation of Canada/ US trade!”), and then think up something else that is stupid and impossible to achieve to fill up the space.
LLoyd. I think you read the situation correctly.
Gerry,
I agree chaos is likely with Trump just like his first term in office. The problem is that now there are no guard rails on Trump so the chaos is likely to be much worse than before. Those predicting a Depression may be proven correct, there is a reason isolationism has been considered bad policy by foreign policy experts since 1939. I guess most US citizens are not aware of this. Perhaps they will read some history, probably not.
your Middle East scenario is uncertain given that a ceasefire agreement has been signed but the application of which is uncertain.
Ovi,
Great work as always and great resourcefulness getting the Russia production data from Argus proxy.
Though i don’t understand this statement:
Saudi Arabia along with other countries that were scheduled to reverse their cuts in October 2024 have now delayed them to April 2025 because of lower than expected China/World oil demand.
Shouldn’t they not delay the production cuts because of this ?
My price prediction:
Closing price Dec-2025 WTI = $95
Average price WTI 2025 = $85
Iron Mike
Thanks
Recall that OPEC was supposed to start reversing their cuts I think in October 2024 but delayed them due to market conditions.
When OPEC made the decision to postpone the reversal of the cuts in December to April 2025 WTI was $68/b. The consensus I have seen is that OPEC wants oil to be in the low 80s, WTI $80/b, Brent $85/b.
It seems that their reading of the tea leaves was pretty good. Here we are in Mid January and WTI is back to $76/b and Brent is just under $80/b.
Starting in April OPEC will begin to reverse their cuts by 138 kb/d for 18 months.
https://www.reuters.com/business/energy/opec-will-delay-oil-output-hike-meeting-source-says-2024-12-05/
Ovi,
Ohh i get you. Reverse their cuts, sorry my bad. So they want to increase output in April.
I think you are right they want prices to be around the 80s to mid 80s region. Lets see how it plays out.
Ovi,
If they follow the planned increases oil prices are likely to fall, oil demand is likely to be less than OPEC predicts.
Dear Everyone
First of all, i apologize for the quality of the posted chart, it’s truly hideous.
Attached is the C&C production of russia from 1949 to 2021 by field (around 90 have been studied). I have not extended the chart to 2024 since i still need to find data for many fields. The data come from public sources, mainly gem.wiki, offshore technology, russian publications (especially for the eastern siberia fields), TheOilDrum posts…
A forecast is still in work but there are already many things that can be learned :
– most of the large fields who have sustained the production during the USSR era are now well depleted
– most of fields being put into production now are small and oftenly doesn’t produce more 20 kb/d. The Uvat complex, for exemple, which was one of the last great project being developed, was completed by putting into production dozens of fields, many of them having not exceeded 10 kb/d.
Priobskoye and Vankorskoye, respectively the thick pale green and the less thick strong purple, developped in the recent years, are both in decline. Their decline being one of the main reason why the russian production have fallen so sharply these recent years.
Opinions below
There are many forecast about the russian oil production but i really believe that most of them haven’t realized, or studied, how depleted are now most of the russian oil fields. Without the development of the bazhenov shale (salym shale project if i remember well) and those of the vostok cluster (notably the Zapadno-Irkinskoye field) i have serious concern about the futur of the russian oil industry. And given the importance of the oil sector for the russian economy, i’m also concerned about the futur of russia as the country we know now.
Thank you Frenchfries. Would love to see a more detailed version of your work.
I’ll put my hat in the ring with 2025 average price of $85 and end of year $105. The underlying facts aren’t going to change–all wells and fields have profiles similar to FF’s chart. What’s left to change is market focus–modulating from demand to supply. I’ll go out on a limb and say that when oil supply remains static under Trump, as the EIA projected plateau draws nearer, as wind and solar projects get shelved for growing insurance and funding problems, and with a few more pithy Landmen episodes, the market will soon turn its focus to oil supply.
PAOil,
If chaos is good for the economy then things will work out well. Generally a chaotic environment is not a positive environment for investment and higher consumer spending, the opposite tends to be the case. The chaos starts Jan 20 and the economy will be headed down as a result, oil prices may fall as Trump has promised due to lack of demand for oil.
Frenchfries,
Save your chart as a gif or jpg and it will allow higher resolution. You should aim for a maximum file size of 55 kB for your image.
Or send it to [email protected] and I will repost it for you.
slightly better image from French Fries, click on image to open in new window and then enlarge in browser.
Note to all,
I asked French Fries about the gray area at the top of the chart, that represents output from fields that were not studied (my guess is that this is due to lack of data, but that is speculation on my part).
I wrote a short one comparing Vaca Muerta with major US shale patches,
https://www.linkedin.com/posts/sheng-wu-192181139_vaca-muerta-shale-oil-gas-production-pattern-activity-7284111629028409344-PXcN?utm_source=share&utm_medium=member_desktop
Sheng Wu,
What are the average lateral lengths of the Vaca Muerta wells and what is the spacing? Also the data looks to be a very limited sample of wells, not sure this is a valid comparison we are comparing 10 wells (which may have been the 10 best wells completed) with a data set from the Permian basin based on about 3000 to 5000 wells per year.
Dennis,
You raised the good questions.
1. The VM laterals follow the latest trend in US shale patches closely, and many are close to or over 3km in the past 5 years, but very few are over 3km in the lower GOR API black oil blocks. Overall, they might be shorter than the latest laterals in the US, but not by much. So, in terms of normalized per foot productivity, VM is even better. But, fewer of VM laterals are infills, and the infills are generally worse, but not by a huge margin like often seen in Permian or Bakken.
2. The number of data set from VM is much smaller than US Permian or Marcellus, but they are not cherry-picked, but rather average. The cherry-picked lower GOR API black oil blocks, e.g. the 10-well BPE, could be producing 8KBOPD, that is over 800barrels average per lateral, and 1 already made 1million BO in 18 months to be the #1 in VM, and 2 are close to 1million with GOR around 300scf/bbl API~30deg. Another well in BPO closer to BPE with GOR at 400scf/bbl, already produced 1 million in 10 months.
More about VM shale oil and gas,
this PDF link here, http://hidrocarburos.energianeuquen.gov.ar/storage/uploads/KuBIxAH7aYkoXk9dv1mALAXyssx4Io3djF6esX6H.pdf
it has the 2024 year end report for VM shale oil and gas, and they use dual units,i.e. oil in bbls and gas in cubic meters. Yet, they use MMm³, as million m³; and MMbbl as million Barrel, it is very confusing.
The link below also seem to use the dual units, but they seem to use “M” as “million”, and if no “M”, that still means Kilo, and they arrive at a GOR number that has no clue where it come from, obviously they got lost doing unit conversions. So, one has to do the calculation thru the correct unit conversion.
https://app.powerbi.com/view?r=eyJrIjoiNDQ1OGQ4MGMtYmQyYi00NzYxLWFlNTMtOGI0ZjRhZGE4NTBkIiwidCI6IjVmMThiN2ZhLTdmMmQtNDQ5ZC1hZjhkLTliZTNiM2ViZmFhYSJ9
This link gives the production of shale oil and gas in VM, with detailed information for each well.
You could see the new star blocks, i.e. the La Calera, where the latest wells could produce peak IP oil over 2,000 BOPD and over 300K m³ gas, truely amazing.
NICK G: “I appreciate that you feel that Trump is a good thing for the FF industry.”
Now you’re divining my feelings, and when someone does that and attaches my name to it I get touchy. Not only do I feel that Mr. Trump is not a good thing for the fossil fuels industry, I don’t even know anyone who does. We were faced with two choices, and the other one was on record as saying she would ban fracking on her first day in office. She later retracted that, but if you make your living from oil and gas, it is possible to “divine” what her position is without much trouble.
Contrarily–and I hate to get into this at all–it is pretty obvious that the large oil and gas people “played” Mr. Trump by reassuring him that we have plenty of shale to last us and that we have plenty of room to drill, baby, drill. We actually could put more rigs to work and hit that three million mark that Scott Bressant talked about, but nobody would make any money, and our remaining acreage wouldn’t last long. By now Mr. Trump has been thoroughly versed on the economics of shale, and hopefully, also the geology. In fact, I wouldn’t be surprised if that is what stirred his interest in Canada. Fortunately, he has installed a very well qualified sec of energy in Chris Wright, who is both Berkeley and MIT trained and knows all forms of energy. Doug Burghum, the current governor of N.D., has a very good working relationship with the province of Alberta and the oil and gas industry in both N.D. and Canada. I can assure you (without knowing any of these men personally) that neither man thought up the tariff concept. This is Mr. Trump being Mr. Trump, pure and simple. I personally think it’s a horrible idea but I am not being asked.
Look, I go by my real name when I write something so I don’t just fire from the hip and say a bunch of stuff. I usually express myself fairly well for an eighty-year-old man. I do not denigrate others. I make a good effort to remain apolitical. I am not Mr. Trump’s apologist. I resent being demanded to explain myself by someone who refuses to use his real name. To me that’s, well, I won’t say, but it has chicken in it.
Regarding the purchase of minerals, it is obvious that some of you have never owned or tried to purchase minerals. Buying minerals for income is sort of like selling insurance in California for income: easy, mostly intuitive, and it usually works out for the best but not always.
Adios.
The gap between US nat gas consumption and production is not that large.
The export capacity of the LNG facilities being built in USA seem to exceed current exportable surplus.
Absent ‘rapid’ discovery & development of vaunted Arctic etc reserves then the LNG export terminals will be in reality import terminals.
I am sure this has long been known by recent administrations. They are far from stupid.
Canada, ‘coincidentally’, is also building an LNG export terminal.
If that is not enough, I simply point out that the arctic sea route from Russia’s new Arctic LNG train is a lot shorter than importing, say, Qatari or Iranian LNG. But the Russian complex is allegedly delayed by lack of US equipment. Maybe. Maybe not.
Laurie,
The import terminals for LNG are very different from the export terminals, they are not interchangeable.
If there is not as much cheap natural gas as claimed, the LNG export terminals will prove to be a very bad investment that will become stranded due to not market for the LNG at a price that will be profitable.
According to ai results modern terminals canbedual
Yes, an LNG (Liquefied Natural Gas) export terminal can also be used for imports under certain conditions:
Operational Flexibility:
Reversible Infrastructure: Many modern LNG terminals are designed with the capability to handle both imports and exports. This involves having infrastructure that can be switched between liquefaction (for export) and regasification (for import) processes:
Liquefaction: For export, natural gas is cooled to -162°C to become a liquid, which can then be shipped.
Regasification: For import, the LNG is warmed back into gaseous form for distribution through pipelines.
Dual-Purpose Terminals: Some terminals are built with dual-purpose facilities where the same docks, storage tanks, and pipelines can be used for loading LNG onto ships for export or unloading it for domestic use. This requires:
Flexible Storage: Storage tanks that can manage both liquid and gaseous forms of natural gas.
Convertible Jetties: Jetties that can handle both loading (export) and unloading (import) of LNG carriers.
Examples:
Freeport LNG in Texas: Initially built as an import terminal, it was converted to handle exports and can switch back to imports if needed.
Energia Costa Azul in Mexico: Originally an import terminal, it’s being converted for export but retains the capability for imports.
Challenges and Considerations:
Economics: The economics of switching between import and export modes can be complex, involving:
Operational Costs: The cost of converting from one mode to another, including maintenance and operational adjustments.
Market Dynamics: The need for terminals to adapt to fluctuating global LNG prices and domestic demand.
Regulatory and Infrastructure Needs:
Permits: Regulatory approval might be needed to switch between import and export operations, especially if the facility was initially licensed for one specific purpose.
Pipeline Infrastructure: Ensuring the pipeline network can handle the flow of gas in both directions or has the capacity to distribute imported gas.
Technical Adjustments:
Equipment: Some equipment might need to be reconfigured or adjusted for different operations, which could involve downtime.
Safety: Ensuring safety protocols are in place for both liquefaction and regasification processes.
Strategic Implications:
Energy Security: Having terminals that can switch between import and export adds to national energy security by allowing countries to respond flexibly to changes in domestic production or global supply disruptions.
Market Opportunities: It allows operators to take advantage of price arbitrage between domestic and international markets, buying cheap LNG from abroad when profitable or exporting when domestic supply exceeds demand.
In conclusion, while LNG terminals are generally optimized for either export or import, many are or can be designed with the capability to do both, offering strategic flexibility in the global energy market. However, the actual use for both purposes would depend on economic viability, regulatory permissions, and infrastructural readiness.
Laurie,
Article below breaks out some of the costs, the liquification of natural gas to produce LNG from natural gas is a major part of the cost, these facilities are very expensive.
https://www.linkedin.com/pulse/overview-global-lng-plant-develepment-costs-reza-naghash-cpm-p-e-
Also there is this forecast from April 2024 which foresees excess LNG capacity by 2028.
https://ieefa.org/sites/default/files/2024-04/Global%20LNG%20Outlook%202024-2028_April%202024%20%28Final%29.pdf
Chart from LNG Forecast
Thanks, Dennis.
Global oversupply of LNG is the point.
Canadian & US liquification plants are probably already sunk costs, but global LNG liquification capacity will almost certainly exceed the demand from pipeline connected degasifiers in other countries.
This means that US and Canadian LNG liquification plants will, on the face of it, become stranded assets, as cost will exceed the low international spot prices at the hubs.
Even Russia’s mighty Gazprom have gone through periods when they had to sell gas (under contract) at a loss. But long term oil/gas-indexed contracts seem to be used only for certain customers (China) these days.
By reconfiguring the US plants to degasify foreign gas, US may be able to access close-at-hand natural gas at a medium price range.
Will demand for natural gas in USA increase? Probably. Peaking gas-turbine plants will be needed to cope with huge night-time (and cloudy daytime) power demand in summer (airco). Similar in winter. Grid access will be a problem, but nat gas turbine for some of the huge ai data centres on the books (2 Gwatt and higher) will be but one increasing use, and (in association with in situ batteries) can probably side-step the grid.
Arguing against myself, lowering costs of massive battery storage and solar may create a ‘cap’ on how much industry will pay for natural gas.
Distance an LNG cargo has to travel adds costs. Therefore pipeline gas and country proximity will be key to profitability. Canada may become captive to the US market.
Laurie,
The capacity to gasify is less expensive than the liquification process. I agree re-working terminals to convert LNG back to NG might be necessary, but the US and Canada have a lot of natural gas and may not require much increase in this capability (except perhaps New England whose pipeline access is cut off by the policies of New York.) More import capacity will be needed Worldwide if all of this capacity is built and utilized, I think a lot of it will become stranded investments as we are seeing currently for Australian LNG facilities.
Demand for natural gas may be less than forecast as nations start to follow the lead of Japan and South Korea that are moving away from natural gas in favor of nuclear and renewable power.
Gerry,
May I commend you for your post. Sadly on this blog there are many who tray and second guess your thoughts and others that either cannot or will not accept alternative points of view. I post under a pseudonym of Carnot, Carnot was a very clever thermodynamicist and everything we do is governed by the 3 laws (of thermodynamics). There are others posters on this site such as Hideaway and Ervin who both endeavour to challenge certain posters polemic points of view. I remain thoroughly unconvinced about climate change; that is my view of 0.8g of carbon dioxide per cubic metre of air ( sea level). Renewables are turning into Ruinables as the claims of low cost dispatchable power recede into the distance. I will keep beating my drum. The most important global problems are overpopulation and resource depletion, and unreliable ruinables will only get us to the cliff edge sooner. Though I have spent my 46 years of working life in the oil and petrochemical industry I am fully aware it is a limited one time resource, and should not be squandered building unnecessary overpowered electric and ICE vehicles.
Carnot,
Climate change is not a matter of opinion any more than the Laws of Thermodynamics. Most scientists understand this though a vocal minority disputes this supported by oil industry executives that try to spread doubt.
Do you also believe that smoking cigarettes is good for you? The same strategy was used by tobacco companies to spread doubt about the harms of smoking cigarettes.
Dennis
Scientists only recently have been studying how much global warming is caused by destruction of plants.
https://bag.leeds.ac.uk/projects/restoring-hardknott-forest/blogs-and-more/the-cooling-effects-of-tree-cover/#:~:text=There are two processes that,through the process of transpiration.
Sunlight falling on untouched grasslands and woodlands causes very little warming, no more than the ideal for plants to grow and produce crops.
Surface Areas cleared of tree can become extremely hot, dry mud reaches temperatures of 100 degrees and more. The air becomes very hot and dry moving quickly it drys other areas. Concrete and tarmac can reach temperatures of 150 degrees.
Globally 15 billion trees are destroyed each year and millions of acres of land is covered in concrete. Globally temperatures have changed the least where ground water and trees have been least impacted.
Temperatures have increased the most where most land has been built on, trees destroyed and ground water exploited.
Obviously CO2 increases adds to the mix.
Loadsofoil,
The urban heat island effect has been studied for decades, this is not something new. I can find references back to 1973 with a cursory search. See references at article linked below.
https://www.researchgate.net/publication/226392936_Global_Warming_and_the_Urban_Heat_Island
Carnot, do you realise physics doesn’t care about your view of the ppm of CO2 in the atmosphere?
Carnot,
How do you account for the surface temperature differential between Mercury and Venus ? Surely GHGs play a crucial role here.
Iron Mike,
Carnot thinks chemical engineers know more than geophysicists, or so it seems.
Dennis,
Did you get out of bed on the wrong side? Good science depends upon discourse and respect for other points of view. Sadly you are resorting sneering personal comments on my working background implying I am supporting the petroleum industry.
You are so wrong, but I do realise its absolute necessity in maintaining the global population in a position that it might just survive with the careful husbandry of remaining natural resources.
As an academic your view of the world is rather different to my own. Many academics are insulated from the real world of commerce, and follow an Upton Sinclair approach on not understanding something when their salary depends on them not understanding it.
In my 46 years of employment I have worked with people of of all races and skills. These days I do no have much faith in qualifications. Some of the best people i have worked with have not had a degree or only a first degree yet they knew there stuff. Some of the worst people that I have come across are those academic and business types who think think they know their subject but have never gotten their hands dirty.
You make many projections about future oil production which is fine. But what really goes on way down in that deep, barely permeable shale reservoir is something that you can only guess at, and your methodology of treating it like a homogenous sugar cube is little more than hopeful. Few people on this blog can understand the physics of solution gas drive.
Likewise there are many experts on this blog who know much less than yourself, but it seems to me that these experts act like rabid dogs when someone offers a different point of view. Please keep things civil.
Carnot,
You often come across with a sneer as well. Did not mean to imply you support the petroleum industry and I also did not say that, you misunderstood what I wrote.
I am not an academic, this is just a hobby for me. I know there is great variability from well to well, I use basin averages because it is convenient for presentation and I have very limited data availability and don’t have access to subscriptions for data that cost ten thousand dollars per year or more. I don’t have any industry connections where such data might be available.
My comment on chemical engineers (I am guessing that may be your undergraduate degree as is the case for many experts in the refining industry) vs geophysicists is simply that geophysicists see clearly the connection between carbon dioxide and climate change as pointed out by Iron Mike and you apparently do not based on your comment.
I do not consider every point of view valid, in many cases there is well settled science where alternative points of view are simply incorrect.
Actual geophysicists laugh at climate change.
You aren’t one.
It looks like real geophysicists disagree:
https://www.geolsoc.org.uk/~/media/shared/documents/policy/Statements/Climate Change Statement final new format.pdf
https://www.agu.org/Share-and-Advocate/Share/Policymakers/Position-Statements/Draft-Climate-Change?m-search-result=Climate
Timthetiny,
Correct I have never studied geophysics, my undergraduate degree is in physics.
“I go by my real name when I write something so I don’t just fire from the hip and say a bunch of stuff. I usually express myself fairly well for an eighty-year-old man.”
Denial is a defense mechanism that involves rejecting or avoiding reality to avoid discomfort or anxiety. It’s a way for the mind to protect itself from uncomfortable truths.
A person with a substance use disorder denies that they have a problem
A person grieving the death of a loved one denies that the death has happened
A person in an abusive relationship denies that their partner is harmful
A person who shops a lot despite being financially insecure denies their financial reality
Denial can be a way to avoid cognitive dissonance, which is the mental stress of holding contradictory beliefs
Denial can be an adaptive mechanism that helps people balance the benefits of self-awareness with the costs of mortality
Denial can prevent people from addressing problems and making changes
Denial can be damaging when used regularly in adulthood
Gerry, when that brush up the hill comes at you like a fire hurricane and there wasn’t an Insurance company that would sell you a homeowners fire policy. Than your 5 million dollar home lays in ruins after working your entire life to aquire it or you can’t sell it for 20 cents on the dollar because the buyer can’t insure it. Maybe you will come to realize Harris knew something about the burning of every last bit of fossil fuel man could dig up, that you refuse too.
BTW, no one demanded or put a gun to your head to answer a question. Your here on your own free will.
Gerry,
I’m really surprised. I certainly didn’t think you’d be offended by my recognition that you preferred Trump. You replied that you didn’t think he was “good”, instead he was just…”better”. That was worth throwing out insults for?
On the other hand, I’d argue that you still have an unrealistic view of Trump. For example, his new DOE nominee is badly unqualified: he has no government experience; he believes climate change is false and that renewables are failing. Again, just because a person is an advocate for the FF industry doesn’t mean they are qualified or necessarily even actually good for the FF industry: if you’re going to be a good advocate you have to have a good grasp on reality.
If climate change was false, and renewables not viable, the FF industry would face a very different set of challenges. But it’s not, and they are, and the only question for the FF industry is how to decline as gracefully as possible. It’s somewhat similar to the challenge posed by China: will the US’ relative position decline slowly and gracefully, or awkwardly and quickly?
In both cases, Trump seems determined to go for the awkward and fast route.
And in the end…the president is supposed to look after the best interest of the whole country and not just the O&G industry. I think it’s unreasonable to expect people in the industry to be enthusiastic about the inevitable transition, but I do hope for agreement on fundamental facts.
Checking in on a random graph from 2.5 years ago…
Curious to see if this long term decline continues…
Hi Kengeo,
Here is what data looks like now for Saudi crude oil output through November 2024. he red line is the centered 12 month average output and a second degree polynomial and straight line OLS are also shown on the chart, extended forward by 6 years.
Here is Saudi C plus C from EIA, annual data through 2023.
Trump is hyper focused on the trade balance. When more oil and gas for export doesn’t materialize. Only option he’ll have is more and bigger tariffs.
Ultimately tariffs mean fewer dollars circulating around the globe. While the dollar denominated debt remains the same. It’s a recipe for deflation.
America’s chronic trade deficit is easily explained: Americans consume more than they produce. Blaming foreigners for this is childish.
Actually, from a different perspective the US doesn’t have a trade deficit: we export a bumper crop of treasury notes. Many of them become reserves, other become a money supply for other countries.
The problem with this is we have a fairly serious case of Dutch Disease: it’s contributed to a manufacturing sector that is smaller than would be optimal.
And if I understand it correctly, this is partly due to the relative reliability of the US government and economy (the US government has never defaulted! This is unheard of…), but it’s made much worse by unnecessary US deficit spending. This raises US borrowing, raises interest rates above what they would have been otherwise, and strengthens the Dollar, which reduces exports at the same time sales of Treasury notes increases.
So Trump’s proposals generally raise the deficit, which will more than erase any help tariffs might give to US exporters…
US C C Jan 2008-Sept 2024
World output of C plus C has increased by 5854 kb/d from Dec 2007 to Sept 2024 and US C plus C output increased by 8094 kb/d over the same period. This may be why Ovi is concerned about the apparent slow down in US C plus C output (slightly down by 104 kb/d from Dec 2023 to September 2024). I share that concern.
World less US C plus C Jan 2008 to Sept 2024
Non-OPEC plus (aka DOC) minus US C C Jan 2008 to Sept 2024.
Note this chart and the previous 2 all have same horizontal scale and vertical scale is 10,000 kb/d from bottom to top for all 3.
There has not been much change in Non-OPEC plus less US C plus C over this period, average is about 22780 kb/d over this period. CTMA=centered twelve month average.
US C plus C increased by about 8000 kb/d from Jan 2008 to Sept 2024 accounting for most of the increase in World C plus C output from 2008 to 2024.
Chart for OPEC plus Jan 2008 to Sept 2024, same scale as previous 3 charts.
My Guess
2025 ave $84.00 WTI
2025 end $104.00 WTI
Dec 2025 US Crude 13,150,000 bopd
The STEO has just released its 2026 projection
As can be seen the December 2026 C plus C production is 18 kb/d higher than shown on the lower chart which was published at the top of this post. Crude is also little changed. Is this sending a signal to the world the rate of oil growth is slowing.
Note that October 2024 has been lowered by 518 kb/d. That is a major downward revision. Also note that December 2026 is a tad lower that November 2018
I´m really surprised that no one has commented this, perhaps Ron was right (he most probably were in my view) and the happenings from 2014 or so are obviously related.
(actually it started way before that but that´s when things got really interesting)
Hi Ovi,
I don’t understand this:
“ As can be seen the December 2026 C plus C production is 18 kb/d higher than shown on the lower chart which was published at the top of this post.”
The Jan STEO is the first one with projections for 2026. The charts are not directly comparable: one ends with 2025, the other with 2026. Just eyeballing it, it looks like EIA doesn’t see a lot of growth in 2026, but is hard to compare. In any case, making predictions for 2026 in Jan of 2025 is pretty much a shot in the dark…
Kdimitrov
I guess the point I was trying to make was that the EIA only added 18 kb/d to their December 2026 estimate over their previous STEO December 2025 estimate. The reason for that is best understood by comparing the two October 2024 estimates.
The more significant statement is: “Note that October 2024 has been lowered by 518 kb/d. That is a major downward revision.”
That big downward revision of 500 kb/d in the latest STEO estimate explains why December 2026 is only 18 kb/d higher than the what was shown in the previous post.
Hope this helps
The EIA is saying the US will hit peak production in Dec 2025
Ovi,
The EIA expects low prices in 2026 due to excess supply of oil, the forecast often changes.
Here are the prices expected in 2025 and 2026 for the Jan STEO.
Dennis, notice that the expected US oil production increase is not all that great. I would expect the increase in world demand to be far more significant than the increase in US oil production. But if there is a glut, they must expect an increase elsewhere. I just don’t see it. Do you have any idea where this glut in production is expected to come from?
Ron,
Other non-OPEC plus producers besides US such as Canada, Brazil, Guyana, and Argentina as well as OPEC plus as they unwind quotas. The EIA may well be wrong, both demand and supply of oil in the future are difficult to predict. I agree demand will grow more than US output and supply will come from nations mentioned above. By my estimate OPEC plus has 2.5 Mb/d of surplus capacity.
OPEC has always had 2 to 3 million barrels per day of spare capacity. Strange that they have never had to dip into their spare capacity. Was it real? How real is it today?
Ron,
OPEC plus claims about 5.9 Mb/d of spare capacityas of December 2024, I have adjusted my estimate to reflect the spare capacity of only KSA, Iraq, UAE, and Kuwait based on their average 12 month peak crude output in 2022 compared to their November 2024 level of output. The estimate is conservative in my view. See IEA’s spare capacity estimate for OPEC plus at link below for December 2024 Oil Market Report.
For Big 4 IEA estimates about 5 Mb/d of spare capacity in November 2024, my estimate is about half of that.
https://www.iea.org/reports/oil-market-report-december-2024
The EIA expects fewer wells will be completed in tight oil basins in 2026 as a result of average annual oil prices at about $62/bo for WTI. That is the reason for the declining US output in the forecast from Dec 2025 to Dec 2026.
Comparison of Jan 2024 STEO with Jan 2025 STEO for US C plus C. The average annual US C plus C output for 2024 increased by about 78 kb/d in the most recent forecast compared to 12 months ago and for 2025 the increase was about 100 kb/d from the Jan 2024 STEO to the Jan 2025 STEO. For now they are predicting a peak in late 2025, but this is likely to change.
Longer term chart for US C plus C using Jan 2025 STEO for November 2024 to December 2026 forecast.
Interesting piece at EIA
https://www.eia.gov/todayinenergy/detail.php?id=64264
Where is the growth coming from that outstrips demand growth if not from the USA?
Canada? Brazil? OPEC spare capacity?
Shallow sand,
The growth mostly comes from US (400 kb/d from 2024 to 2026), OPEC plus as they unwind their cuts, and Brazil, Canada, and Guyana. Also note that if we consider crude input to refineries Worldwide (data from Energy Institute’s Statistical Review of World Energy 2024) as the main factor determining demand for crude plus condensate we have 83068 kb/d in 2018 for crude input to the World’s refineries and in 2023 it was 82988 kb/d. Much of the increased demand for “liquids” is NGLs for petrochemical industry use. The long term trend for crude input to refineries from 1983 to 2018 was an average annual increase of 825 kb/d.
Oil prices have been low relative to 2010 to 2014 because supply has been running ahead of demand growth, keep in mind that OPEC has at least 2000 kb/d of spare capacity as of November 2024.
Yes, but they are calling for $62 WTI in 2026.
Just trying to figure out where that comes from, given US growth ceases.
Shallow sand,
The EIA expects the unwinding of OPEC plus cuts along with continued non-OPEC plus growth will be more than enough to create an oversupply of oil that will put downward pressure on oil prices in 2026. I believe their expectation is that OPEC’s patience may wear thin as it did in late 2014 and OPEC may again go for market share (though the EIA does not explicitly say this).
That seems like a WAG by EIA.
Odd prediction that US declines, demand increases, and prices significantly decrease.
Shallow sand,
They often make incorrect forecasts as do I. Difficult to predict markets 13 to 24 months in the future. The main thing they see is that demand grows less quickly than supply in the oil market, this seems roughly correct to me, so it is likely the opposite.
OPEC+ Annual Average crude only production, 2013 through 2014 in thousand barrels per day.
The data is CRUDE ONLY
The 22 countries that make up OPEC+ produces about 56% of the world’s oil production.
Click on chart to enlarge
Here is OPEC Big 4 (Saudi Arabia, UAE, Iraq, and Kuwait). Peak 12 month output was 21481 kb/d with centered 12 months at Oct/Nov 2022 and September 2024 C plus C output at 19489 kb/d. The difference from 12 month peak to recent output is about 2000 kb/d, so I may have overestimated spare capacity when I said 2500 kb/d (though for crude only based on last month’s MOMR I got 2477 kb/d spare capacity for the Big 4 OPEC producers based on data through Nov 2024, peak 12 month average crude in 2022 was 20849 kb/d and Nov 2024 estimate was 18372 kb/d).
Art Berman tweet
“Net zero is losing ground as the key energy narrative.
“Power is now the top growth sector, with natural gas emerging as a major winner.
“U.S. oil and gas firms are crushing their European net-zero-focused rivals.”
—
@ArjunNMurti
Of course I told you guys this over that last two years; those damn pesky laws of physic and common sense.
And while I am here allow me to take another victory lap. I mentioned not only watching midstream for clues on the direction of the industry but also said I was holding and buying ET, PAA, and EPD.
“Units of Energy Transfer (NYSE: ET) surged 42% in 2024, according to data provided by S&P Global Market Intelligence. That crushed the S&P 500, which delivered a robust 23% return last year. Add in its lucrative cash distributions (and assume reinvestment), and Energy Transfer’s total return was almost 54%, further widening its lead over the S&P 500 last year (25% total return). ”
https://finance.yahoo.com/news/why-energy-transfer-rocketed-42-131500073.html
PAA just increased it’s distribution from $1.27 to $1.52 and PAA and EPD ET are making cycle highs(post covid) as I write. OH yes its good to be the king!
So there is a lesson to be learned here. But most of you don’t have the capacity to learn. GOD SPEED AS WE MAGA
Learn what?
I wish I had put every dime I have invested in past 35 years in Phillips Petroleum and Exxon into Microsoft.
Thankfully I did buy Microsoft too. And some other stuff.
I still own a lot of stripper oil wells and if you are interested in buying them, maybe Dennis can get us together.
We produced more oil in 2024 than in 2020, 2021, 2022 or 2023 without drilling a well. Just converted a couple producers to injection and reworked four producers. High LOE, but low decline.
Shallow sand and Texas Tea,
Happy to connect you guys just email me at [email protected] if you are serious Shallow sand.
Texas Tea,
Check your email please.
Long term S&P 500 is likely a better investment. Keep on with the oil and gas investments and let us know, good luck with that.
Trump’s Pick for Energy Chief Vows to ‘Unleash’ US Expansion
(Bloomberg) — Donald Trump’s choice for energy secretary said the US should expand production of fossil fuels along with nuclear power, geothermal and other technologies to make the nation’s energy more reliable and affordable.
Testifying on his 60th birthday, Wright said during his opening remarks his first priority was to “unleash American energy at home and abroad to restore energy dominance,” a term that resonated throughout the first Trump administration.
As Liberty’s chief executive officer, Wright has been an unapologetic advocate for his industry, proclaiming the moral virtues of fossil fuels and even drank fracking fluid to refute opponents who questioned its safety.
The choice of Wright, who has no previous Washington experience, is indicative of the incoming president’s hard pivot toward fossil fuels after years of Biden administration policies that benefited renewable energy and sought to restrict global warming.
Wright has long been an outspoken defender of fossil fuels, saying they’re crucial for spreading prosperity and lifting people from poverty. He has called the threat posed by climate change exaggerated.
I read somewhere that drilling incentives will announced,
https://finance.yahoo.com/news/trump-pick-energy-secretary-vows-110000810.html
Ovi,
It will be interesting to see how the forecasts change at the EIA, February 2025 STEO compared to January 2025 STEO will be interesting.
US will be going backwards, advantage rest of World. Unfortunate, but maybe in 2 years there could be a bit of a check from the House of Representatives.
Dennis
I think that February might be OK. My concern is beyond that. Will the new crew try to fiddle the monthly production reports when production doesn’t show much growth. We will have to rely on data from NM, Texas and ND to cross check the numbers.
Anyone using the phrase “energy dominance” is talking through his ass. The phrase has no meaning.
So if Trump unleashes carbon, takes Greenland, and melts all the ice, where does the meltwater go? How high above sea level is Mar a Logo?
there is a funny video here about sea level,
https://youtube.com/shorts/4RbvIMfwNzU?si=0EzAIK4bEmjg-kBR
https://oilprice.com/Energy/Crude-Oil/Can-This-Huge-Oil-Discovery-Revive-The-Bakken-Oil-Boom.htm
author brags 250million BO and 600 wells as huge
Sheng Wu,
Some people are not aware that crude input to US refineries is 16 Mb/d, so 250 Mb is enough for about half a month of US consumption. I agree not huge.
US oil industry use the imperial petro unit system, and make lots of outsider and even quite a portion of US petro engineering making mistakes.
Imperial Actual unit
M, e.g.MCF Kilo
MM, e.g. MMCF Million
This mostly used for gas accounting.
but most oil counting use less double M, i.e. “MMBO”, to indicate “million Barrel of Oil”, and some use “MBO” as “million Barrel Oil”, especially the outsiders. I do see MMBO used in some oil companies report though, to indicate “million Barrel of Oil”
Sheng Wu,
I typically use Mb as in mega barrel. For thousands I use kb for kilobarrel.
For NG I use mcf for thousand cubic feet as this is used widely in the US. For million cu ft I use mmcf, sorry for lack of consistency. For billions of barrels I use Gb and billions of cubic feet of gas I use Bcf.
“Trump, for example, said during the campaign that he would cut electricity bills in half within 12 months of taking office.”
I hope you guys get a refund on your vote for that broken promise. I’m not eligible since I never bought the package.
Meanwhile the ramp up of nat gas export continues.
Might want to factor changes in demand from within China into your perspective –
“Sales of both road fuels [petrol and diesel] peaked in 2023, according to China National Petroleum Corp, and will now fall by 25-40 per cent over the next decade.”
courtesy of Alimbiquated from the other thread
https://www.ft.com/content/341f0aaa-7173-454c-89fd-103287625d38
in 2024, coal consumption increased 2%, 5% for China and India, reaching 5.31Billion and topping 1.3Billion tons respectively
And why are you replying to Hickory’s comment about oil. with a comment about coal?
FF consumption is not going to peak, and coal is the lower level, sooner or later, they will switch to gas and oil
“FF consumption is not going to peak”…
A statement you may wish to retract.
I don’t know if Chinas petrol and diesel consumption has already peaked, as the Chinese petroleum executive stated, but if not yet it will over this decade.
Peak Global CO2 emission day will be in the 2030’s (my guess is July 27th, 2034…,
or was it 2037?).
But after the peak moment there will be a huge fat tail of combustion that goes on for a long time.
so far, coal — the very start of FF since industrialization, stayed flat for a short 10 years in 1990’s, when China economy stagnated, and then doubled the level of 1980 peak by 2010 when China industrialized.
India coal consumption will follow the path of China and make another peak, and other 3rd world countries will follow suite.
“peak FF” “zero carbon” are like DEI and WOKE, peaked in 2023, and downfall started in the past year.
https://www.swiftcentre.org/publicforecasts/global-coal-consumption-will-defy-expectations
One interesting observation, for south America’s failed half-way industrialization — probably they don’t have the coal reserve that China, EU and US had.
China imports 5 times the amount of coal now as it did back in 2015. Only way they continue using the same amount or more coal is through increasing imports.
US under Trump wants to bring industry and manufacturings back home.
If or when natural gas supplies tighten. There is still lots of coal in the US that will be used. Natural gas is just currently cheaper.
We will switch back to coal if it comes to a choice between having energy or doing without.
HHH,
China’s domestic coal production cost is already much higher than import.
The current coal mines in the major coal provinces have depth below 600meters already, the new coal provinces in Xinjiang is too far away and transportation to the eastern southertn coastal province adds much higher cost.
On the other hand, India coal mines depths only reach 50meters, has a long way to go.
China took ~25 years to more than double the coal use from
ND up about 43,000 bopd in NOV, versus OCT. Expected recovery from OCT wildfires.
https://www.dmr.nd.gov/dmr/oilgas/directorscut
The Rig Report for the Week Ending Jan 17
– US Hz oil rigs were down 2 to 436. They are down 22 rigs from April 19 and are up 9 relative to their recent lowest count of 427 on July 24th. The rig count has remained in a very tight range between 427 and 442 since July.
– In New Mexico and Texas the Permian rigs were unchanged at 94 and 193 respectively
– In New Mexico, Lea and Eddy were unchanged at 46 and 48 respectively
– In Texas, Midland dropped 1 to 26 while Martin was unchanged at 27 rigs
– Eagle Ford added 1 to 39
– NG Hz rigs dropped 4 to 79.
Frac Spread Report for the Week Ending Jan 17
Spreads continue to drop
The frac spread count dropped by 7 to 188. It is also down 47 from one year ago and down by 53 spreads since October 11.
We are now 7 weeks from March 7, 2025 and are down 84 frac spreads from March 8, 2024. It will be interesting to see the frac speed count for March 7, 2025 for comparison. Last year from the lows of January the frac spreads rebounded by 38 into March.
I know there are seasonable effects about the fracs, and also productivity improvements, but a longer term presentation of the fracs working from, say 2010 would certainly help getting the big picture.
Kind of like my favourite neighbor country Norways oil production, from 1990 to now.
I just wish Mazamascience would update their data, it was most interesting.
Laplander
Attached is a longer term view of the frac spreads. Peak frac spreads occurred on June 22, 2018 at 503. Looking at the October 11, 2024 spreads of 241 gives an idea of progress made in drilling and spread technology. On that same date in 2018 there were 862 oil rigs operating as opposed 434 on October 11, 2024, again close to 1/2.
The US is at peak production with less than half of the spreads in June 2018 and close 1/2 rigs.
North Dakota November Oil production
Oil operators in North Dakota, the third-largest oil producing U.S. state, are operating fewer rigs than last month, the state’s Industrial Commission said on Friday.
The rig count has dropped to 31 from 37 in December, said Nathan Anderson, director of the North Dakota Department Of Mineral Resources. Active frac crews remain at 14, he added.
North Dakota oil production rose 43,000 barrels per day (bpd) in November compared with October, to 1.221 million bpd.
Note that production is down by 69 kb/d from September 2023.
https://boereport.com/2025/01/17/north-dakota-rig-count-slips-to-31-from-37-in-december-regulator-says/
Crude oil to chemical plants are being built, which according a report will account for 50% of oil demand increase in the next couple of decades.
https://blog.agchemigroup.eu/the-birth-and-growth-of-crude-to-chemicals-technologies/
These crude oil to chemical plants are vast and convert oil into a variety of high value chemicals, the plants can vary the chemicals produced depending on demand.
https://cen.acs.org/business/petrochemicals/China-aromatics-building-boom-rattles-the-petrochemical-industry/102/i8
Gas to chemical plants are already closing down in the face of this new competition
So you think there will be excess oil production capacity once the shift to electrification of the global light transport sector is nearly completed over the next 10-20 years?
I suppose that is possible.
Hickory
It is obvious that Saudi Arabia and other oil producing countries think there will be. If there isn’t then the price of oil will go up and they win either way.
It is impossible to say if global oil production will decline faster than Road fuel demand.
https://www.youtube.com/watch?v=mYnYZF1fnz0
10 minutes
Can Venezuela help out with a Middle East oil crisis?
Europe to seek America’s permission to invade Venezuela?
US has effective control on about 22~30M(illion) BOPD excess/disposal capacity globally.
US domestic(immediate on and off in 2~3 months): ~14M
Venezuela:2~5M
Iran: 2~3M
Russia: 2~3M
Canada: 2~3M
Question:
It seems to me that temporary low oil prices can reduce ultimate recovered resources because stripper wells will be plugged and abandoned that would otherwise continue to produce. Is there some way of estimating how many stripper wells were plugged in the U.S. during Covid relative to the average number of wells plugged per year? If so, has someone done it?
So, guys, peak oil is turning out to be…a damp squib.
It doesn’t mean it will be forever, but it probably will be for the rest of our lifetimes (most readers and commentators are technical minded, middle aged men).
It’s all so boring.
SGP99
Ovi himself has said looking at these graphs month after month is like watching paint dry. There are lots of interesting developments in the oil industry. Trouble is Dennis is not an oil man and all he can do is graphs.
“Trouble is Dennis is not an oil man”
I’ll put my faith in a educated, open minded, well rounded person willing to learn than a know it all.
In the pursuit of knowledge, there is a paradox that arises: the more you learn, the more you realize how much you don’t know. This paradox is a humbling realization that despite acquiring vast amounts of knowledge, there will always be more to discover and understand.
There are lots of interesting developments in the oil industry.
You should feel free to provide information about those – I’m sure everyone would be interested.
Oil head idiots, what else are you really looking for at POB.com? Relationship advice? How to cook yourself in your gas grill? Maybe a how to guide for talking to real live people!?!
Kengeo
You are the worst offender with your ridiculous graphs based on zero knowledge.
There was a chap on The Oil Drum who used to make predictions like yours, Saudi Arabia according to him should be producing 5 million barrels per day now and falling fast. Sound familiar?
There were some great posts on The Oil Drum, topics on oil, nuclear, coal and all subjects impacted by energy.
SGP99, Loadsofoil, Kangeo
My main interest in continuing to post these production updates has now shifted its focus to US production and trying to assess how close it is to peak production. My best guess now is 2025. OPEC and the IEA still see US production growth. Imagine the shock when these organizations realize US production has peaked. Imagine the glee within OPEC when it realizes it has regained full control of the oil market. Will there a World/US reaction?
Loadsofoil and a few others. I wish you could better appreciate the work that Dennis does in keeping this site going and especially his models. Not many people are prepared to create models and make predictions five to ten years out. We all know, Dennis included, that the odds of being right are close to zero. However, and more importantly, the models indicate that no matter how you slice it, they show that it will be difficult to beat November 2018 and that the next production peak is less than 10 years from now.
Enjoy our posts and let the discussion and opinions continue.
Lay reader here: thank you, and Dennis, et al. for your work
I’ve learned:
PO cannot be predicted. PO cannot be called when it happens. PO cannot even be called after it happens. There have been many declines followed by recoveries. As to the “rearview mirror” theory, it takes an appallingly long time to be sure of PO. Here we are, creeping closer to ten years post-2018, and we still fret about it.
Therefore, no matter when PO occurs, it will always be too late.
[A retired geology professor I know claimed peak would occur in 2011, saying he would be ‘greatly surprised’ if production growth continued after 2013. I’m sure he is indeed greatly surprised (he’s in his eighties now). But even though he was wrong–like everybody else–if 2018 turns out to be the peak, he was only off by 5 years. Not a bad call for a dreadfully intractable problem.
He was the one who told me, as far back as 2007, “It’s too late.”]
It’s too late.
Too late for what?
The longer we have to prepare, the easier the transition away from FF.
Completely agree and appreciate what you guys put on the table Ovi.
Dennis, Ovi
I had always assumed the peak plateau would be boring, thanks for keeping it interesting.
I don’t consider myself an oilman, even though I have owned an interest in oil wells for quite awhile. I don’t work in the field. We have pumpers and hire all kinds of contractors. I say we, because I own my interest through a family owned company, other family own shares in the company with me.
I don’t have any issues with POB. I do worry Ovi and Dennis no longer have access to the best information as Enno Peters excellent work was a major source used by POB, and that is no longer available.
Everything in the USA seems to be infected with political divisiveness and some of the commenters here reflect that. The political stuff seems to be at the root of most conflict here.
As long as Dennis and Ovi make fact based posts, I don’t see what the big deal is. I’ve been reading this for over 10 years, and feel the posts have been data driven. Those who make projections state are just using the data they have available. They also state they won’t be surprised if the predictions are incorrect.
I agree politics plays a part in oil and gas production. So it is no surprise that politics flares up here in the comments.
Thanks all for your comments. Loadsof oil is correct that I am not an oil man, those who are can educate me as Mike Shellman used to do, I have never claimed to be an expert, I do the best I can with information available.
Dennis, that is a kind thing to say, in spite of our differences over the years.
I would still be inclined to want to help make people understand the oil and gas business but for the political dung heap that you have allowed on your site. It has become rather preverse in my mind. No one has the right to call anybody names, or compare them to the most evil people in the world, or wish them ill will, as in being killed by assassination, for political reasons; you truly have some very angry, troubled people in your community.
I am sorry for that because otherwise I believe you have a genuine interest in learning, as I do from others. I have leaned from you, also. I would have otherwise thought that would be the purpose in a public forum about peak oil, but apparently not.
https://www.oilystuff.com/forumstuff/forum-stuff/everything-for-family-always
You know, its not the end of the world. Everybody will be fine, they just need to find something more productive to do with their lives than be afraid of Trump, or the Koch Brothers, and live on the internet. Trump is just another president in a long history of presidents that all American’s somehow survive and are able to somehow care for their families. Those of us that work for a living, anyway.
Sinceremente, de S. Texas,
New posts are up
https://peakoilbarrel.com/short-term-energy-outlook-january-2025/
and
https://peakoilbarrel.com/open-thread-non-petroleum-jan-19-2025/