By Ovi
All of the Crude plus Condensate (C + C) production data for the US state charts comes from the EIAʼs Petroleum Supply monthly PSM which provides updated production information up to September 2025.
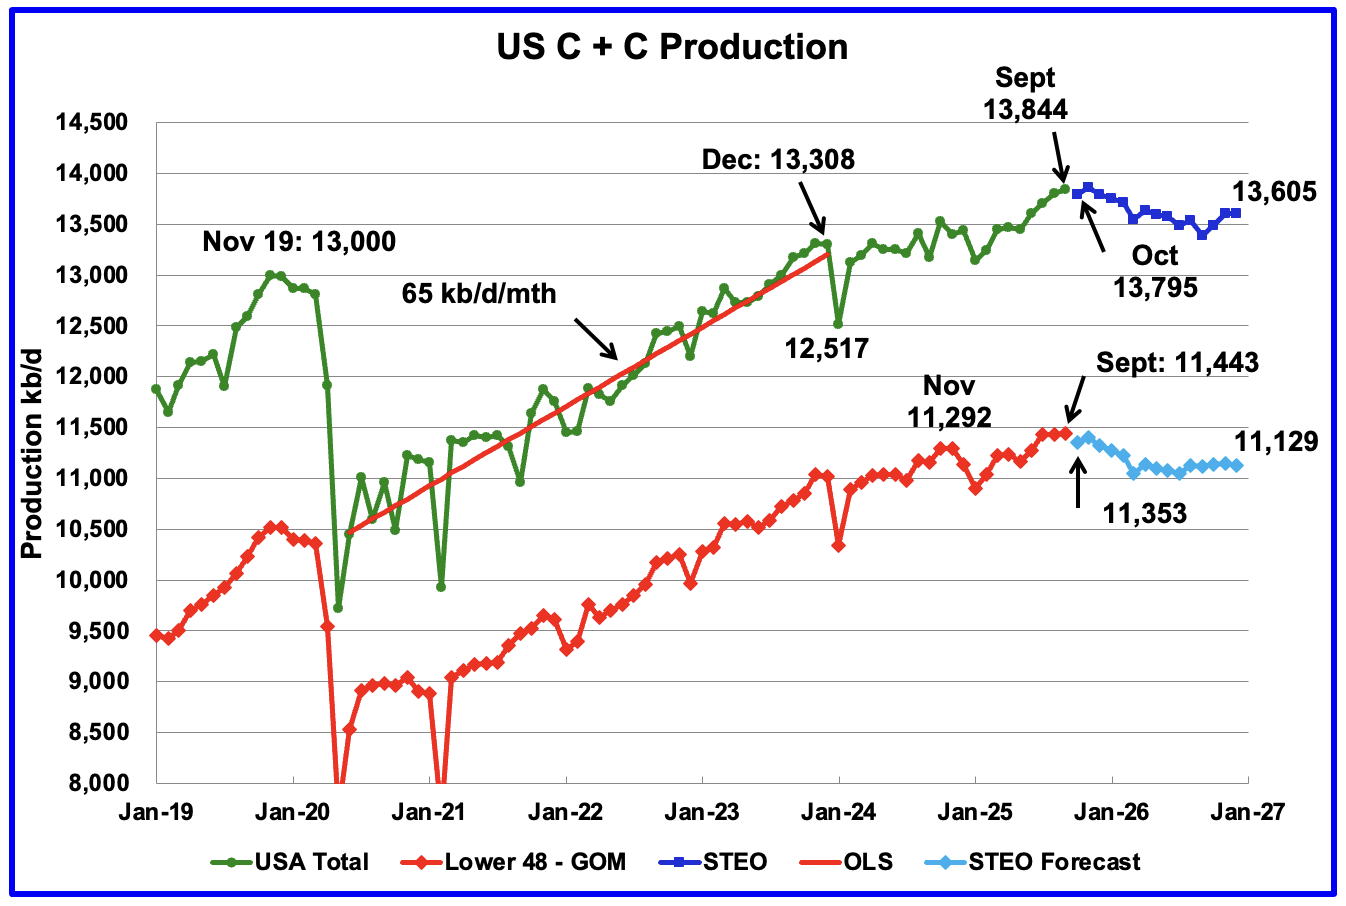
U.S. September oil production increased by 44 kb/d to 13,844 kb/d, another new record high. The largest increases came from Alaska and New Mexico. The November STEO forecast for October production is a drop to 13,795 kb/d. It should be noted that the November STEO under estimated September production by 59 kb/d.
The dark blue graph, taken from the November 2025 STEO, is the U.S. oil production forecast from October 2025 to December 2026. Output for December 2026 is expected to drop to 13,605 kb/d. From September 2025 to December 2026 U.S. oil production is expected to drop by 239 kb/d.
Note the almost flat production in the Onshore L48 for July, August and September, 11,437 kb/d, 11,432 kb/d and 11,443 kb/d respectively, red graph. The difference between the 44 kb/d increase in the overall US production vs the almost flat production in the Onshore L48 is the 31 kb/d increase from Alaska.
The light blue graph is the STEO’s forecast for the Onshore L48 output to December 2026. From September 2025 to December 2026 production is expected to decrease by 314 kb/d to 11,129 kb/d.
U.S. Oil Production Ranked by State
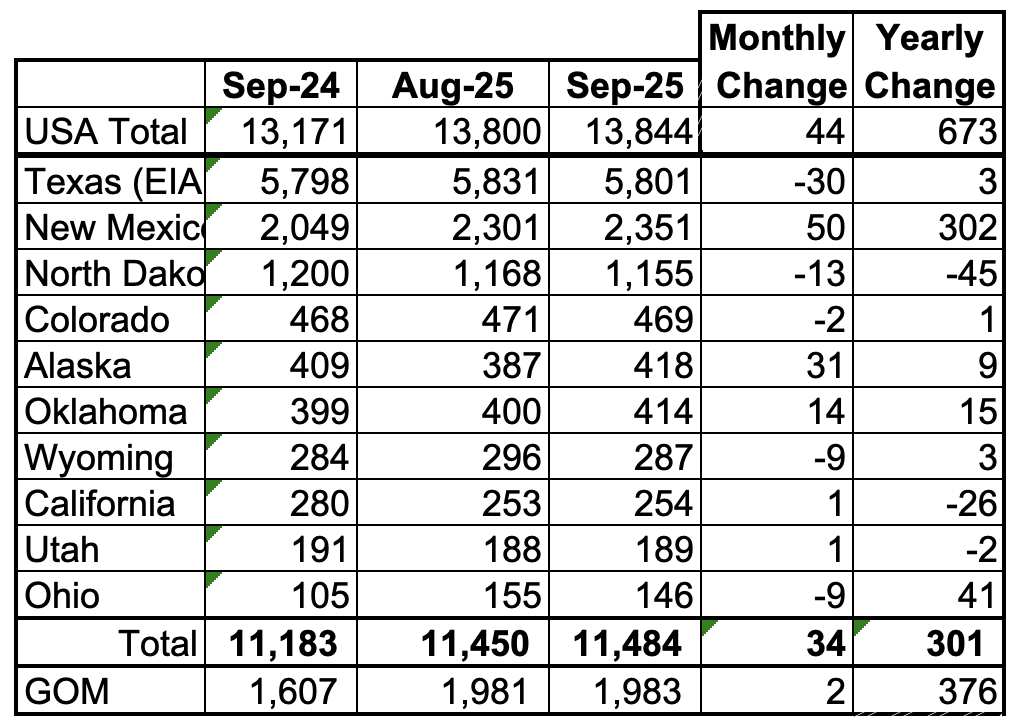
Listed above are the 10 US states with the largest oil production along with the Gulf of Mexico.
These 10 states accounted for 83% of all U.S. oil production out of a total production of 13,844 kb/d in September 2025. On a MoM basis, September oil production in these 10 states rose by 34 kb/d. On a YoY basis, US production increased by 673 kb/d with the biggest contributors being New Mexico and the GOM.
State Oil Production Charts
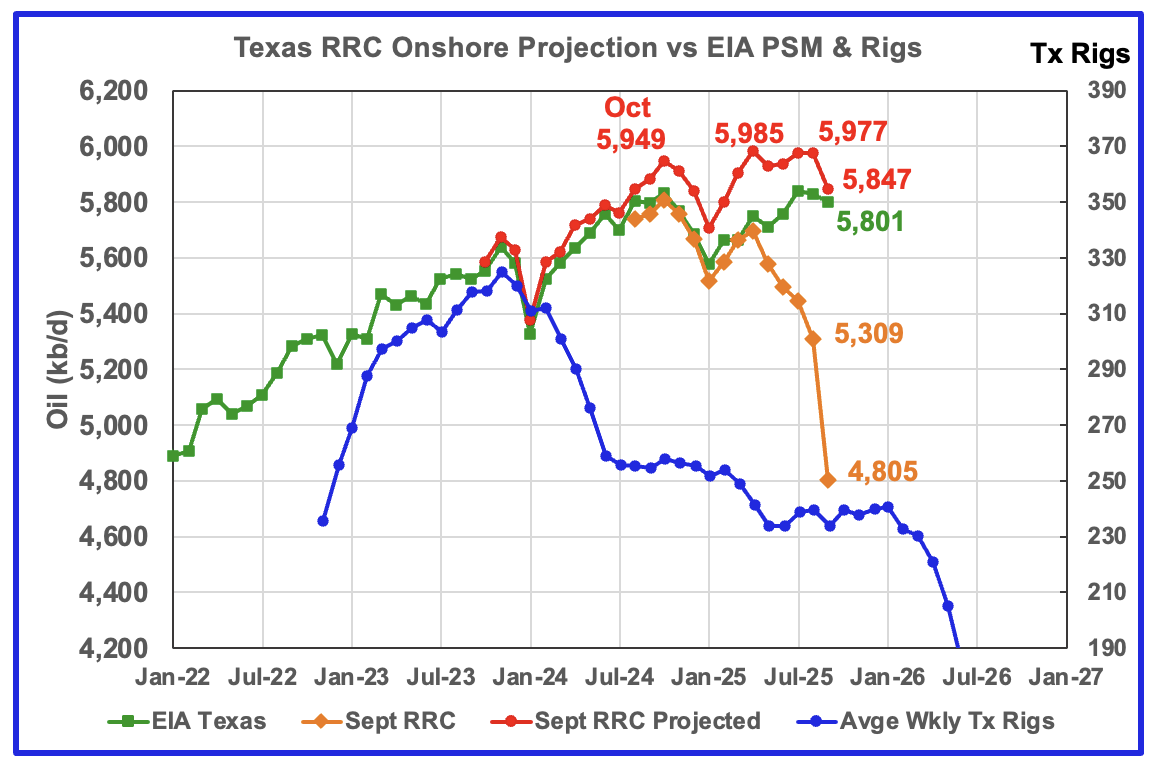
September’s production decreased by 30 kb/d to 5,801 kb/d according to the EIA.
Texas production has rebounded since the weather related January 2025 drop. The EIA’s September production is essentially the same as September 2024, 5801 kb/d vs 5,798 kb/d. The point to note here is both the production projection and the EIA’s production are going in the same direction from January 2024 to August 2025 and both are indicating that Texas is entering a plateau phase.
The September projection deviates from the EIA’s because MoM corrections start in July 2023 which result in an overly optimistic projection. Texas’ RRC initial September production is lower than normal which accounts for the large September production drop. Texas’ RRC initial production for September dropped by 501 kb/d to 4,805. A more typical month end drop is 350 kb/d. It is not clear if the large drop is due to a Texas RRC processing delay or a real production drop.
The red graph is a production projection using the August and September Texas RRC data. The projection trend follows the EIA’s production up to August but not for September due to the September initially large 501 kb/d production drop. The four peaks in the projected graph starting in October 2024 indicates that Texas production is close to peaking.
The blue graph shows the average number of weekly rigs reported for each month shifted forward by 10 months. So the 276 rigs operating in July 2023 have been shifted forward to May 2024. From February 2024 to July 2024, the rig count dropped from 312 in time shifted February 2024 to 256 in July 2024. That drop of 56 rigs had no impact on production up to October 2024 but November was the first month when the impact of the rig drop on oil production started to show up along with fewer completions.
The rising production after January 2025 is difficult to explain considering the continuing drop in the rig count.
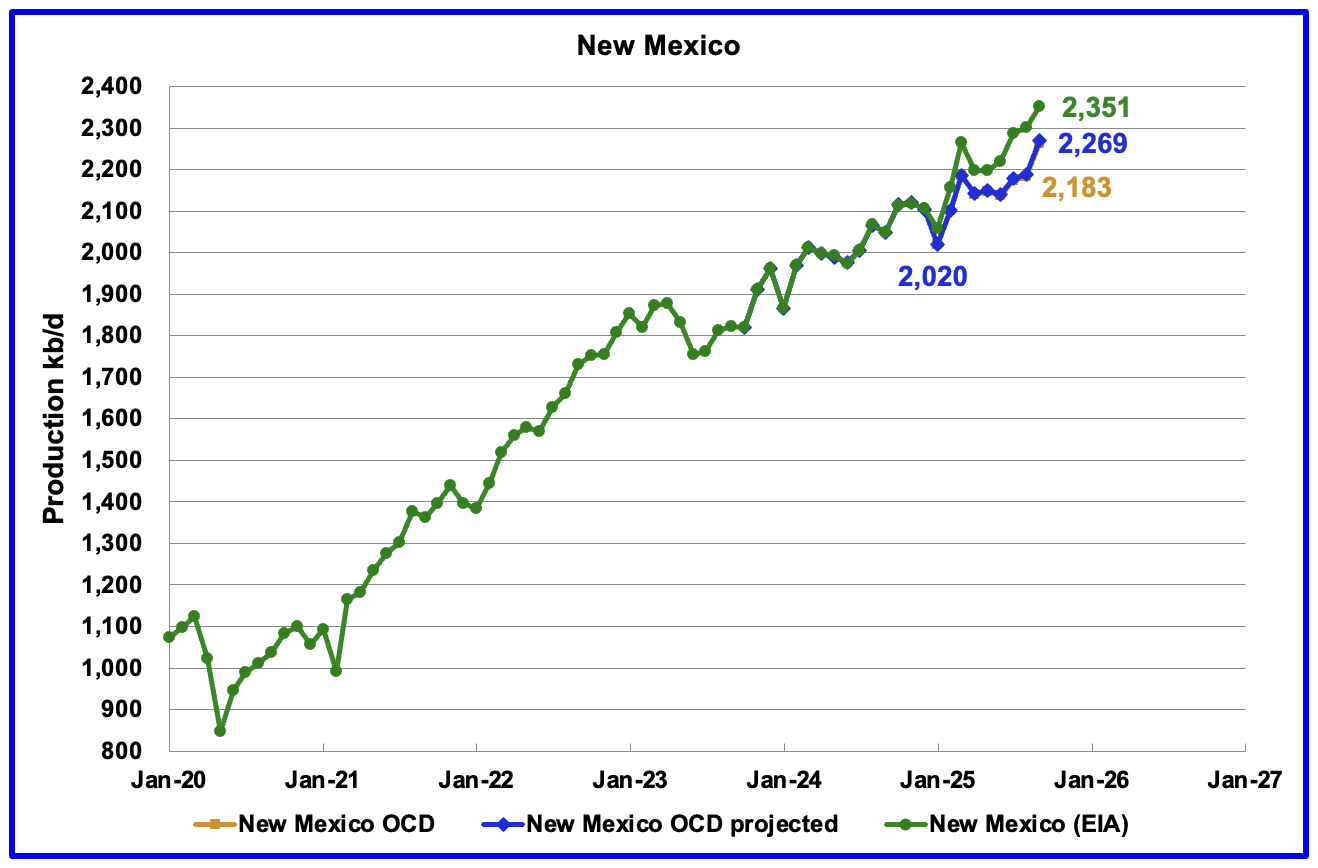
According to the EIA, New Mexico’s September production rose by 50 kb/d to 2,351 kb/d, a new high. YoY production rose by 302 kb/d, the biggest contributor to overall rising US production.
The blue graph is the projected output for September. The September production projection increased by 80 kb/d to 2,269 kb/d, of which 78 kb/d is from the OCD’s preliminary production.
Eddy county accounts for 60 kb/d of the projected increase of 80 kb/d and is discussed further in the Permian section below.
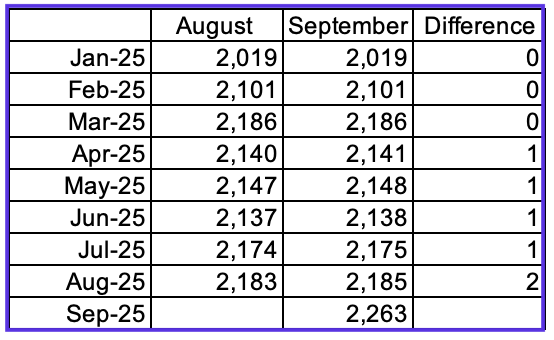
This table compares the NM OCD production reports for August and September. Note there are no production revisions for January to March and only a 1 kb/d revision for the months April to July. Since the September revisions to the August data are small to nothing, this implies that the production information from the NM OCD is more up to date than that provided by the EIA.
In 2024, from May to September, the EIA over estimated NM production by an average of 30 kb/d, with a high of 40 kb/d and a low of 21 kb/d. In August 2025, the EIA revised its 2024 production numbers to be consistent those reported by the NM OCD. For August 2025, the EIA’s reported production is 2,301 kb/d. The NM OCD is reporting 2,185 kb/d, lower by 116 kb/d.
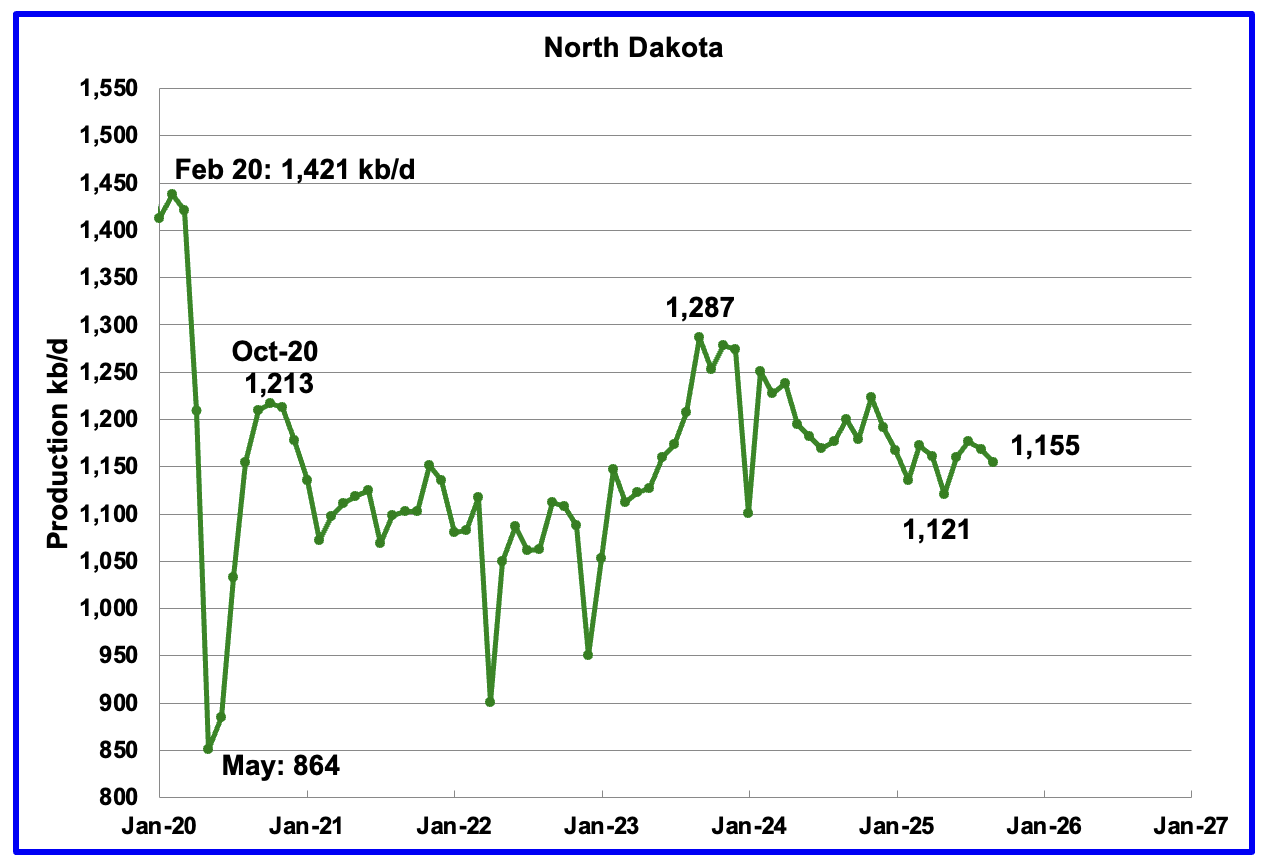
September’s output dropped by 13 kb/d to 1,155 kb/d. Production is down 132 kb/d from the post pandemic peak of 1,287 kb/d.
The North Dakota Department of Mineral resources reported September production was down 5 kb/d to 1,166 kb/d, which is close to the EIA’s estimate.
According to this Article, while oil production is down, NG is rising.
BISMARCK – North Dakota reached an all-time high in daily natural gas production in September, according to Nathan Anderson, director of the North Dakota Department of Mineral Resources.
Anderson said Friday, in the monthly oil and gas production report, the state produced 3.58 billion cubic feet (BCF) of natural gas a day.This was an increase of 1.27% from August to September.
Oil production was down slightly in September, with 1.165 barrels of oil a day produced or a 0.43% decrease from August to September. However, it was 1.38% above the revenue forecast.
Currently, 28 rigs are actively working in North Dakota.
North Dakota’s market oil price averaged $56.69 a barrel in September, which was 3.9% below the revenue forecast. Currently, West Texas Intermediate oil is selling for $59 a barrel.
Ten frac crews are working in the N.D. oil field, according to the report.
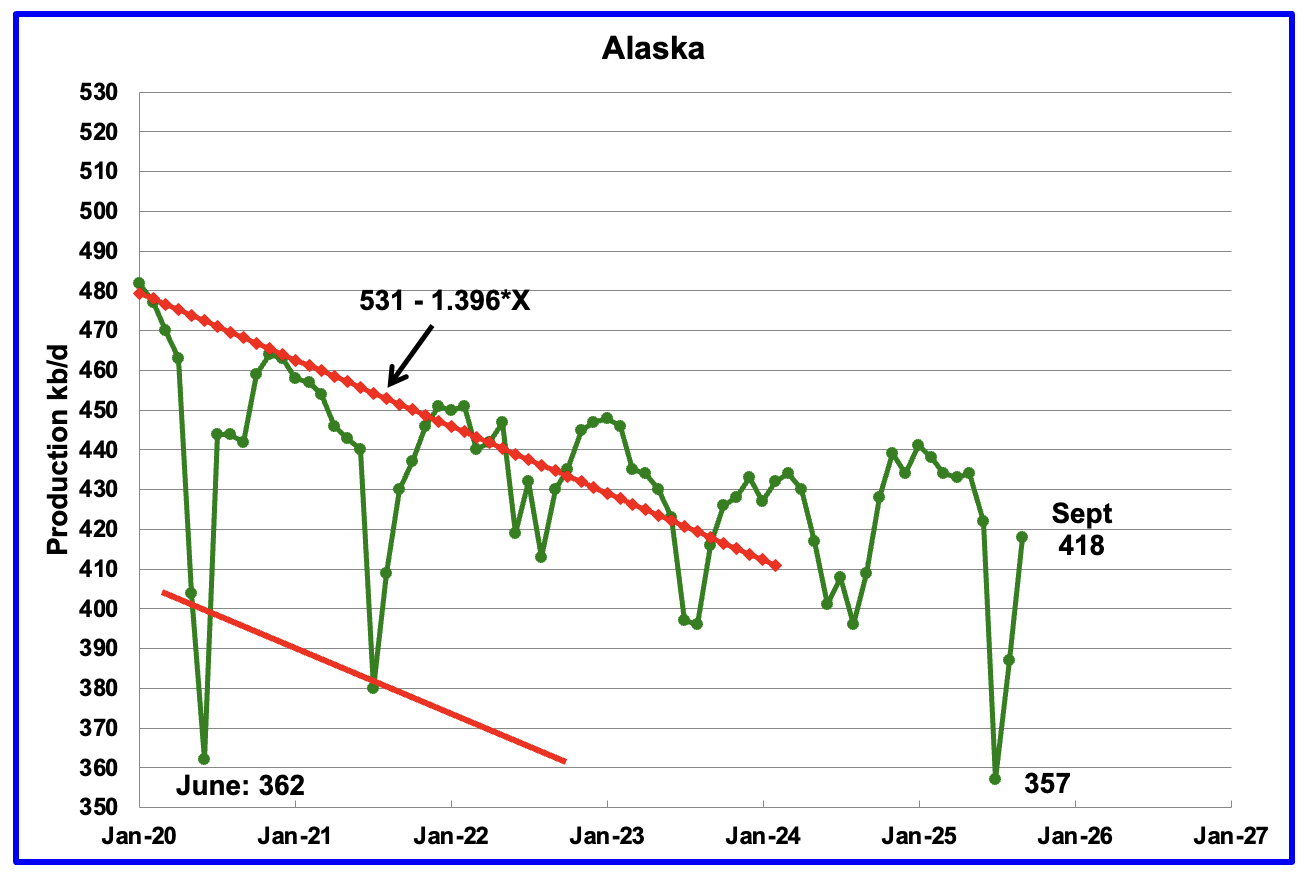
Alaskaʼs September output rose by 31 kb/d to 418 kb/d while YoY production increased by 9 kb/d. The EIA’s weekly September reports indicated that September production would rise and would average close to 416 kb/d. Production from the weekly reports for October and November continues to be in the 430 kb/d to 435 kb/d range, showing little growth beyond September.
Alaska has recently brought new fields online to consistently have flat YoY and monthly production gains which have broken away from the earlier dropping production red trend lines.
In early 2026 the Alaska Picca field is expected to come online. At its peak, Pikka could produce up to 80 Mb/d from 45 wells. The production expected from these projects may be enough to flip Alaska oil production into a steady growth period. Also waiting in the wings is the Willow project which is projecting first oil in 2029 with a peak rate of 180 kb/d.
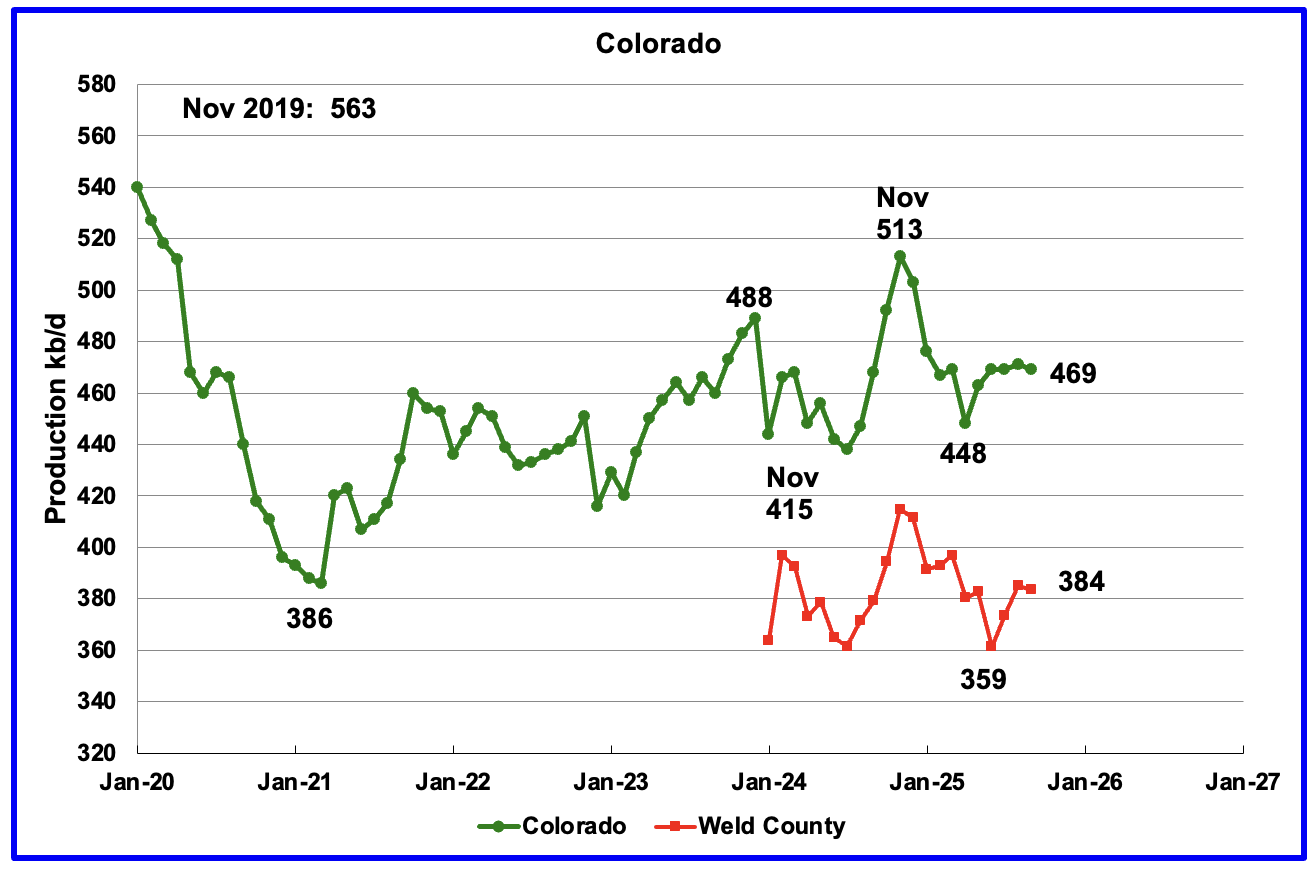
Coloradoʼs September oil production dropped by 2 kb/d to 469 kb/d.
The biggest oil producing county in Colorado is Weld County and its production has been added to the chart. The two graphs have been almost parallel since January 2024 but diverged over the last two months. Weld’s production dropped by 1 kb/d in September to 384 kb/d.
Colorado began 2025 with 6 rigs in January and February and peaked at 11 in October. At the end of November 9 rigs were operational..
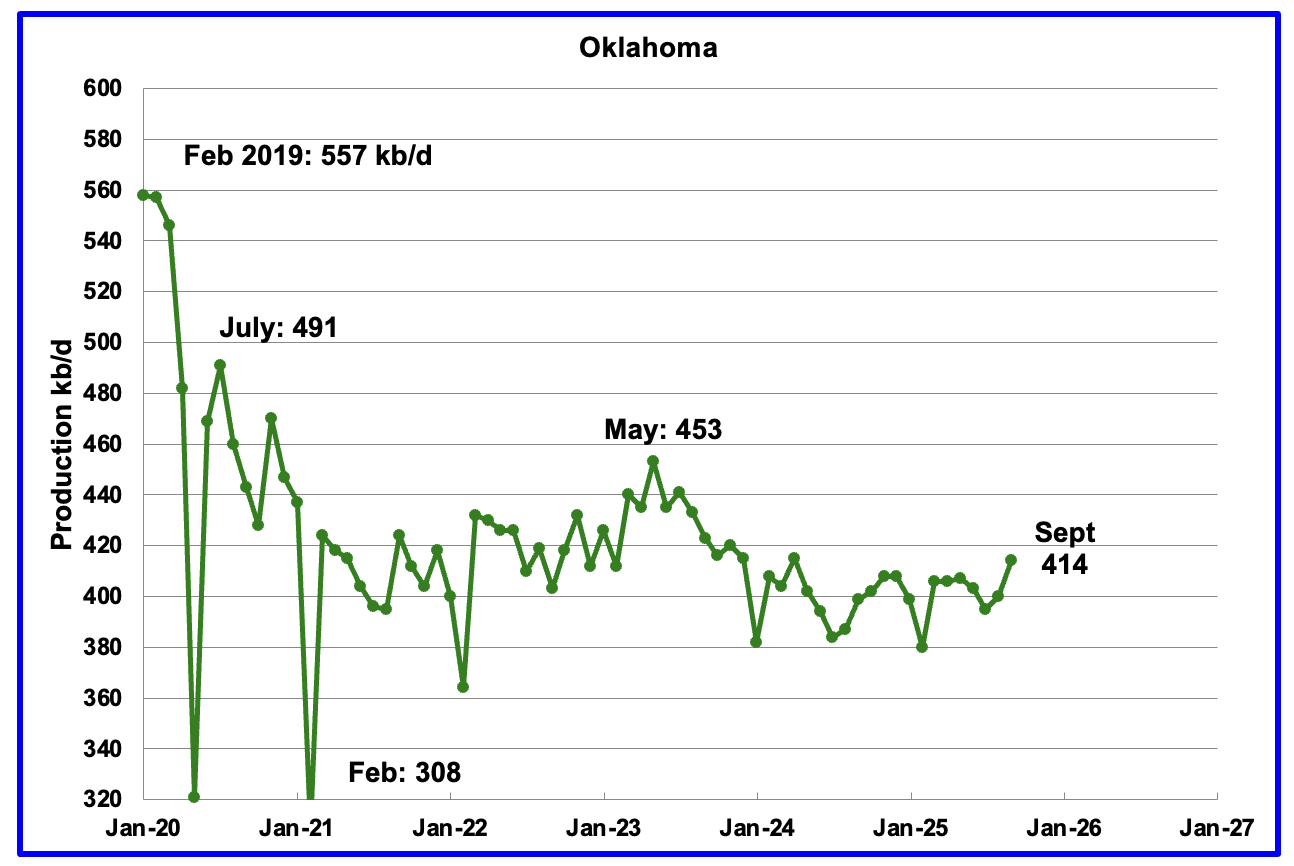
Oklahoma’s output in September rose by 14 kb/d to 414 kb/d. Production remains below the post pandemic July 2020 high of 491 kb/d and is down by 39 kb/d since May 2023. Output entered a slow declining phase in June 2023 and now appears to be range bound around 400 kb/d ± 20 kb/d.
Oklahoma had 51 operational rigs May which slowly dropped to 39 rigs in November. The impact of the dropping rig count after May should begin to show up in a few months, allowing for a 6 month time shift between rig count and oil production.
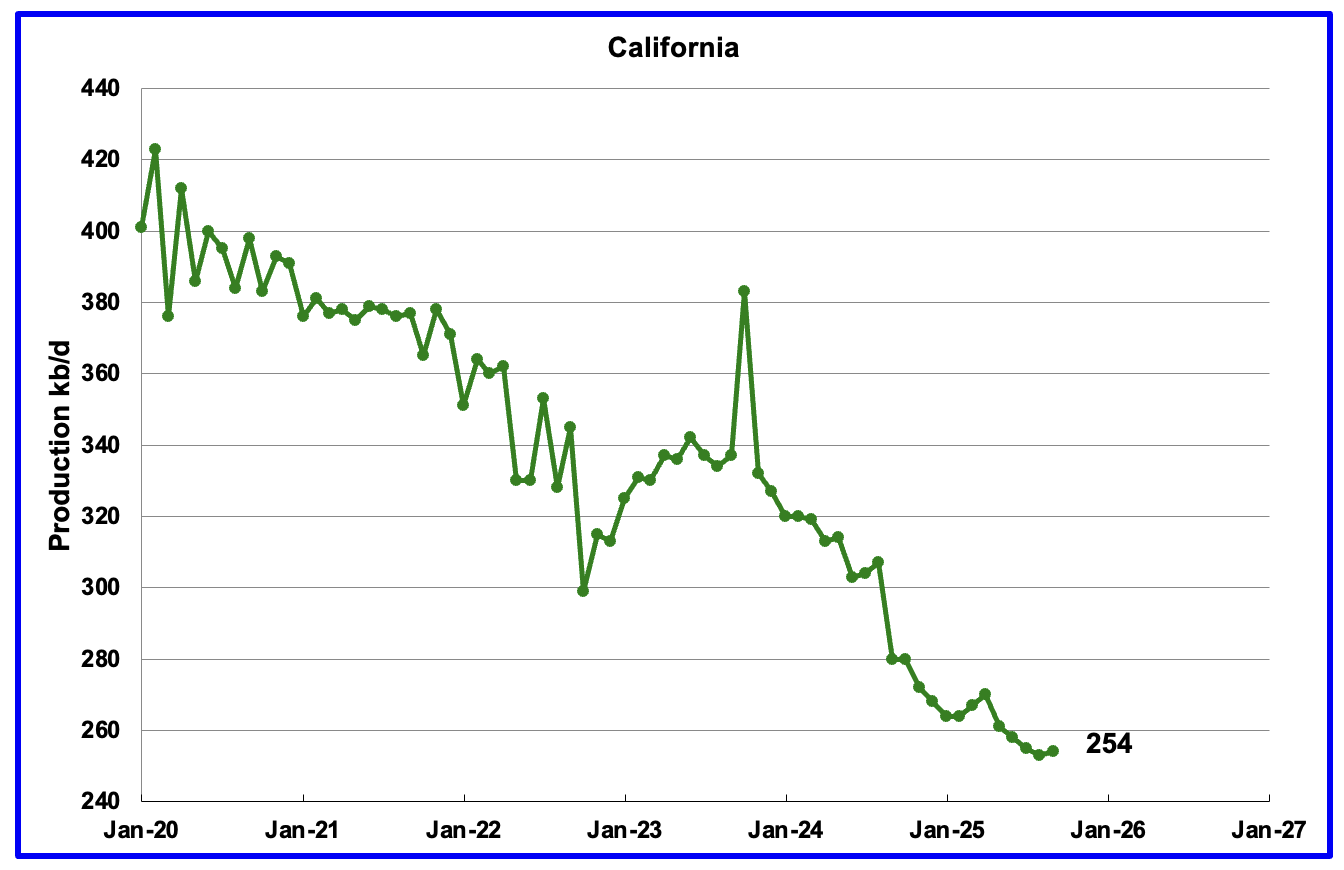
California’s overall declining production trend continues but September had a minimal rise. September’s production rose by 1 kb/d to 254 kb/d. YoY production dropped by 26 kb/d.
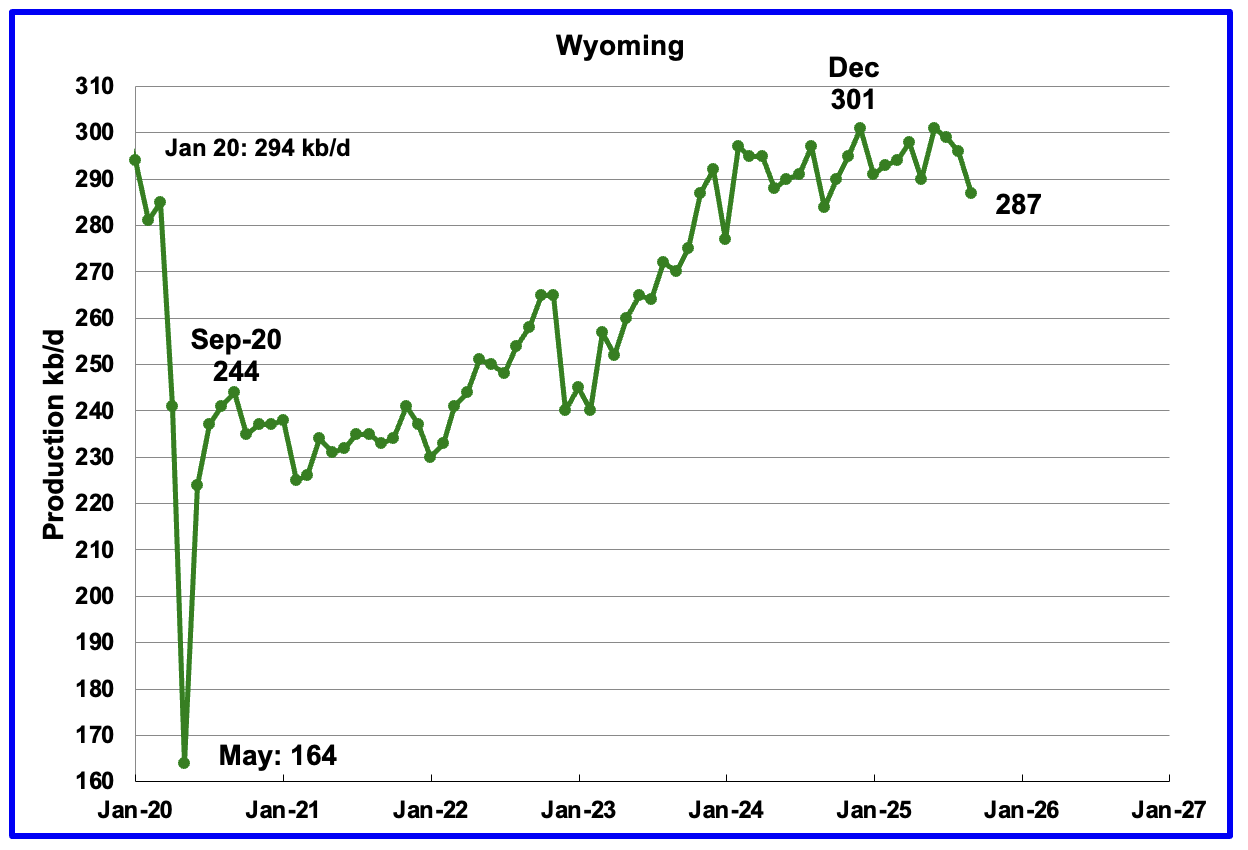
Wyoming’s oil production reached a post pandemic high in December 2024 and appears to have entered a plateau phase around 295 kb/d. September’s production dropped by 9 kb/d to 287 kb/d.
At the beginning of 2025 Wyoming had 14 operational rigs and rose to 16 in March and April. At the end of November 10 rigs were operational.
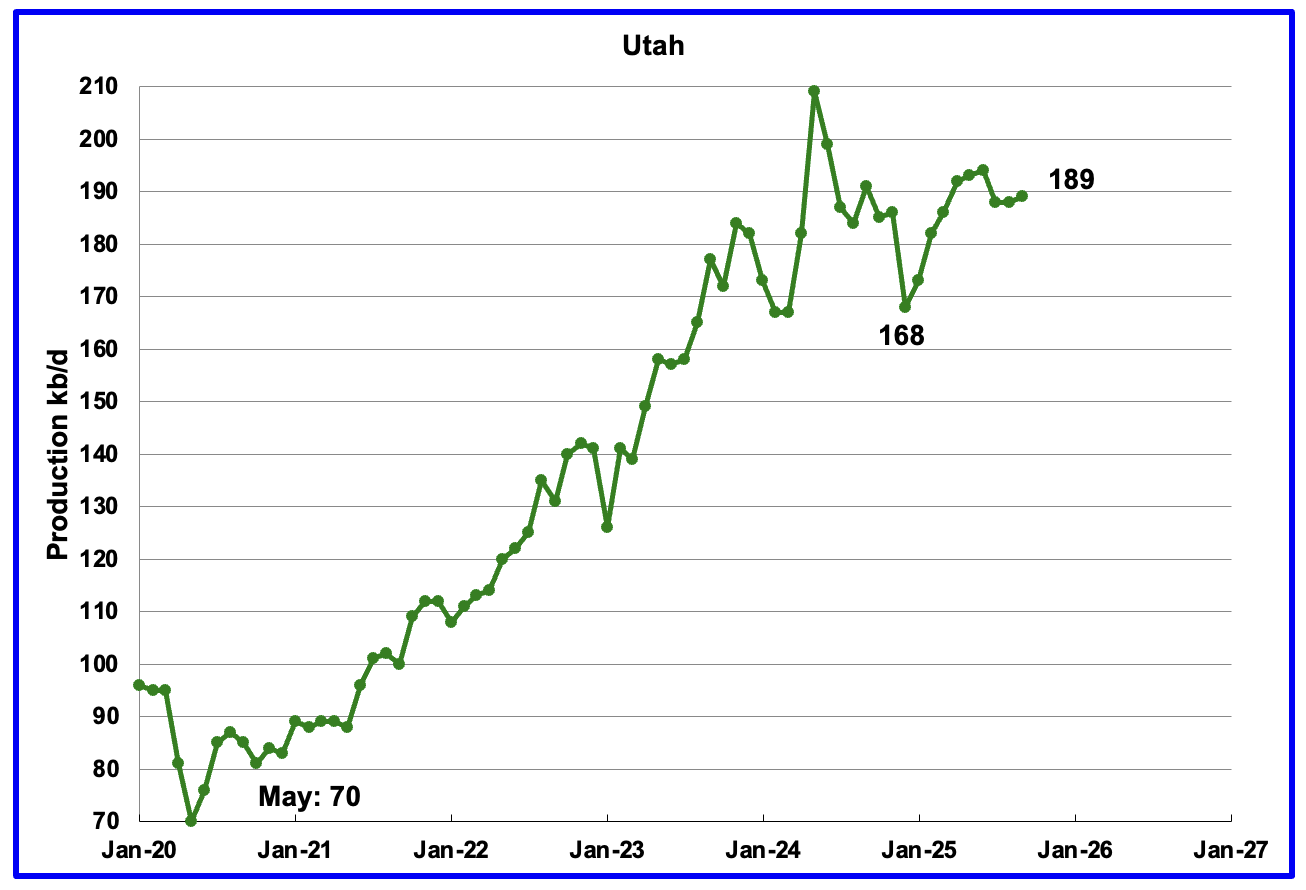
September’s production rose by 1 kb/d to 189 kb/d. Utah had 8 rigs operating from October 2024 through May 2025 but dropped to 6 in early June but returned to 9 in October and November.
The Uinta Basin Rail line that was approved in 2021 was given final approval by the Supreme Court.
The country’s highest court said Thursday the Surface Transportation Board’s 2021 Approval of the controversial Uinta Basin Railway — following several years of review and a 3,600-page environmental impact statement under the National Environmental Policy Act, or NEPA — adequately analyzed the impact of the railroad and the agency did not need to study potential impacts from increased drilling or refining of Uinta Basin crude.
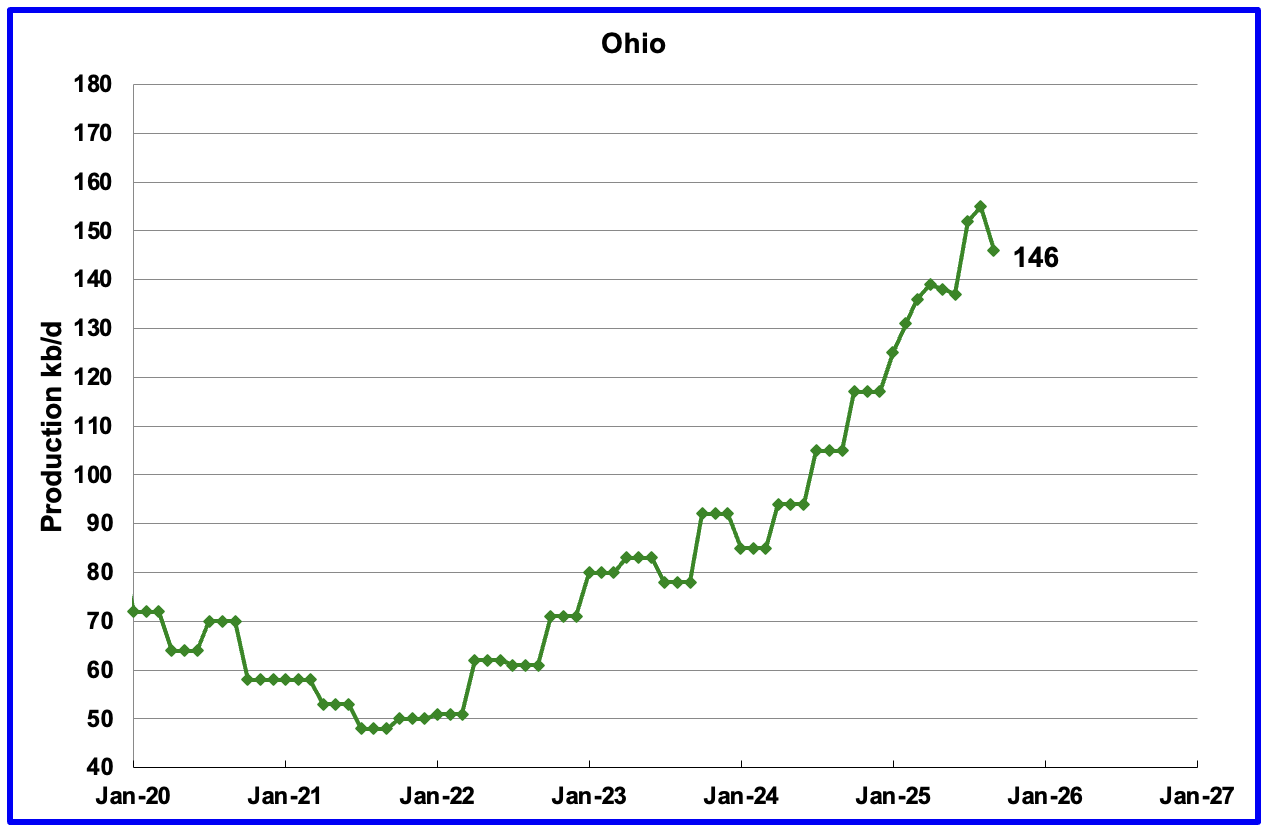
Ohio’s September oil production decreased by 9 kb/d to 146 kb/d. Ohio started the year with 6 NG rigs, In late November Ohio had 11 NG rigs and 1 oil rig operating.
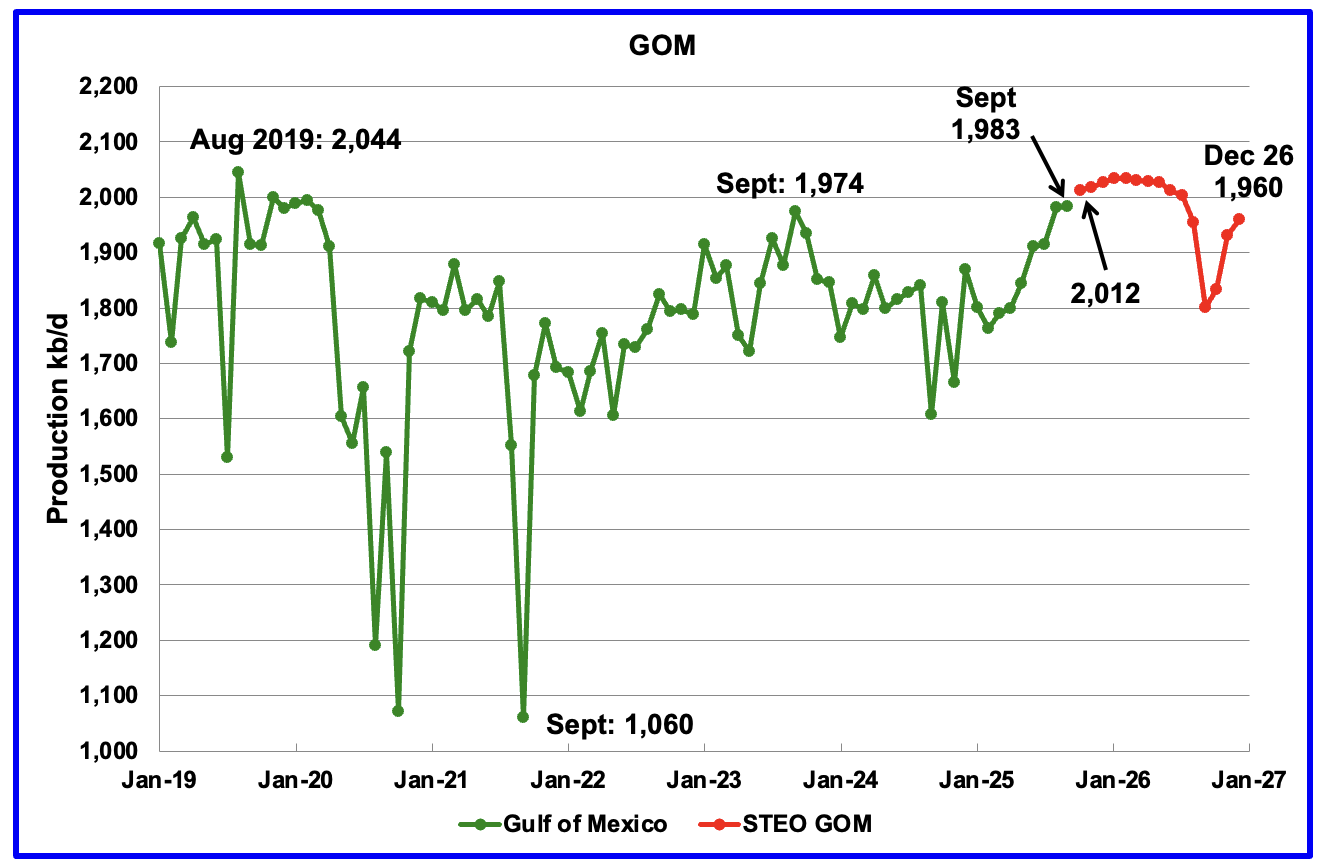
GOM production rose by 2 kb/d in September to 1,983 kb/d. October’s production is projected to increase by further 29 kb/d to 2,012 kb/d.
The November 2025 STEO GOM projection has been added to this chart. It projects production in December 2026 will be 23 kb/d lower than September 2025 at 1,960 kb/d.
A Different Perspective on US Oil Production
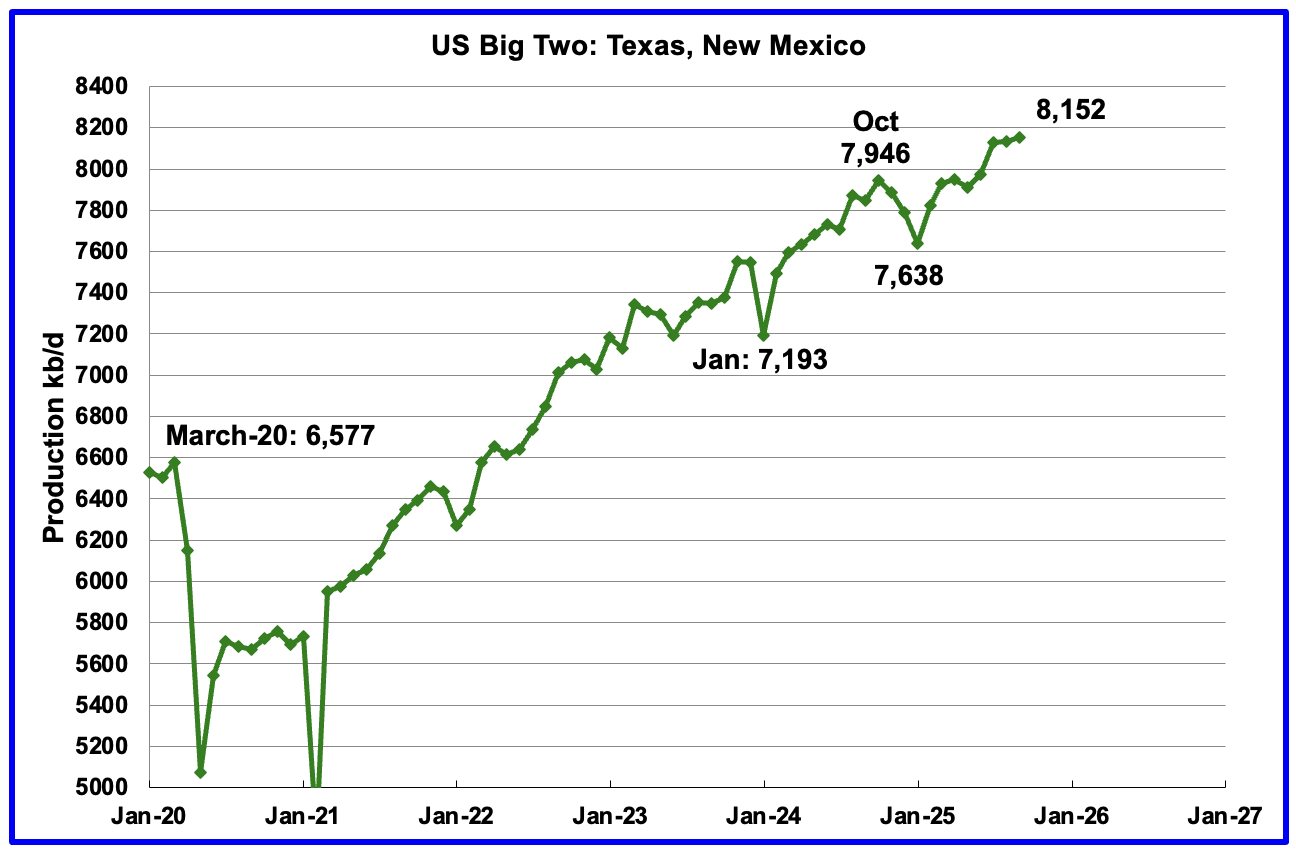
Combined oil output for the Big Two states Texas and New Mexico.
September’s production in the Big Two states increased by a combined 20 kb/d to 8,152 kb/d, a new high. Clearly these two states were the drivers of US oil production growth up to September 2025.
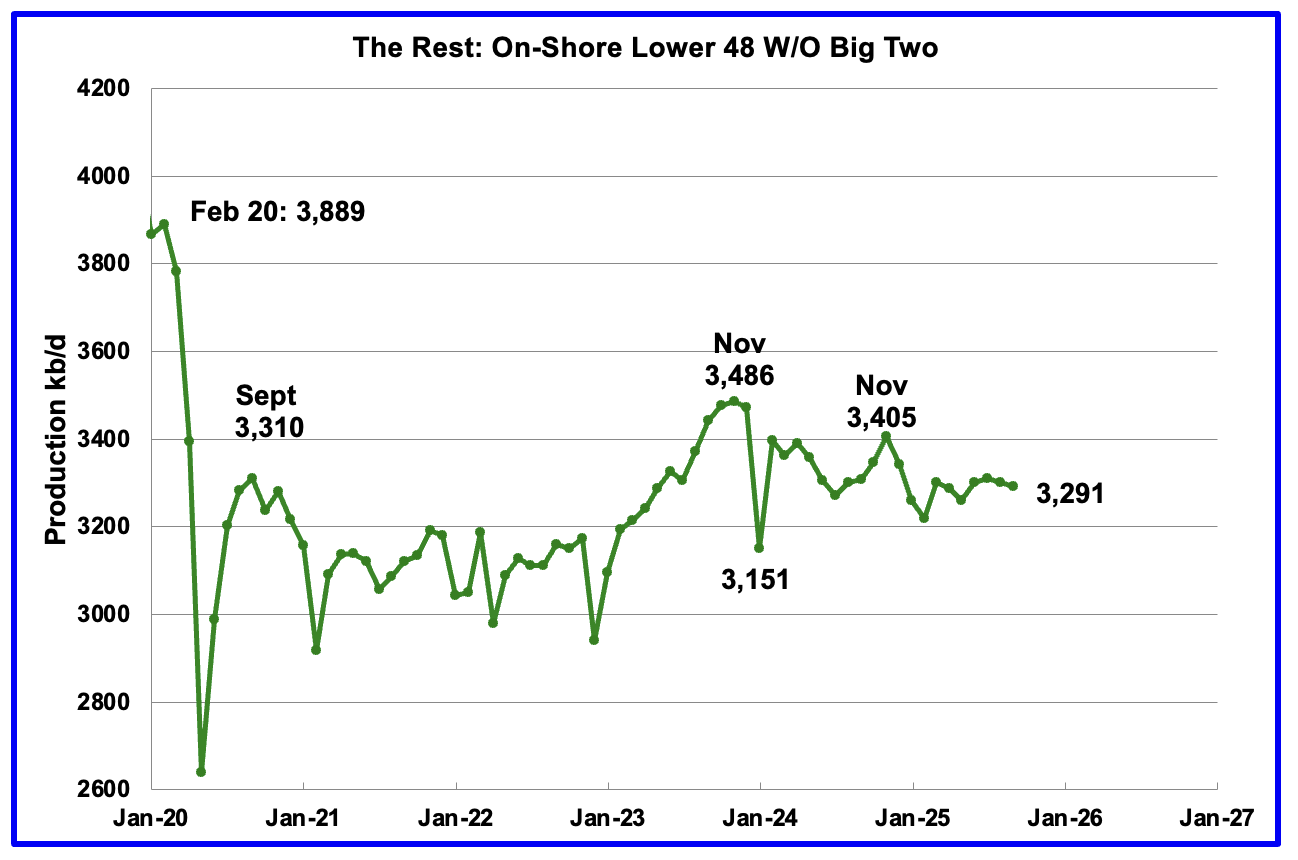
Oil Production by The Rest
September’s oil production by The Rest dropped by 9 kb/d to 3,291 kb/d and is 195 kb/d lower than November 2023.
The Big Beautiful Bill (OBBBA)
The other day I began wondering whether there was something in the OBBBA that was encouraging more oil drilling even as the price of WTI dropped from $70/b to $60/b. Since my knowledge of US Accounting/Tax rules for oil drilling is zero and was wondering how to get an answer, I finally realized I could ask that new all knowledgeable AI person to provide an answer. Here is how Mr Googl AI responded.
“Yes, the legislation referred to colloquially as the “
Big Beautiful Bill” (officially the One Big Beautiful Bill Act, or OBBBA, signed into law on July 4, 2025) includes significant tax provisions that function as extra write-offs for the oil and gas industry, including for new oil wells.
Key provisions benefiting new oil drilling include:
- 100% Bonus Depreciation: The Act permanently restores and expands the 100% bonus depreciation, a key provision that had begun to phase out under previous law. This allows oil and gas companies to immediately write off the full cost of capital expenditures, such as drilling equipment and pipelines, in the first year they are purchased, rather than depreciating them over several years.
- Intangible Drilling Costs (IDC): Restrictions in the prior law (the Inflation Reduction Act) on tax deductions for intangible drilling costs (which cover most non-equipment costs like labor, site preparation, and surveys) have been lifted.
- Reduced Royalty Rates: The bill also decreases the royalty rates that producers pay the government for drilling on federal land and in offshore areas.
These measures are projected to provide billions of dollars in new or extended subsidies to the fossil fuel industry over the next decade, making it cheaper to operate and invest in new oil and gas production.“
I will leave it to the oil experts to analyze the benefits of the OBBBA. The main sense I get is that a driller can right off most of the drilling costs which implies the price of oil is not a major factor because a driller is guaranteed to make a profit regardless of the price of WTI.
In the comments section below I will attach two articles related to the OBBA.
Permian Basin Report for Main Counties and a District
This special monthly Permian section was added to the US report because of a range of views on whether Permian production will continue to grow or will peak over the next year or two. The issue was brought into focus many months back by two Goehring and Rozencwajg Reports and Report2 which indicated that a few of the biggest Permian oil producing counties were close to peaking or past peak.
A more recent report was issued and can be reviewed Here. In this report they state:
“For years now, we have outlined with what we hoped was clarity, and what we now submit was prescience, the view that U.S. shale oil, that great source of modern supply, could not grow forever. It would mature, crest, and begin its long descent. That moment, by our models and measures, has arrived: shale has plateaued, and 2024 appears to be its high-water mark. And yet, investor sentiment has scarcely been more downbeat.”
This section will focus on the four largest oil producing counties in the Permian, Lea, Eddy, Midland and Martin. It will track the oil and natural gas production and the associated Gas Oil Ratio (GOR) on a monthly basis. The data is taken from the state’s government agencies for Texas and New Mexico. Typically the data for the latest two or three months is not complete and is revised upward as companies submit their updated information. Note the natural gas production shown in the charts that is used to calculate the GOR is the gas coming from both the gas and oil wells.
Of particular interest will be the charts which plot oil production vs GOR for a county to see if a particular characteristic develops that indicates the field is close to entering or in the bubble point phase. While the GOR metric is best suited for characterizing individual wells, counties with closely spaced horizontal wells may display a behaviour similar to individual wells due to pressure cross talking . For further information on the bubble point and GOR, there are a few good thoughts on the intricacies of the GOR in an earlier POB comment and here. Also check this EIA topic on GOR.
New Mexico Permian
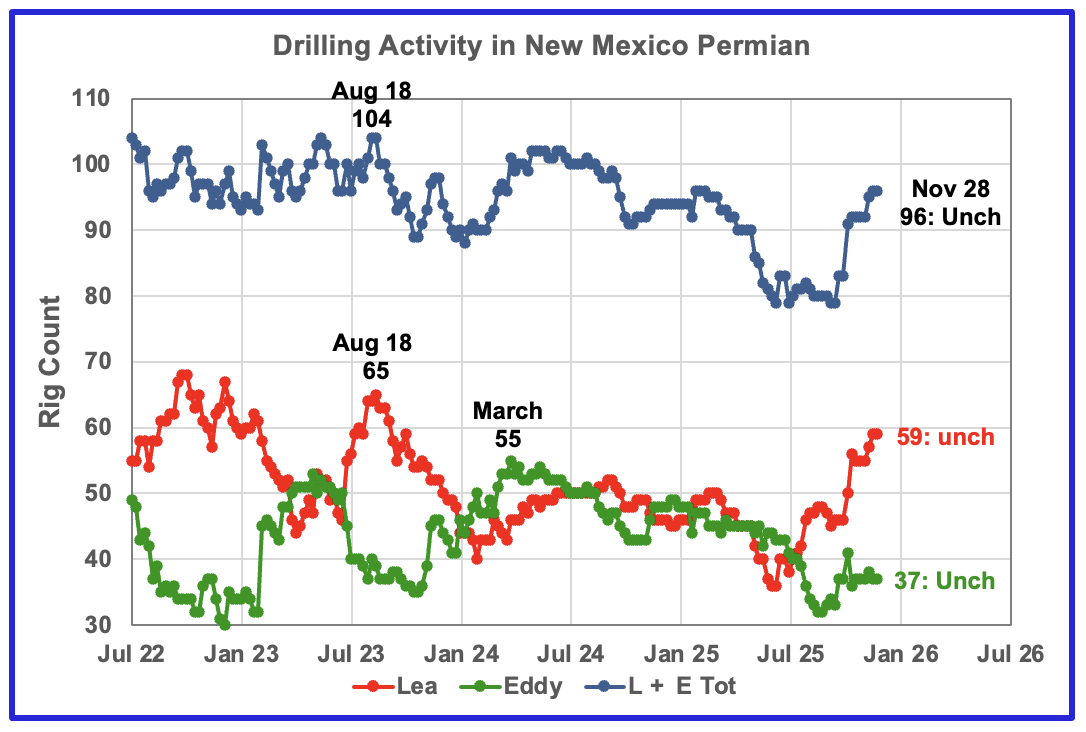
The current rig counts in Lea and Eddy counties are moving in different ways, Lea is adding while Eddy is holding steady. Over the past month Lea added 4 rigs to 59 while Eddy has held steady at 37.
Oil Production in New Mexico’s Primary Permian Counties
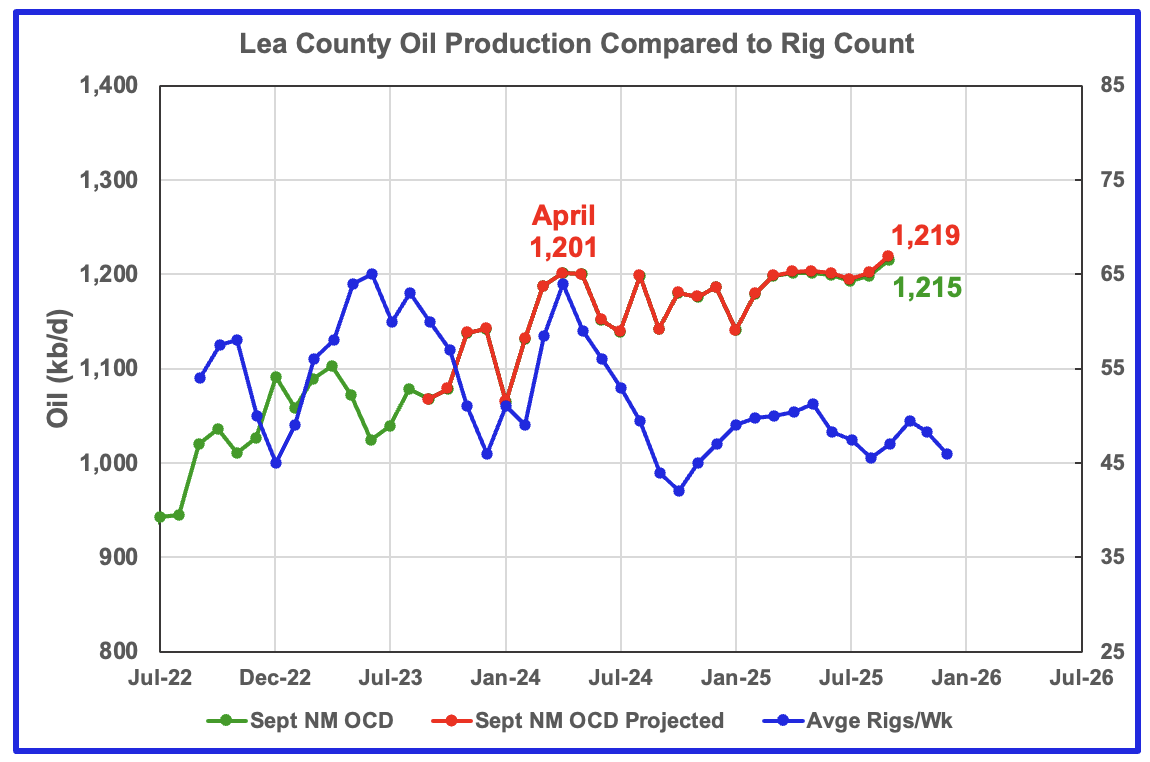
Lea County’s oil production started its plateau phase in April 2024 at 1,201 kb/d and the plateau continues to September 2025 but with a slight rise of 17 kb/d to 1,219 kb/d. In the last post it was noted that the August projection of 1,259 kb/d was over optimistic because July’s oil production was under reported. In this report August production has been revised down from 1,259 kb/d to 1,202 kb/d.
Preliminary September data from New Mexico’s Oil Conservation Division (OCD) indicates Lea County’s oil production rose 17 kb/d to 1,215 kb/d, green graph, and is a second indictor that production is rising in Lea County. The September production rise could be associated with the rising rig count that starts in time shifted September 2025.
A couple of months back I had the impression that Lea county was on the verge of entering a slowly declining phase. However after looking at this month’s data showing very flat production from April 2024 to August 2025 and a rise in September, one cannot infer/see a start to slowing production.
The blue graph shows the average number of weekly rigs operating during a given month as taken from the weekly rig data. The rig graph has been shifted forward by 8 months. So the 64 Rigs/wk operating in August 2023 have been time shifted forward to April 2024 to show the possible correlation and time delay between rig count, completion and oil production.
Note that rig counts are being used to project production as opposed to completions because state completion data is not available. However completion data from the Drilling Productivity report below indicates that extra DUCs are being completed in the Permian at this time.
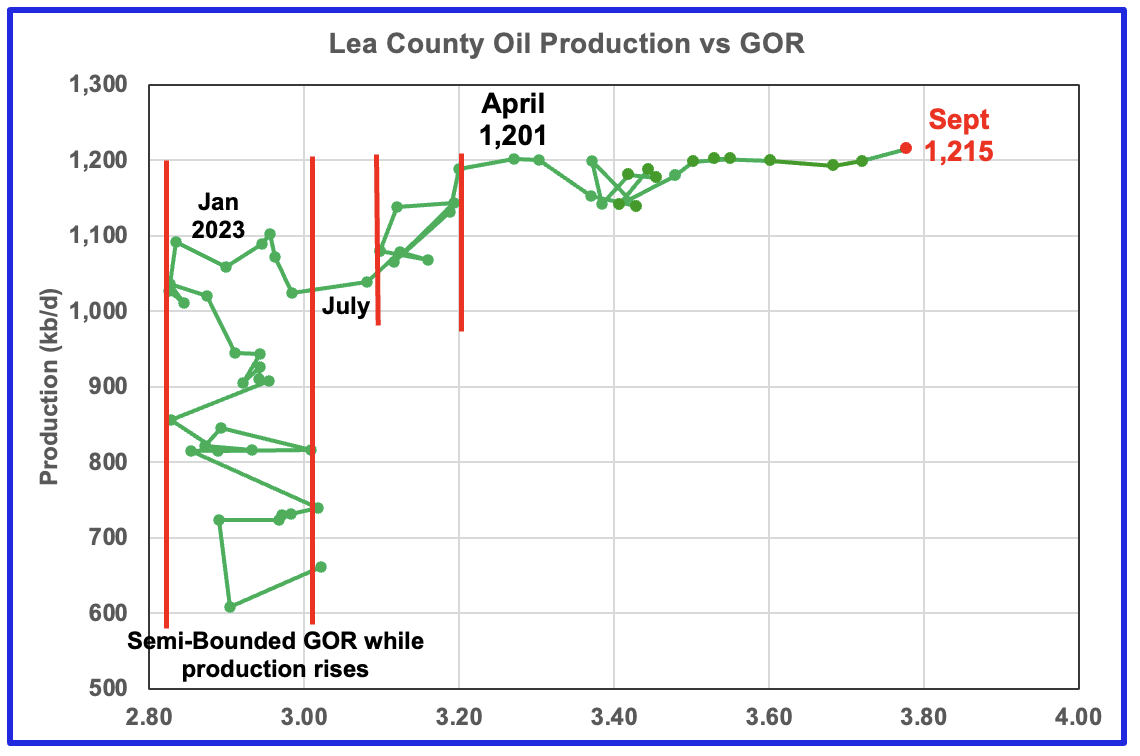
After much zigging and zagging, oil production in Lea county stabilized just below 1,100 kb/d in early 2023. Once production reached a new high in January 2023, production appeared to be on a plateau while the GOR started to increase rapidly to the right and first entered the bubble point phase in July 2023.
Since July 2023 Lea County’s production continued to increase as the GOR remained within a second semi-bounded region. This may indicate that additional production was coming from an oilier part of a layer since the GOR’s behaviour since August 2023 to March 2024 time frame appears once again to be in a second semi bounded GOR phase accompanied with rising production.
The GOR moved out of the second semi-bounded GOR region in April 2024 as production hit a new high of 1,201 kb/d. From July 2024 to May to February 2025 the GOR was range bound between 3.35 and 3.45 but from March 2025 to September 2025 the GOR has risen every month to hit new highs. September’s GOR was 3.78 while preliminary production increased to a new high of 1,215 kb/d
This zigging and zagging GOR pattern within a semi-bounded GOR while oil production increases to some stable level and then moves out to a higher GOR to the right has shown up in a number of counties. See a few additional cases below. The rising GOR to new highs in Lea county is an early indicator that production may be close to entering a declining phase even though the September projection does not confirm this.
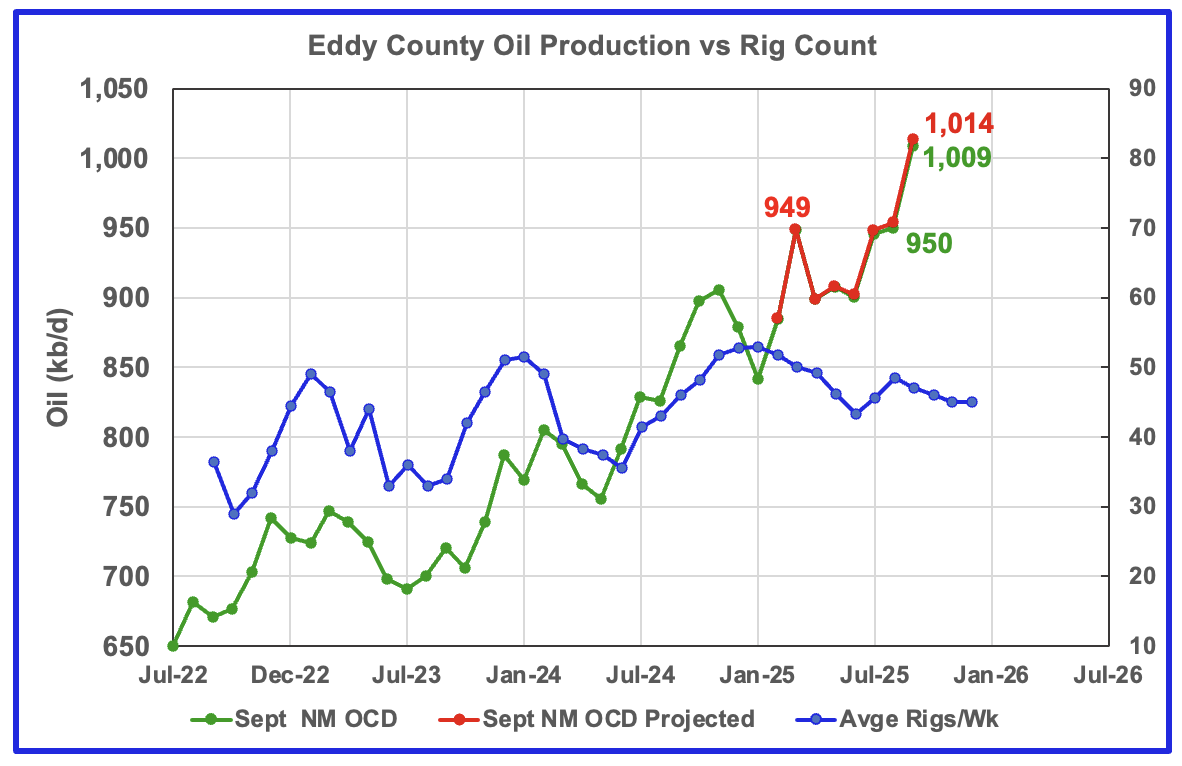
September’s projected oil production increased by 60 kb/d to 1,014 kb/d, a new high while preliminary production from the NM OCD increased by 59 kb/d to 1,009 kb/d. Eddy county’s month over month production updates are very few and small and primarily occur in the last three or four months which indicates their preliminary production is very close to final. This month’s updates/revisions again were minimal. The rising production could be linked to the increasing rig count starting in time shifted July 2025 and could possibly be the beginning of a short increasing phase. Will the falling rig count affect production after September?
The blue graph shows the average number of weekly rigs operating during a given month as taken from the above weekly drilling chart. The rig graph has been shifted forward by 8 months to roughly coincide with the increase in the production graph starting in November 2023.
Clearly the production rise up to November 2024 is closely associated with the rise in the rig count and associated well completions delayed by roughly eight months.
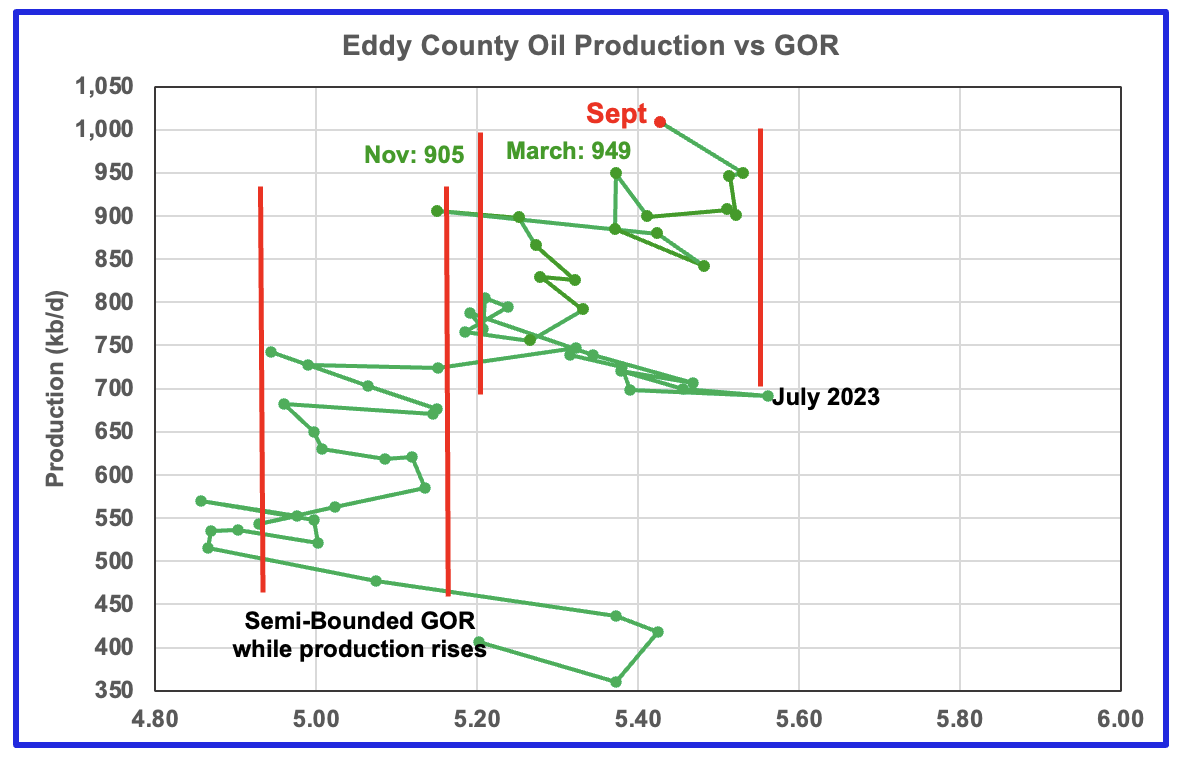
The Eddy county GOR pattern is similar to Lea county except that Eddy broke out from the first semi bounded range earlier and then added a second wider semi-bounded GOR phase. For September New Mexico’s Oil Conservation Division (OCD) reported preliminary oil production increased by 59 kb/d to 1,009 kb/d while the GOR dropped to 5.43 and remained within the second Semi-Bounded GOR range.
Texas Permian
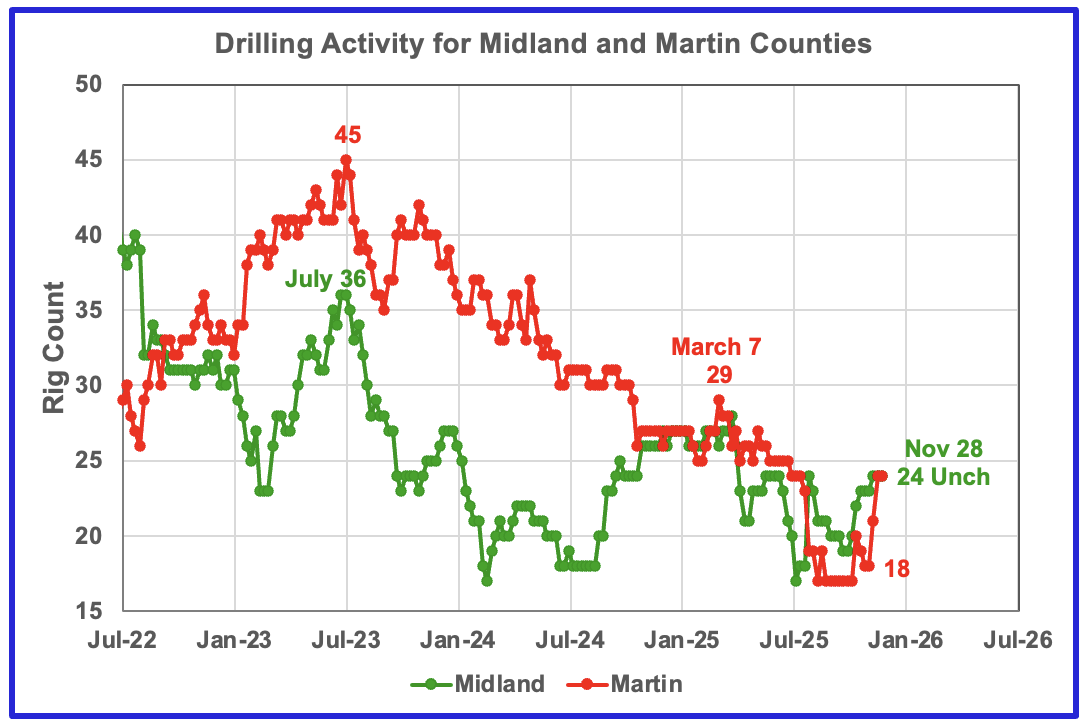
The rig count in both Midland and Martin counties have increased over the past month. Midland added 1 rig while Martin added 6 to 24.
Oil Production in Primary Permian Texas’ Counties
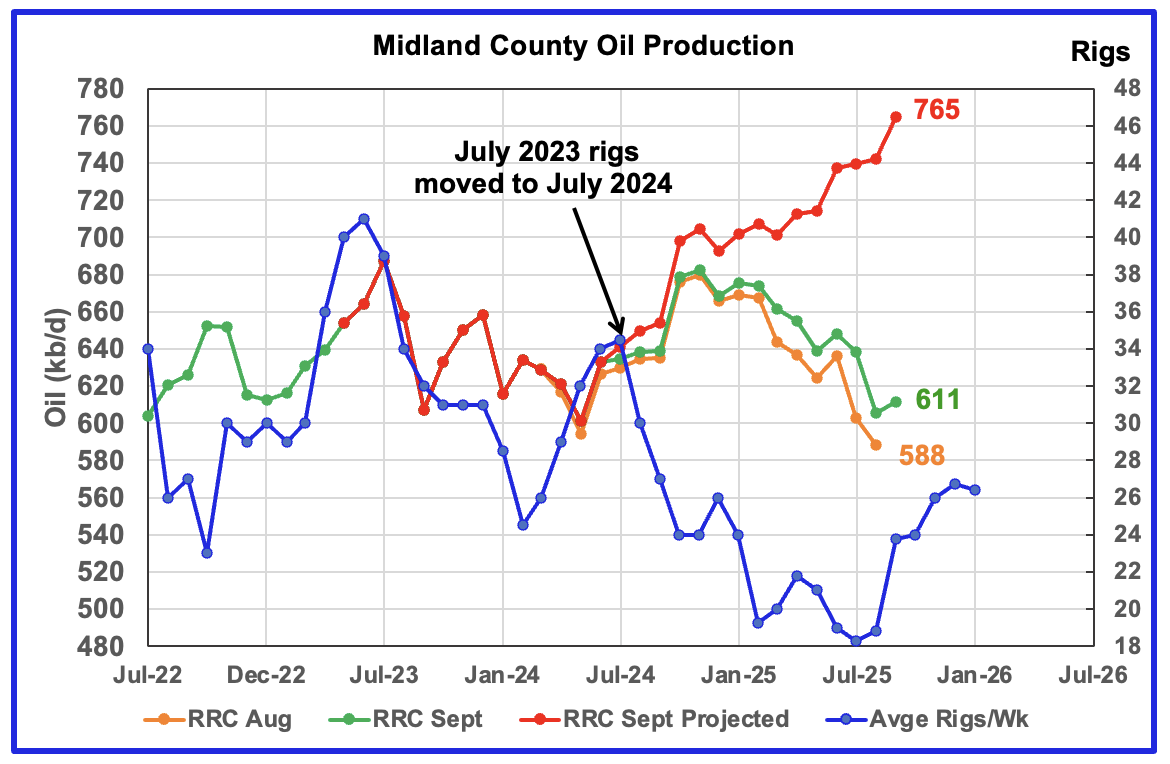
September’s projected production rose by 23 kb/d to 765kb/d. However I think September’s projected production looks optimistic because of production revisions dating back to June 2024. I think a more realistic production projection for September is in the 710 kb/d to 720 kb/d range. Projected production for October and November may see an increase associated with the rising rig count starting in time shifted August 2025. What is significant in this chart is the increase in September’s preliminary production over August by 6 kb/d to 611 kb/d. This may be an early indication of forthcoming rising production.
The orange and green graphs show preliminary oil production for Midland County as reported by the Texas RRC for August and September. The red graph uses the August and September data to project production as it would look after being updated over many months.
The blue graph shows the average number of weekly rigs operating during a given month as taken from the weekly drilling chart. The rig graph has been shifted forward by 12 months to better align with production. So the average 34.5 Rigs/wk operating in July 2023 have been moved forward to July 2024 to show the possible correlation and time delay between rig count, completions and oil production.
The 12 month rig time shift is much larger than the typical six to eight months used in other counties. It is not clear why there should be such a difference. If the twelve month shift in the rig count is approximately correct in that oil production can be tied to the rig count, oil production in Midland county should continue to rise for a few more months.
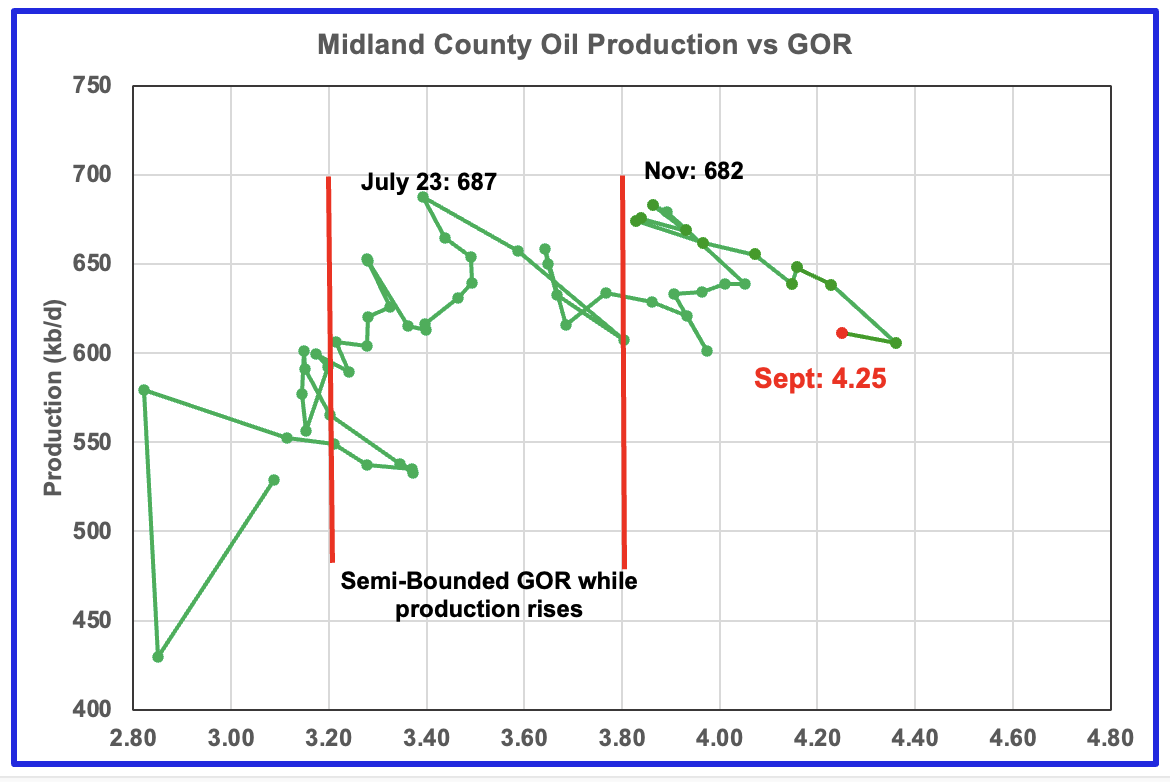
For September the Midland GOR ratio dropped to 4.25 from 4.36 in August while the reported preliminary oil production rose by 6 kb/d to 611 kb/d.
When Midland county GOR initially moved into the bubble point phase, oil production and the GOR stayed within a narrow range of 3.8 to 4.0 outside of the initial Semi-Bounded GOR region from March 2024 to March 2025. However after March, the April to August 2025 GORs broke out to new highs. The September GOR reversed the trend and the dropped to 4.25 but still stayed outside the Semi-Bounded region.
The oil production and GOR data shown in this chart are based on the RRC’s September production report.
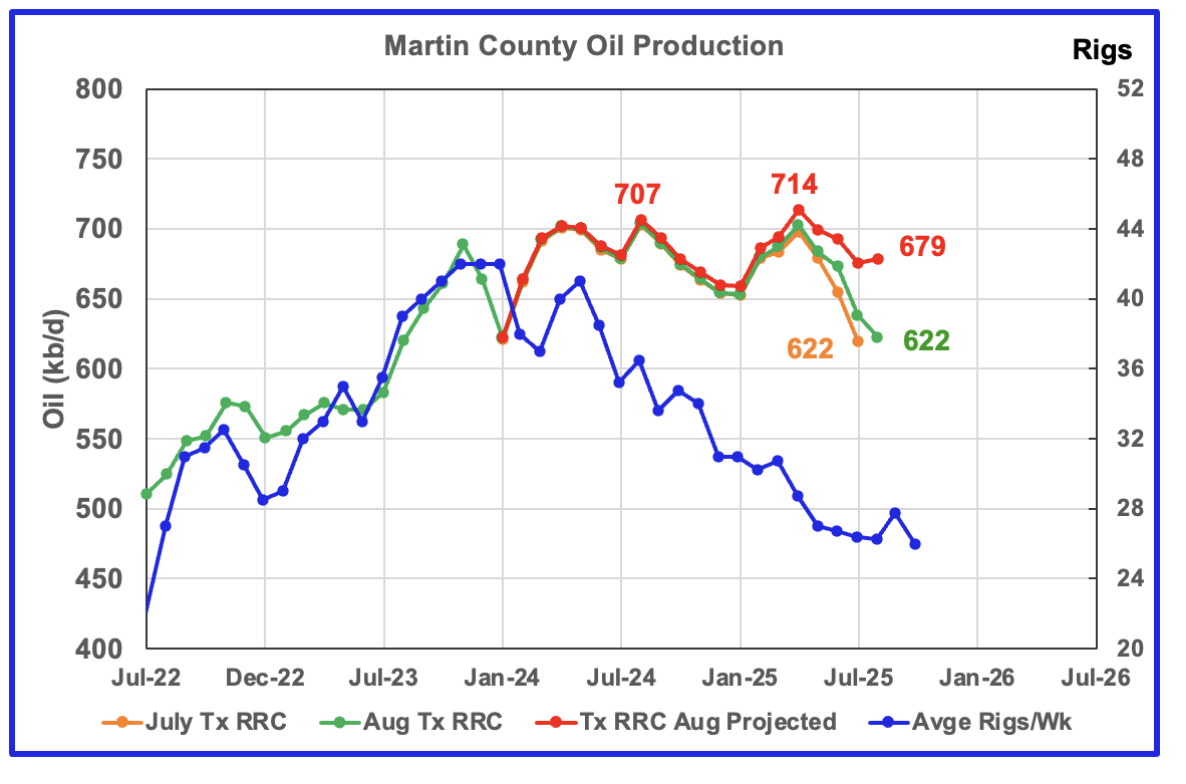
For Comparison: Martin County production from last month.
Martin county’s projected September oil production dropped by 6 kb/d to 715 kb/d. I think the September projected production is overly optimistic and a more realistic level would be somewhere between 665 kb/d and 680 kb/d. The April peak is probably closer to 725 kb/d. Note the peak production in the preliminary data for August 2024 and April 2025, green chart are both close to 715 kb/d.
The September projected production is overly optimistic because the MoM updates are larger than in previous months. In the comparison chart above, production revisions, which are indicted by the gap between the green and orange graphs, do not show up till March 2025. In the current chart, the orange green gap visibly starts in July 2024. More critically note that peak production occurs in April 2025 in both cases and then drops.
The projected production increase starting January 2025 is real but then peaks in April before starting a new declining trend. The more significant part of the projection is the last five months which shows production fell by 51 kb/d from 766 kb/d in April to 715 kb/d in September. Based on the April to September production drop, I think Martin County has entered its declining phase.
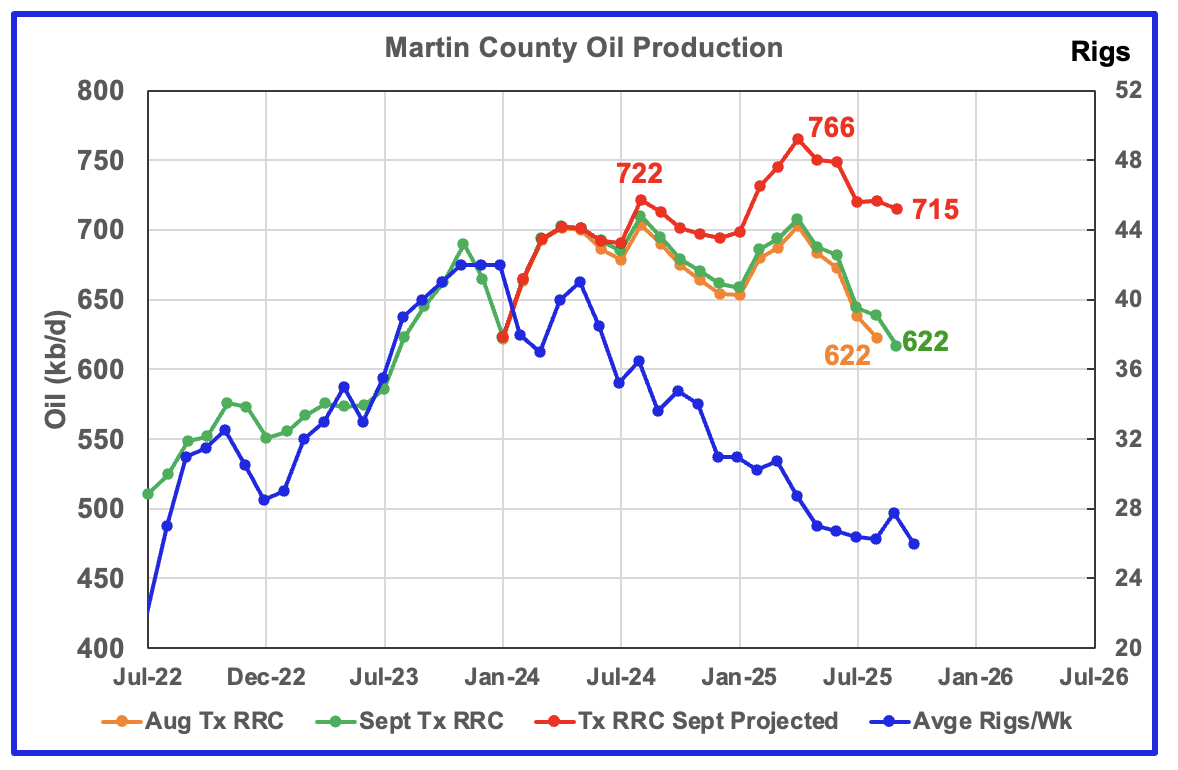
The red graph is a projection for oil production as it would look after being updated over many months. This projection is based on a methodology that uses preliminary August and September production data. The green graph shows the preliminary oil production reported by the Texas RRC for September. Production since May might have begun to track the time shifted rig chart.
The orange and green graphs show production for Martin County as reported by the Texas RRC for August and September. The blue rig graph time shifts the rig count ahead by 6 months.
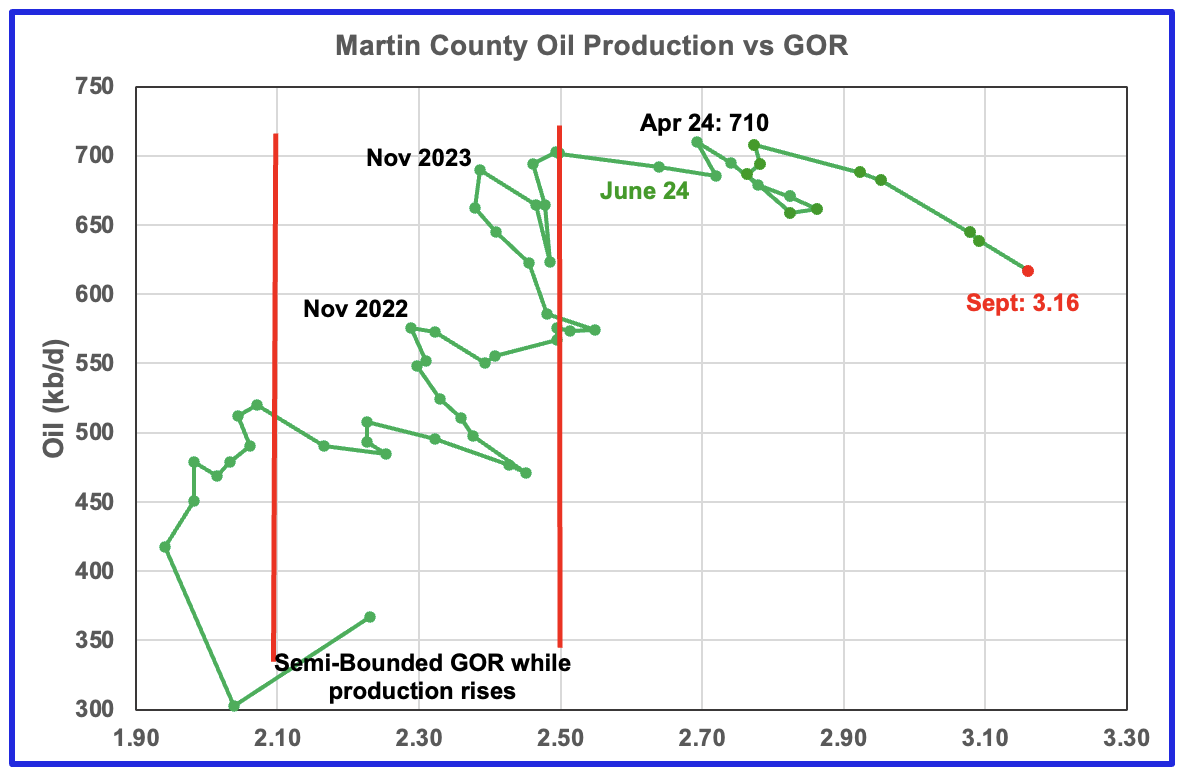
Martin county’s oil production after November 2022 increased and at the same time drifted to slightly higher GORs within the semi bounded range. However the June 2024 GOR saw its first move out of the semi bounded region. The RRC’s preliminary September 2025 production for Martin County shows a 21 kb/d decrease accompanied by an increase to the GOR to 3.16.
Martin county has the lowest semi-bounded GOR boundary of the four counties at a GOR of close to 2.50. The GOR is now clearly out of the semi-bounded region. Martin County has now entered the bubble point phase that should result in oil production possibly entering a slowly declining phase.
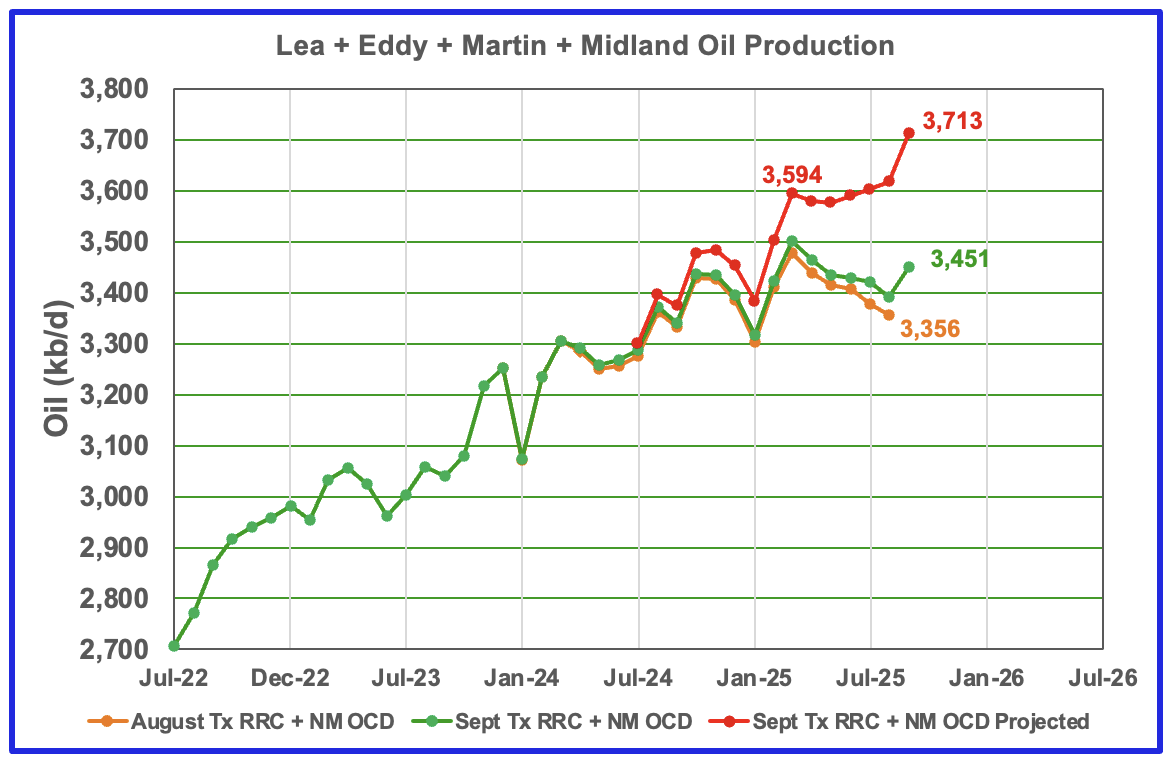
This chart shows the total oil production from the four largest Permian counties. Assuming current Permian production is close to 6,600 kb/d, these four counties account for 56% of the total. September’s projected production increased by 95 kb/d to 3,713 kb/d and is the fourth consecutive month showing increasing production.
The rising production is the result of rising production in Lea, Eddy and Midland counties. As noted above, production in Midland and Martin counties for the last few months is a bit optimistic and a more likely scenario is that September production from these four counties is closer to the 3,650 kb/d. Regardless it will be up. The big question is for how many more months can production continue to rise in the face of dropping WTI?
The August and September initial production data are shown in the orange and green graphs respectively. The red graph uses the August and September production data to project a more realistic estimate for the final updated September production.
Findings
– The preliminary September production data for New Mexico is very good. The Texas RRC production data had MoM revisions that resulted in slightly optimistic projections.
– Lea county entered its plateau phase in May 2024. While oil production is not following the rig count graph directly, the dropping rig count has resulted in Lea County production being in a steady flat plateau phase up to August 2025. However September had a 17 kb/d production increase.
– July, August and September production in Eddy County saw an increase to a record high and is possibly signalling the beginning of a short production increasing phase.
– Midland County’s production after December 2024 is real but a bit optimistic. A more reasonable estimate for September’s production would be in the range 710 kb/d to 720 kb/d. September’s projected production looks optimistic due to the production revisions starting in July 2024. However, the production rise matches the rising rig count in time shifted September. The addition of six new rigs to Midland county in real August 2025 to 24 was an unexpected surprise and makes one wonder what it implies for Midland county going forward, after allowing for a production delay.
– Martin County appears to be in a declining phase that started in April 2025.
Texas District 8
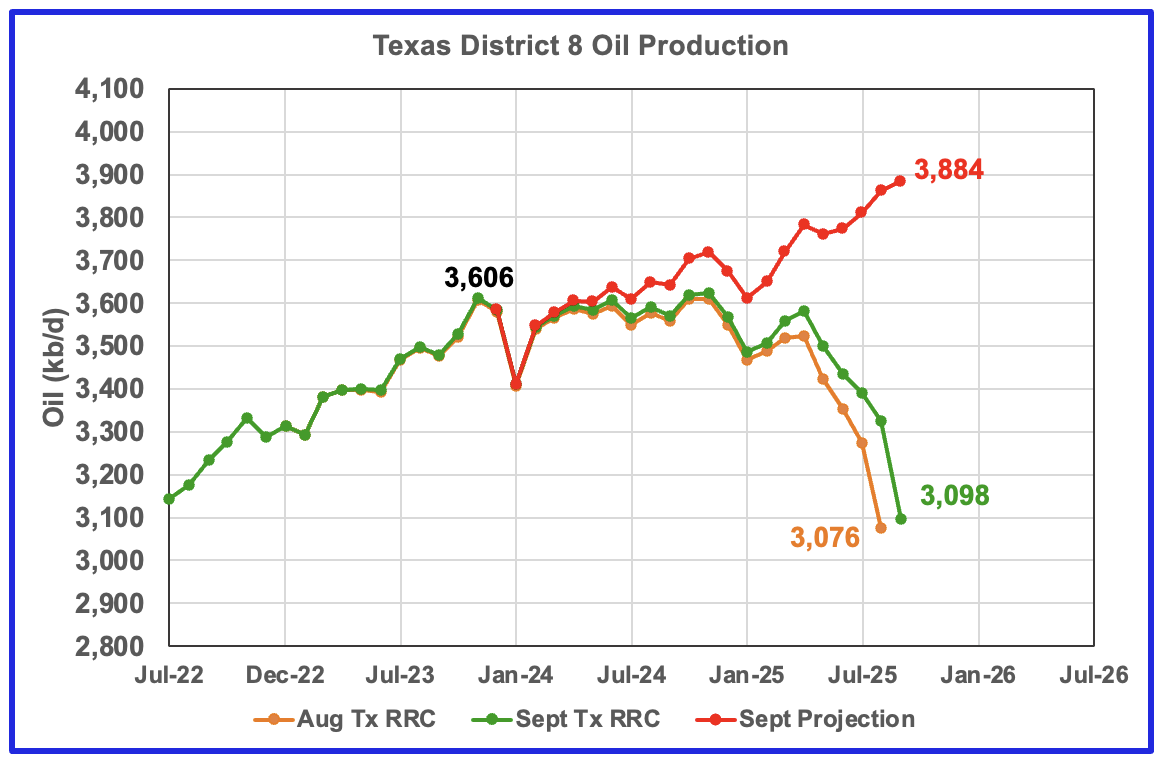
The District 8 production chart is showing rising production. However due to revisions to last month’s production all the way back to April 2024, the projection is optimistic. A more realistic production level for April to July is 3,700 kb/d and 3,800 kb/d for September. Notice that the three green peaks are close to 3,600 kb/d which maybe indicating an upcoming plateau phase.
September saw a projected production increase of 22 kb/d to 3,884 kb/d.
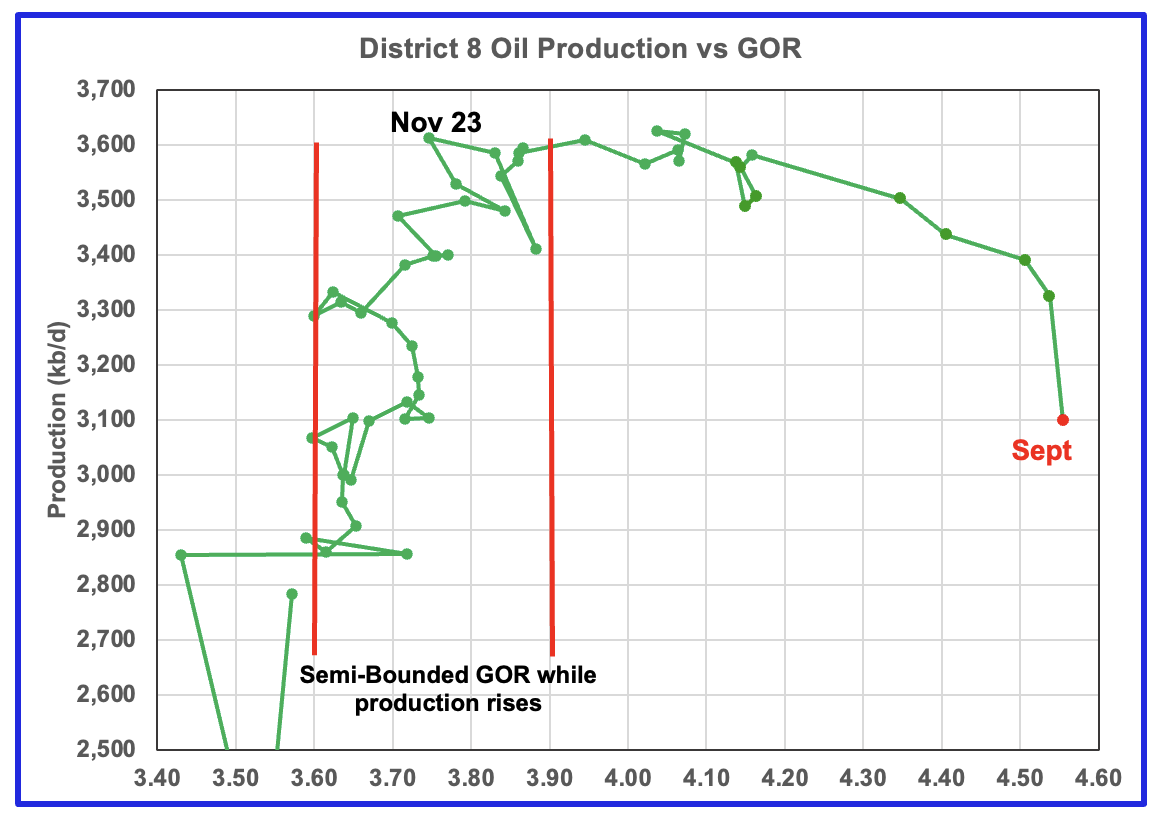
Plotting an oil production vs GOR graph for a district may be a bit of a stretch. Regardless here it is and it seems to indicate many District 8 counties may well be into the bubble point as the September GOR increased slightly to a record 4.55 as the preliminary RRC production fell by 226 kb/d
Oil Production and GOR Charts for Three of the Larger Texas Oil Counties
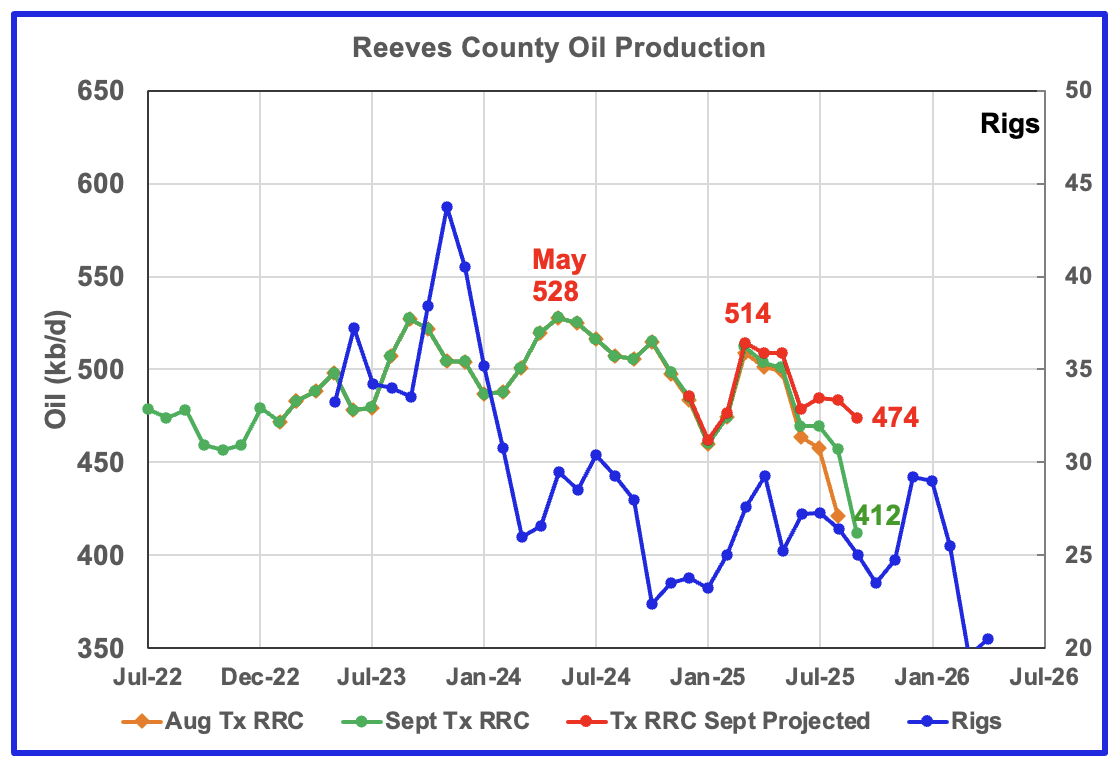
September’s projected oil production for Reeves County dropped by 10 kb/d to 474 kb/d. Note how the visible production revisions, gap between orange and green graphs, don’t start till April 2025.
Reeves County has entered its declining phase and appears to be dropping due to the falling rig count. Reeves county is ranked as #3 for oil production in Texas, after Midland and Martin counties.
Last month I noted that Reeves August’s production was optimistic and estimated it would be lower at around 540 kb/d. Even that estimate was too high. August has been revised down to 484 kb/d.
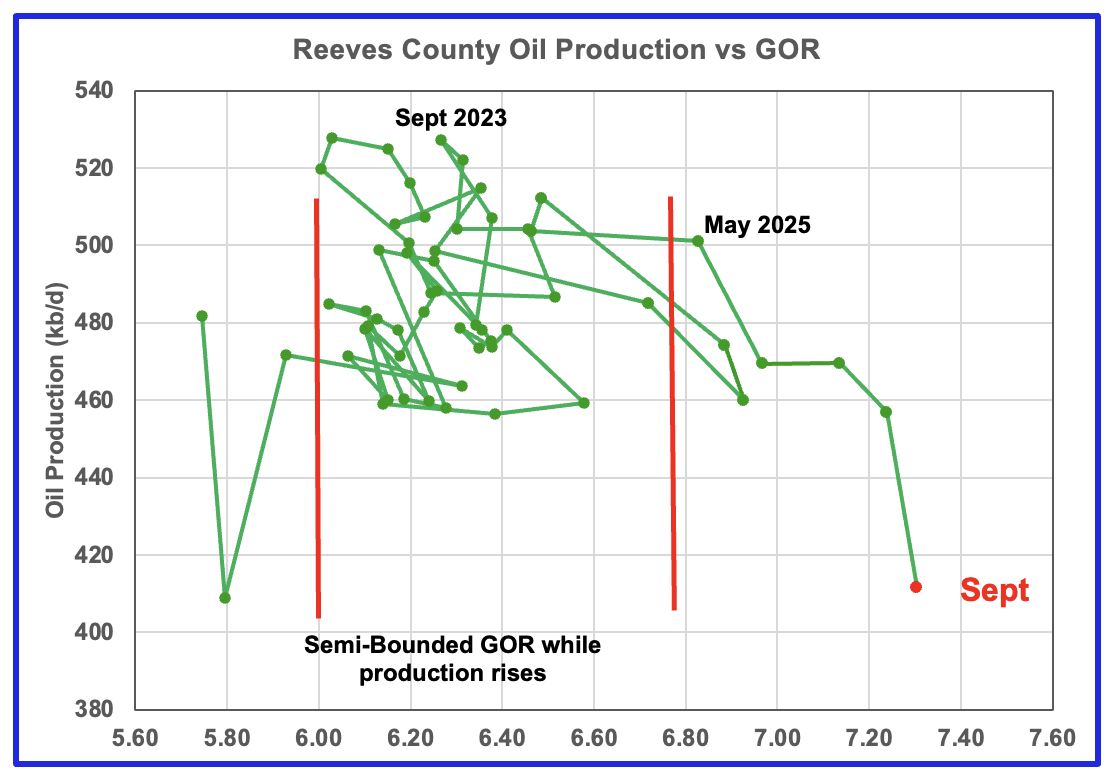
The GOR chart indicates Reeves County initially entered the bubble point phase in January 2025 and then reversed back into the Semi-Bounded region. September’s GOR is 7.30 and is at a record high. The May 2025 GOR was a definite breakout from the Semi-Bounded region.
Reeves county GOR is high because it is the number one Texas county ranked by gas production. The current C + C production is almost split between crude and condensate, with concentrate about 15% higher than crude.
The rig count is time shifted forward by 7 months.
In Real June, 29 rigs were operational in Reeves county. By late November the rig count had dropped to 18.
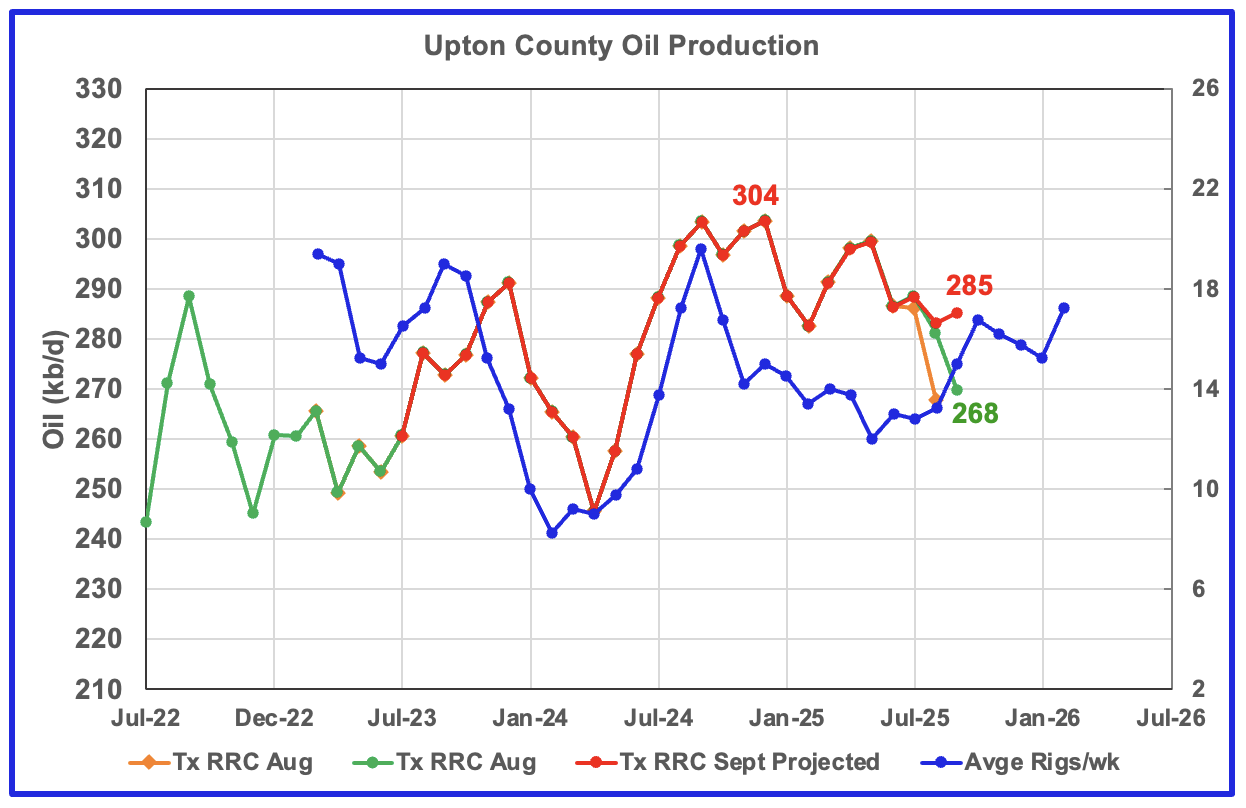
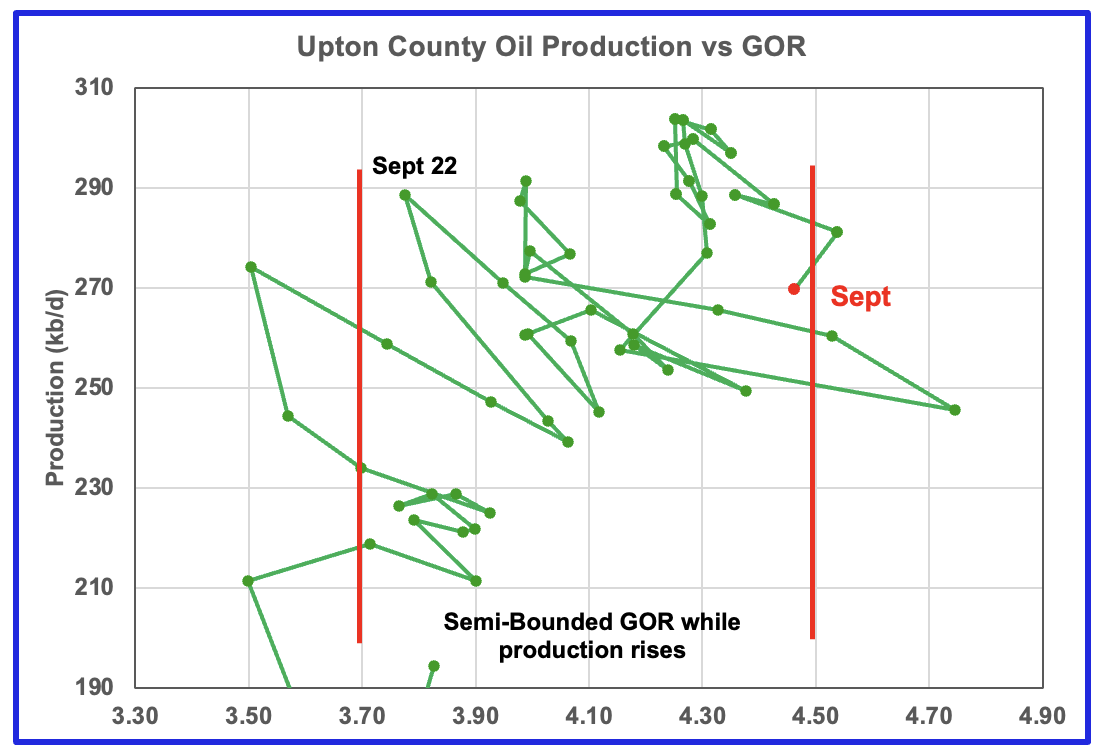
Upton County entered its declining phase in January 2025. September’s projected production rose by 2 kb/d to 285 kb/d. August’s production was revised down from 303 kb/d to 283 kb/d. For the next few months Upton county may see a production increase associated with the rising rig count in time shifted August 2025.
Upton’s oil production may be on the verge of entering the bubble phase since it popped out of the Semi- Bounded region in August and then barely re-entered it in September.
Upton’s rig chart has been time shifted forward by six months. Upton began the year with 13 rigs. In real September, 17 rigs were operating.
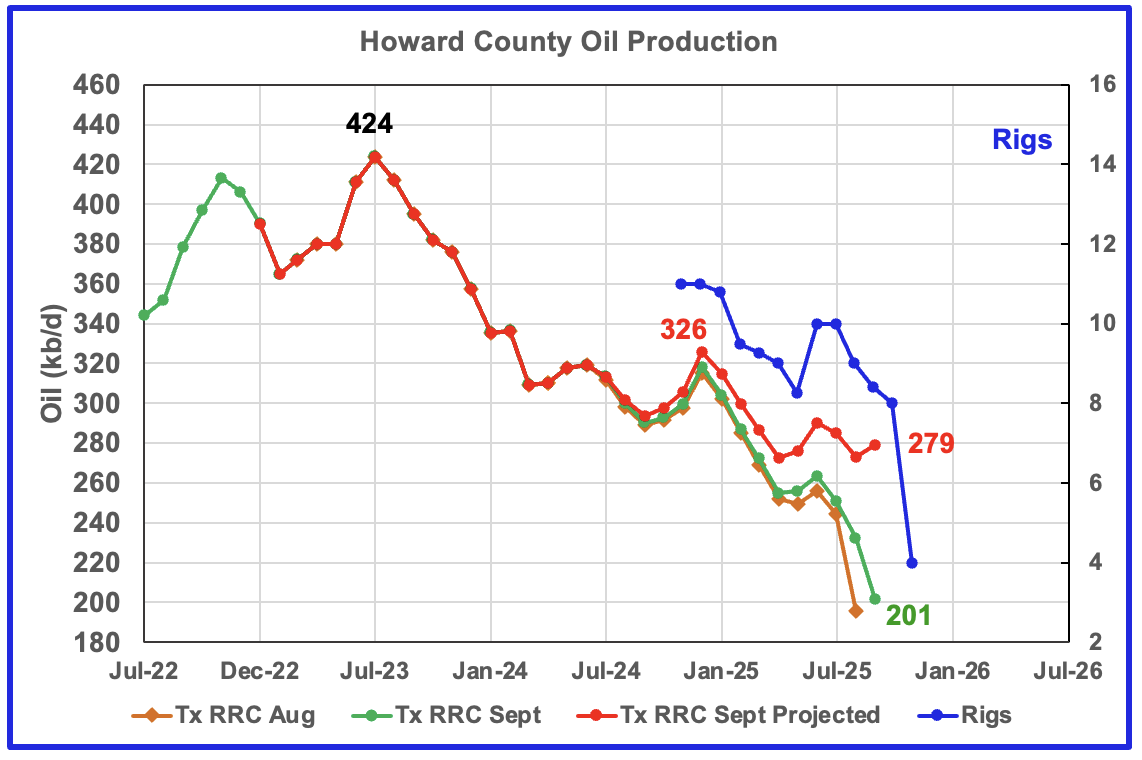
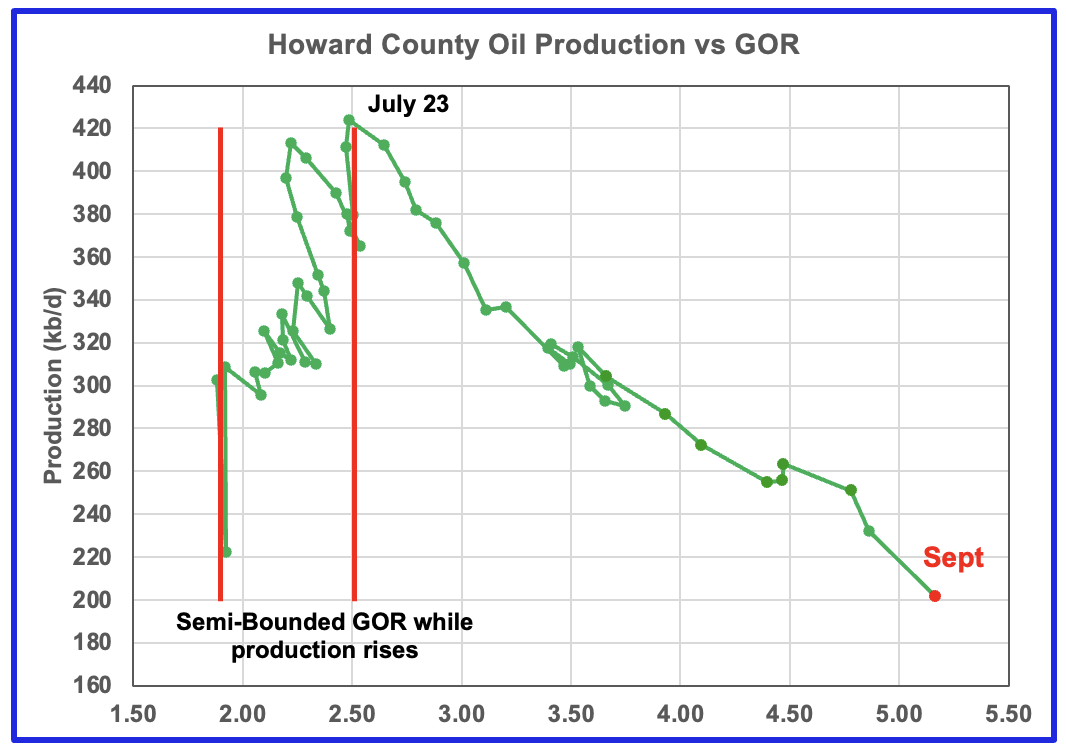
Howard County oil production peaked in July 2023 and has been in a slow decline ever since. The falling production has been falling along with the dropping rig count. In September the projected production rose by 6 kb/d to 279 kb/d. The rig graph is time shifted forward by 5 months.
The GOR continues to increase as production drops. The GOR ratio reached a new high of 5.17 in September.
Drilling Productivity Report
The Drilling Productivity Report (DPR) uses recent data on the total number of drilling rigs in operation along with estimates of drilling productivity and estimated changes in production from existing oil wells to provide estimated changes in oil production for the principal tight oil regions. The new DPR report in the STEO provides production up to October 2025. The report also projects output to December 2026 for a number of basins. The DUC charts and Drilled Wells charts are also updated to October 2025.
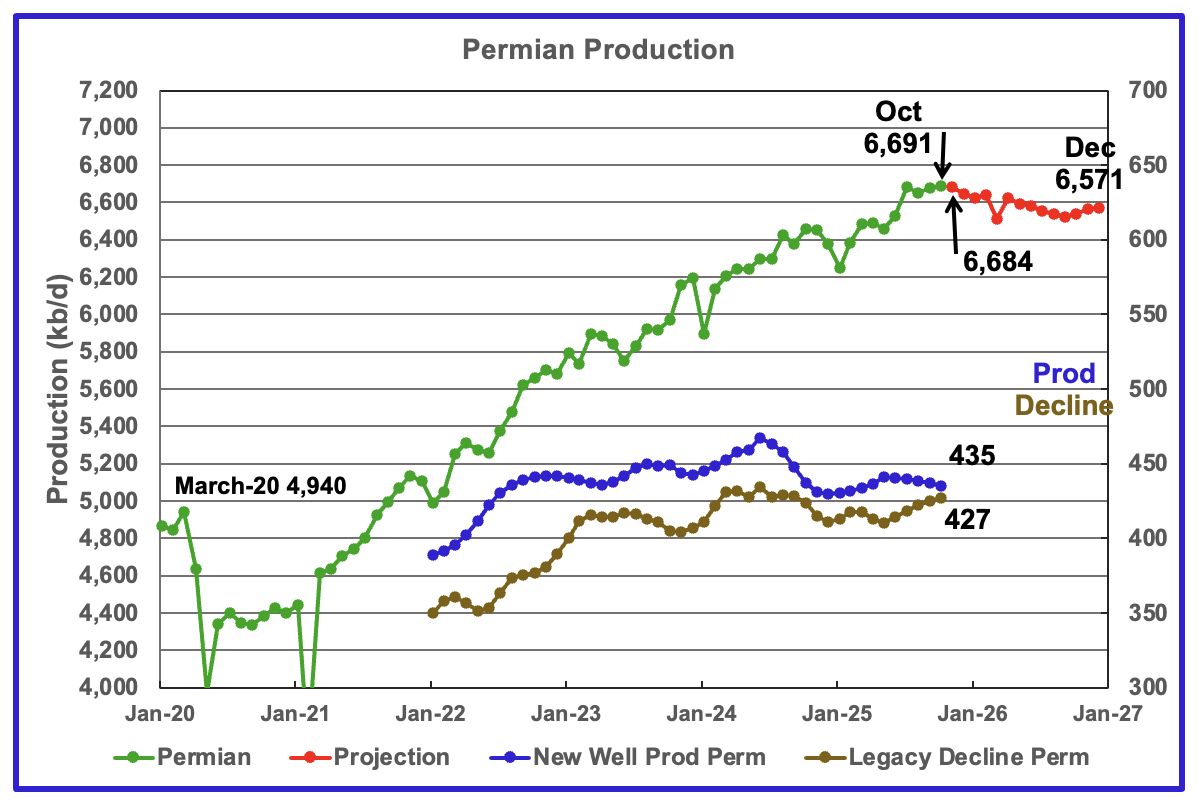
The EIA’s October STEO/DPR report shows Permian October output rose by 14 kb/d to 6,691 kb/d. October is expected to drop by 7 kb/d to 6,684 kb/d. From October 2025 to December 2026 output is expected to drop by 120 kb/d to 6,571 kb/d. Note that December 2026 production has been revised up by 52 kb/d from 6,519 kb/d to 6,571 kb/d.
Production from new wells and legacy decline, right scale, have been added to this chart to show the difference between new production and legacy decline. The gap has been getting smaller every month for the last six months. If this trend were to continue, it portends peak Permian production.
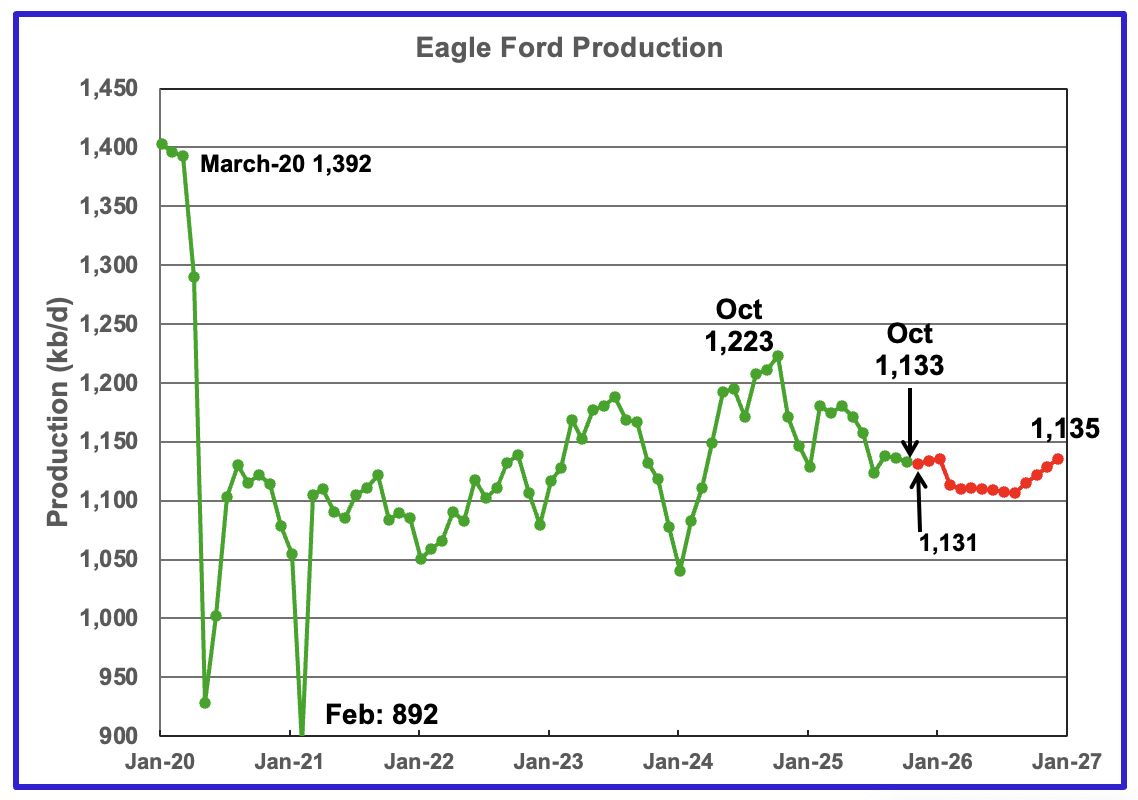
October’s output in the Eagle Ford basin decreased by 3 kb/d to 1,133 kb/d. November’s 2025 production is forecast to drop by 2 kb/d to 1,131 kb/d.
Output in December 2026 expected to be 1,135 kb/d, an increase of 54 kb/d from the previous report of 1,081 kb/d.
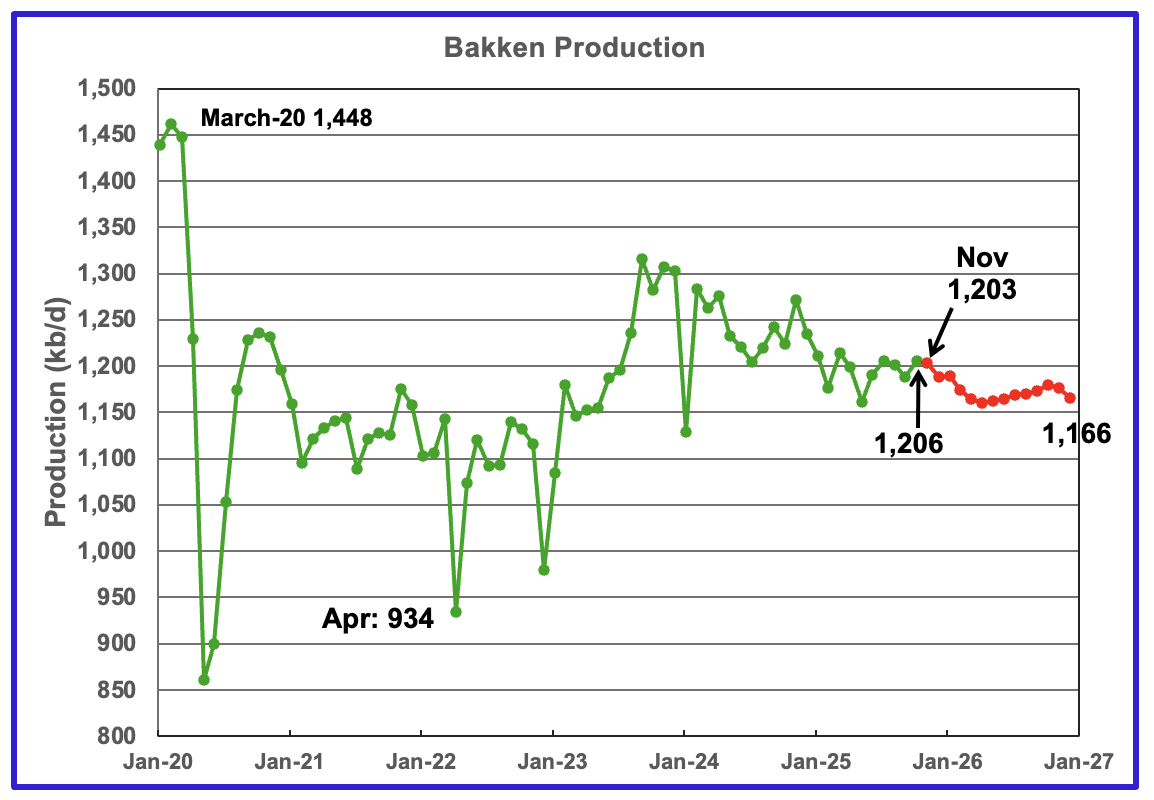
The DPR/STEO reported that Bakken’s October output rose by 17 kb/d to 1,206 kb/d. November production is expected to decrease by 3 kb/d to 1,203 kb/d. The STEO/DPR projection, red markers, shows output dropping to 1,166 kb/d in December 2026.
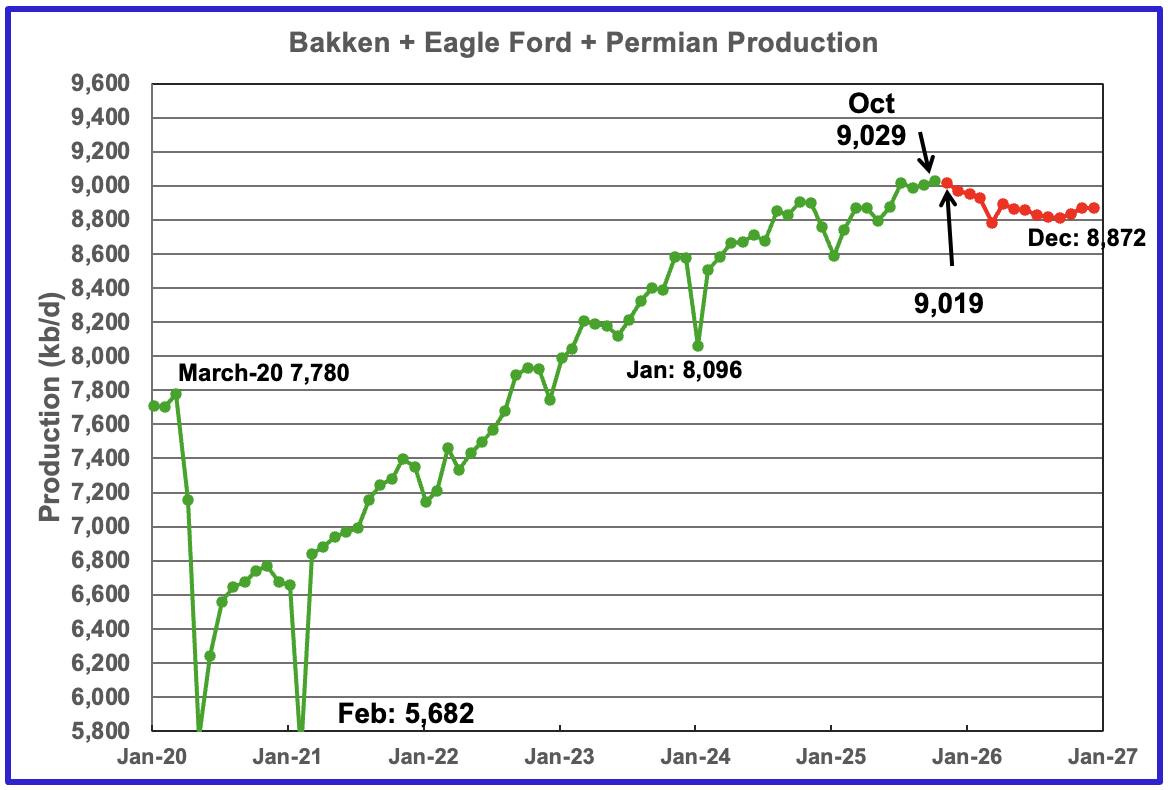
This chart plots the combined production from the three main LTO regions. For October output increased by 27 kb/d to 9,029 kb/d. Production for December 2026 is forecast to be 8,872 kb/d.
DUCs and Drilled Wells
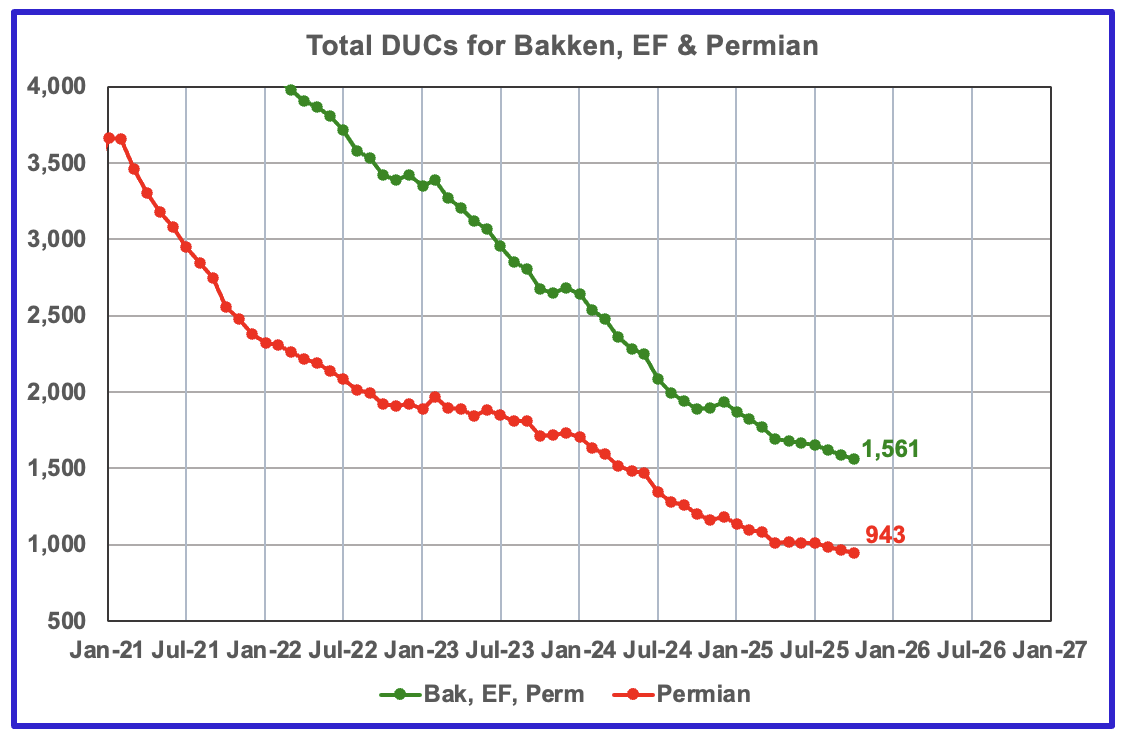
The number of DUCs available for completion in the Permian and the three major DPR regions has returned to a dropping trend. October’s DUC count for the three basins dropped by 27 to 1,561. In the Permian the DUC count dropped by 23 to 943.
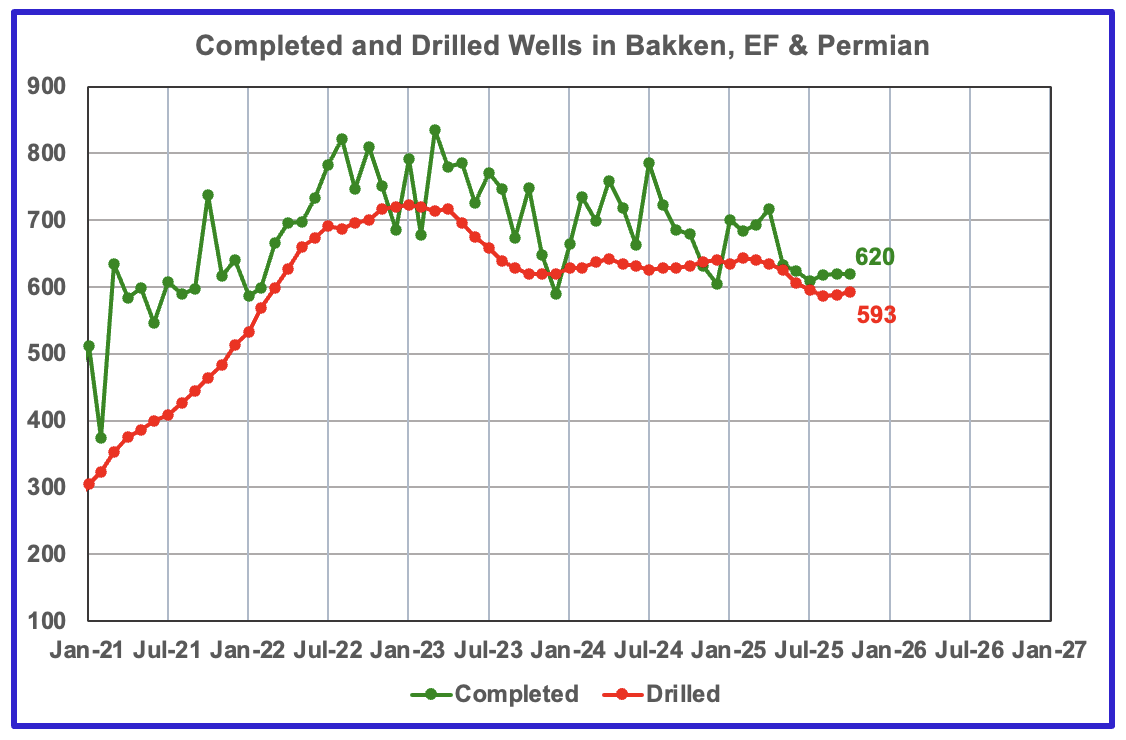
In the three primary regions, a total of 620 wells were completed in October, one more than in September. There were 593 wells drilled in October, 5 more than in September. For comparison, In January 2023, 722 wells were drilled.
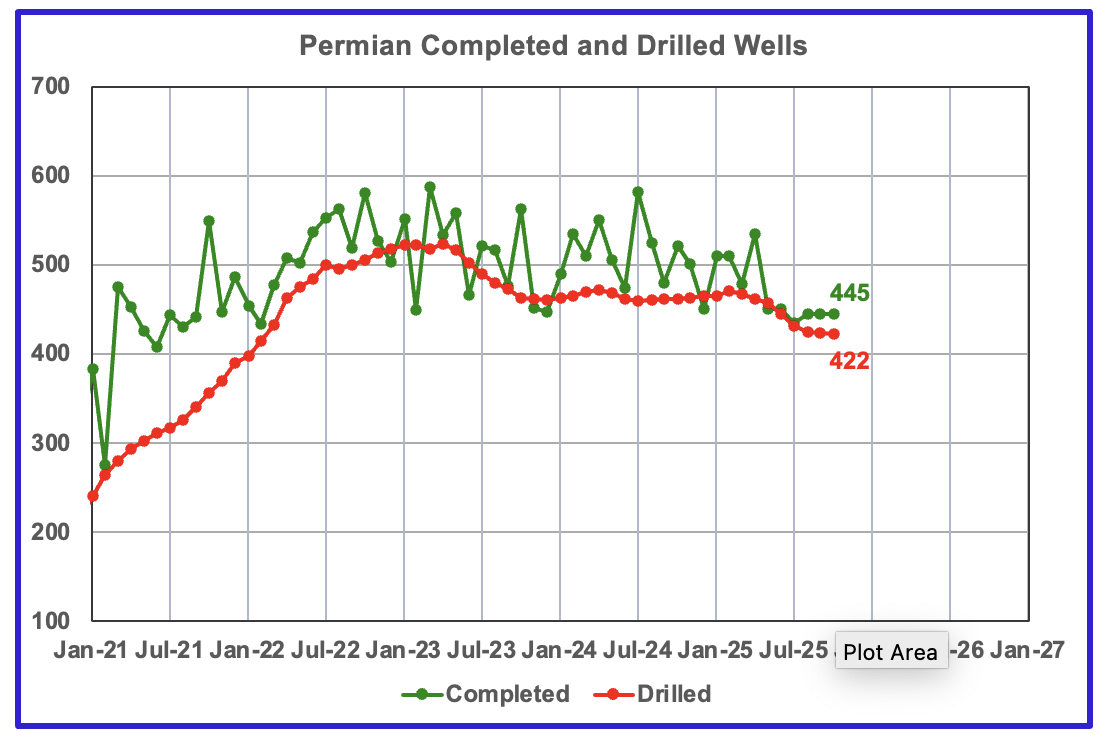
In the Permian, the monthly drilling rates have stabilized at 445 for the last 3 months.
In October 2025, 445 wells were completed and 422 new wells were drilled. This is the seventh month in a row in which the number of wells drilled has dropped.
Leave a Reply