A post by Ovi at peakoilbarrel.
All of the oil (C + C) production data for the US states comes from the EIAʼs Petroleum Supply monthly PSM. At the end, an analysis of three different EIA monthly reports is provided. The charts below are updated to April 2020 for the 10 largest US oil producing states.
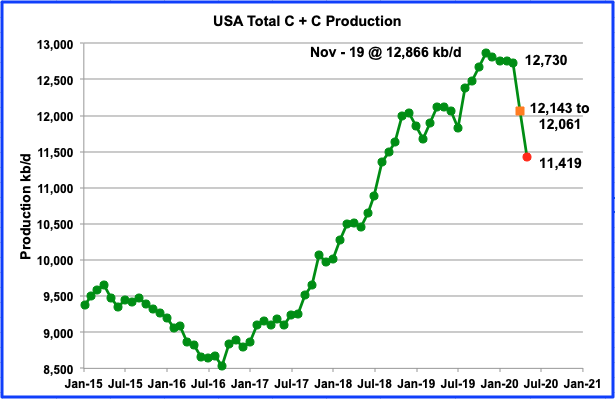
This US production chart is updated to April and tentatively extended to May and shows the continuous slow decline in oil output from US oil fields from November 2019 to March 2020 and then the sharp acceleration in April and May. Since the current EIA data is two months delayed, April is the first month that shows the combined effects of the pandemic and low oil prices.
Read More