US July Oil Production Continues to Rise

A post by Ovi at peakoilbarrel

All of the oil (C + C) production data for the US state charts comes from the EIAʼs Petroleum Supply monthly PSM. After the production charts, an analysis of three EIA monthly reports projecting future production is provided. The charts below are updated to July 2020 for the 10 largest US oil producing states.

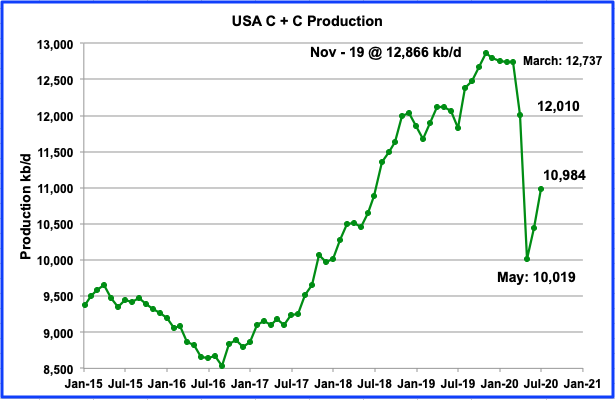
July’s US production continued to rebound from May’s low by adding 538 kb/d to June’s output. Since May, the US has added 965 kb/d, almost 1.0 Mb/d. May’s output was revised up by 3 kb/d from the EIA’s June report.

Read More

May Non-OPEC Oil Production drops to 2013 levels

A post by Ovi on peakoilbarrel

Below are a number of oil (C + C ) production charts for Non-OPEC countries created from data provided by the EIA’s International Energy Statistics and updated to May 2020.  Information from other sources such as the OPEC and country specific sites is used to provide a short term outlook for future output and direction.

Non-OPEC production dropped slowly from a high of 52,638 kb/d in December 2019 to 52,396 kb/d in March 2020. In April that changed when we saw the first big drop in output from the Non-OPEC countries associated with Covid and with the drop in world oil prices. May output collapsed to 45,340 kb/d, which is close to the production level in September 2013.

Read More

OPEC August 2020 Oil Production

All OPEC data below is from the September OPEC Monthly Oil Market Report. The data is through August 2020 and is in thousand barrels per day.

NOTE: This new theme is screwing up the size of my charts. It seems it has a size threshold where they have to be slightly larger than my input charts to show up larger. I will have it fixed by next my next post where all the charts show up larger.

OPEC 13 crude only production was up 763,000 barrels per day in August. However, that was after June production was revised upward by 50,000 barrels per day and July production was revised upward by 110,000 barrels per day.

This is the data used in the charts below. It is basically a composite of reports by several production tracking agencies.

Read More