Comments not related to oil or natural gas production in this thread please. Thanks.
June Non-OPEC and World Oil Production
By Ovi
This month’s report is a shorter version of previous posts because the EIA’s International Energy Statistics update for June is not available. Information from other sources such as OPEC, the STEO and country specific sites such as Brazil, Norway and China is used to provide a short term outlook for future output and direction for a few of these countries and the world.
Where STEO data was used, the ratio of C + C to All Liquids was calculated. The average for the last four months was used to project June, July and August production for a few countries.
World oil production and projection charts are presented at the end of this post.
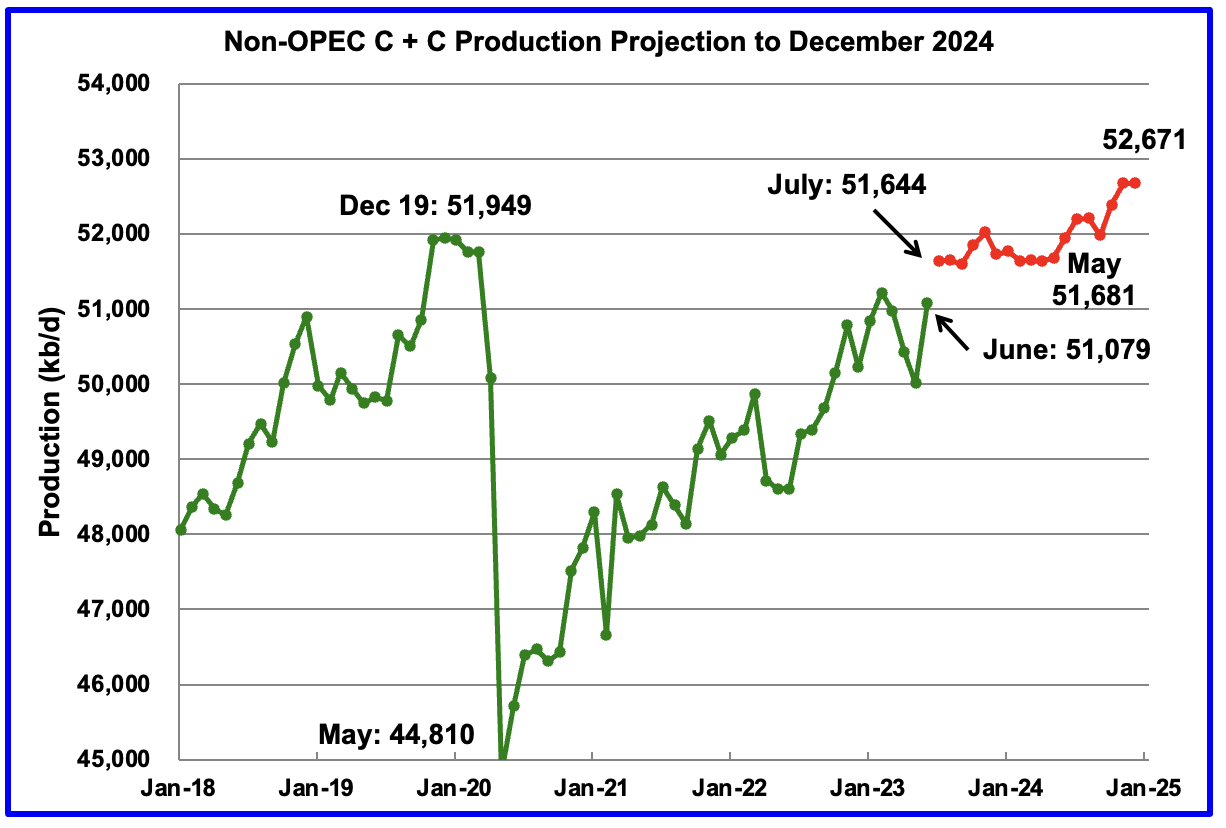
The October STEO is projecting June Non-OPEC oil production to increase by 1,069 kb/d to 51,079 kb/d. Close to 500 kb/d of that increase is associated with the upward revision of Russian output from last month. In the previous EIA May report, Russian condensate was not included in Russian production.
Read MoreOpen Thread Non-Petroleum, Oct 12, 2023
Comments not related to Oil or Natural Gas production in this thread please. Thank you.
Read MoreUS July Oil Production Rises on Texas & GOM Jump
By Ovi
All of the Crude plus Condensate (C + C) production data for the US state charts comes from the EIAʼs Petroleum Supply monthly PSM which provides updated information up to July 2023.
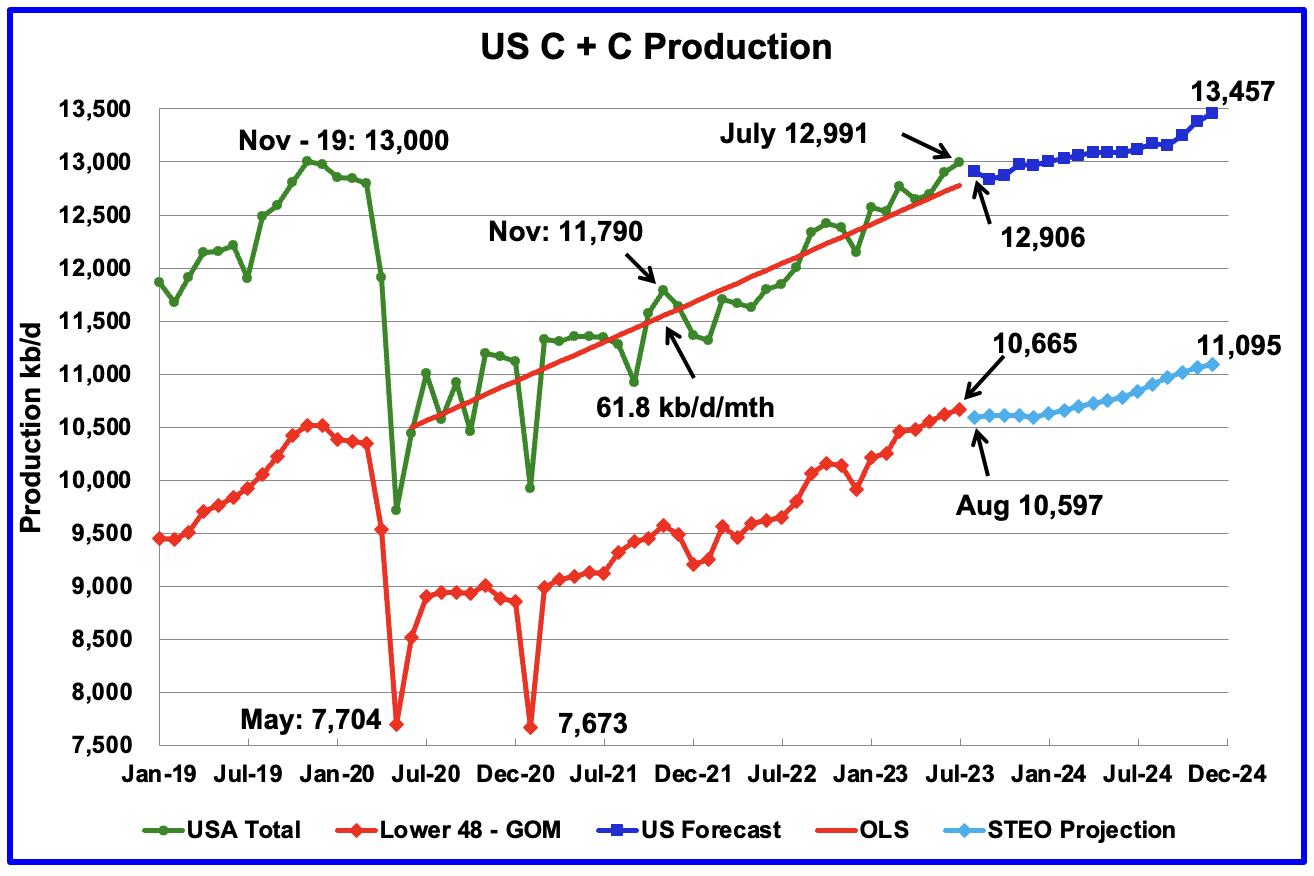
U.S. July oil production increased by 91 kb/d to 12,991 kb/d. The large increase was primarily due to a 73 kb/d increase in the GOM and a 72 kb/d increase in Texas.
The dark blue graph, taken from the September 2023 STEO, is the forecast for U.S. oil production from August 2023 to December 2024. Output for December 2024 is expected to be 13,457 kb/d which is 457 kb/d higher than the November 2019 peak of 13,000 kb/d.
Read MoreOpen Thread Non-Petroleum, Oct 4, 2023
Comments not related to Oil or Natural Gas production in this thread please. Thank you.
Read More