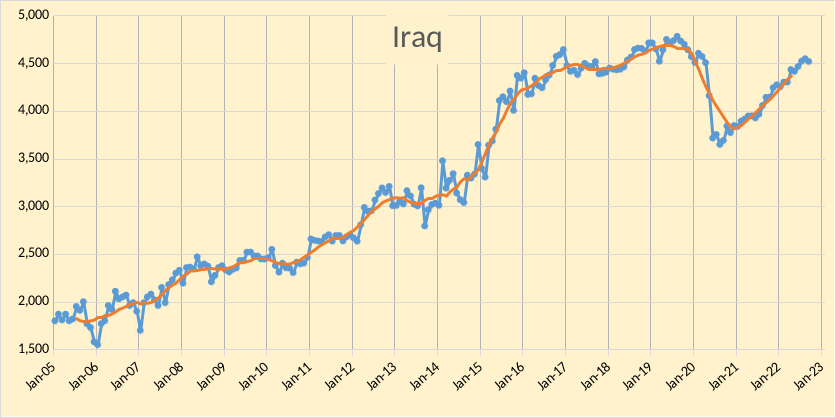
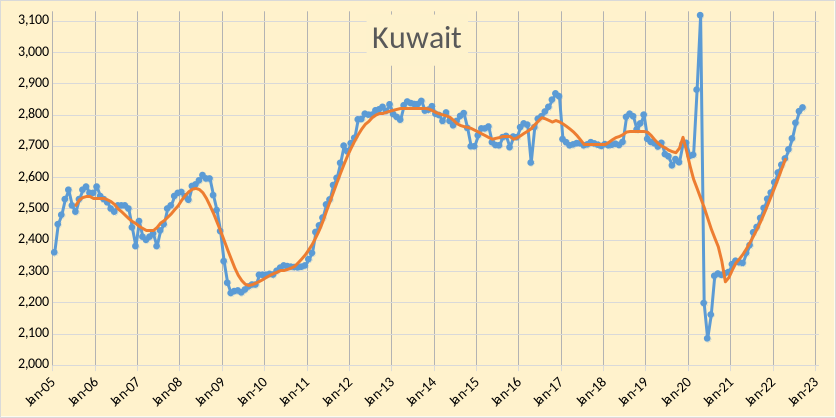
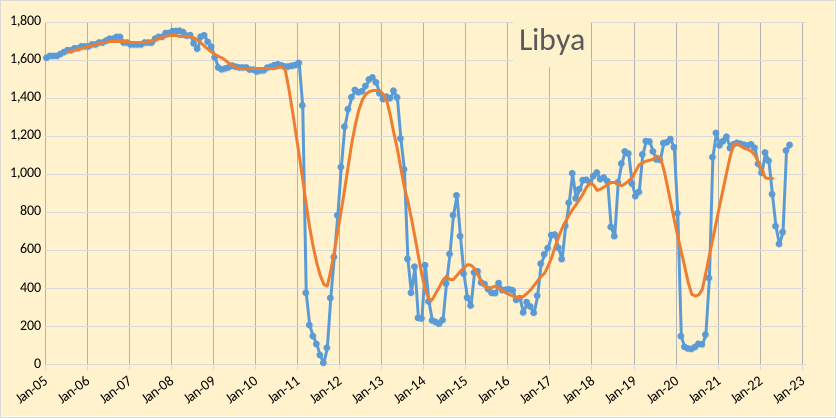
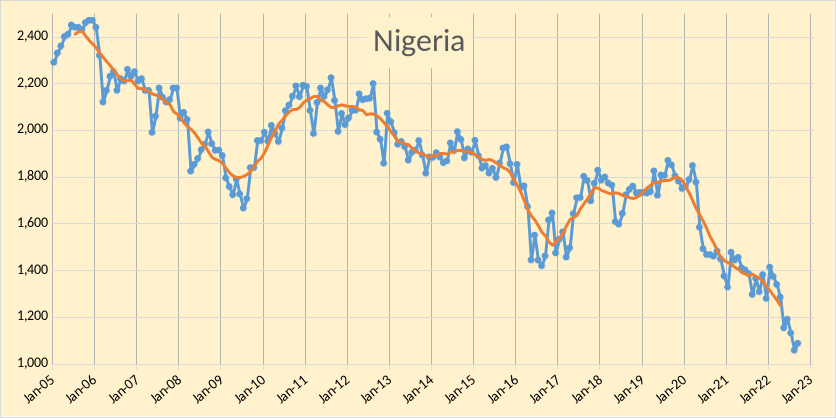
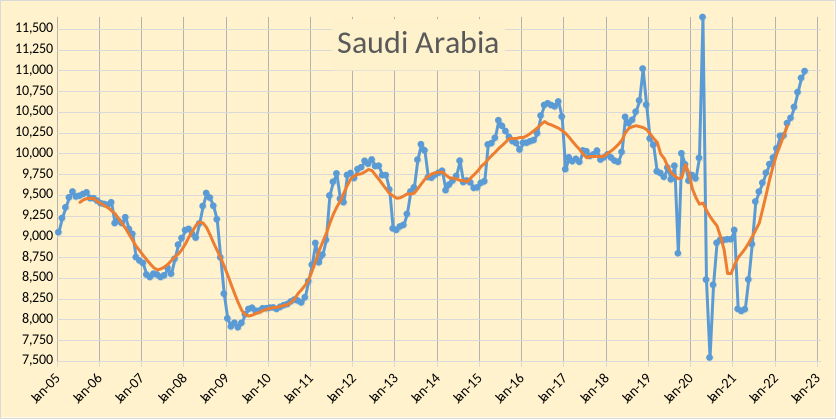
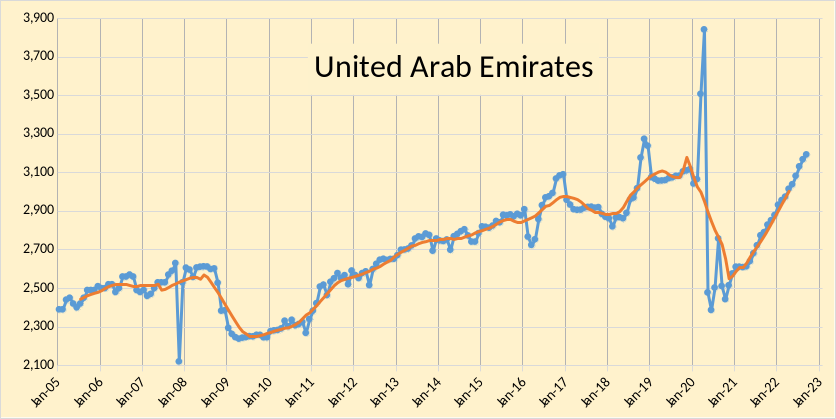
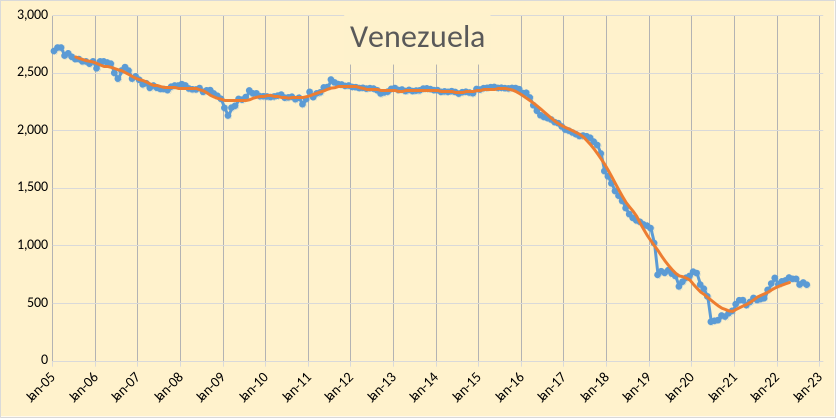
The OPEC Monthly Oil Market Report (MOMR) for October 2022 was published recently. The last month reported in most of the OPEC charts that follow is September 2022 and output reported for OPEC nations is crude oil output in thousands of barrels per day (kb/d). In most of the OPEC charts that follow the blue line is monthly output and the red line is the centered twelve month average (CTMA) output. Note however there are a few exceptions to this for OPEC+ charts near the end of the post where EIA C+C data was used which has the most recent data from June 2022 (so three months behind the OPEC crude only data in most of the charts that follow.)
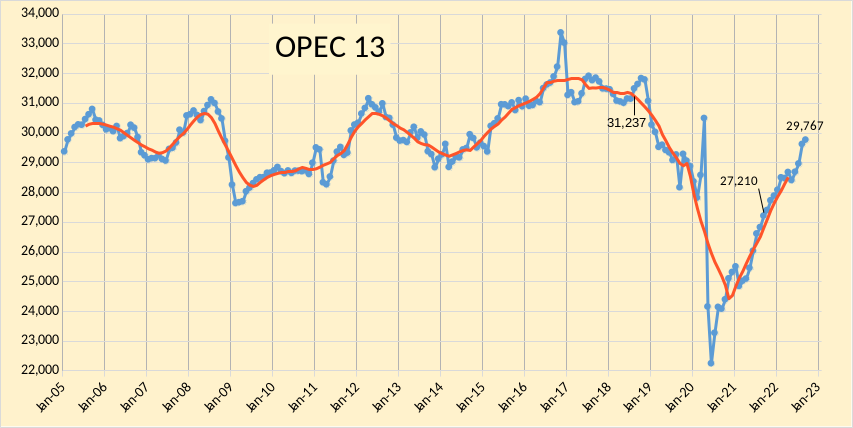
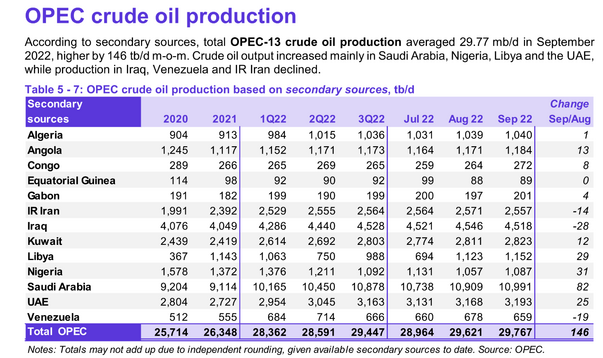
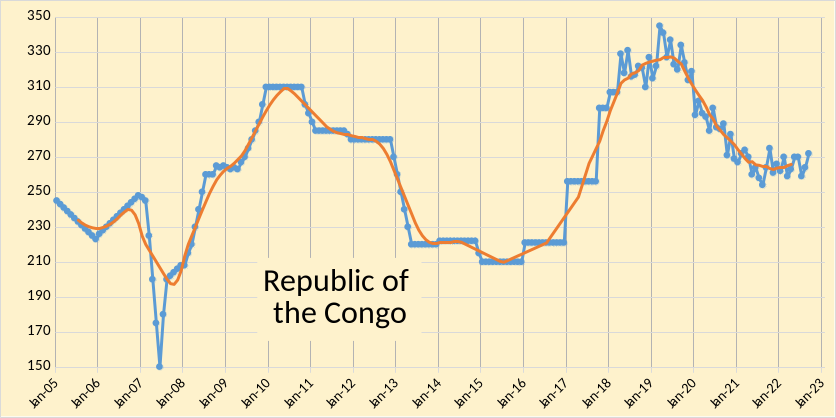
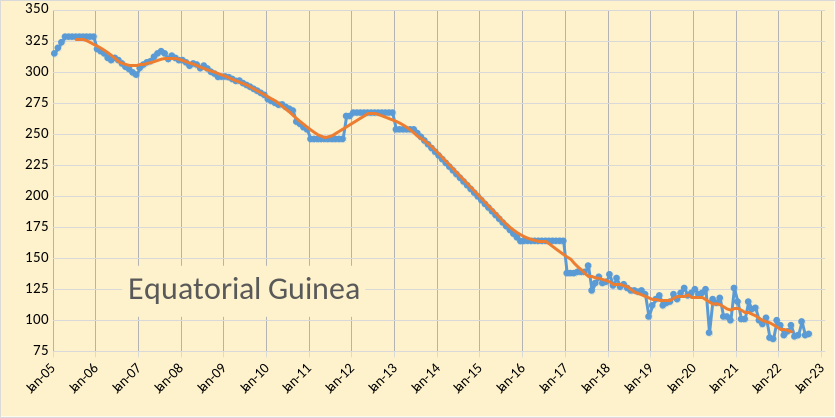
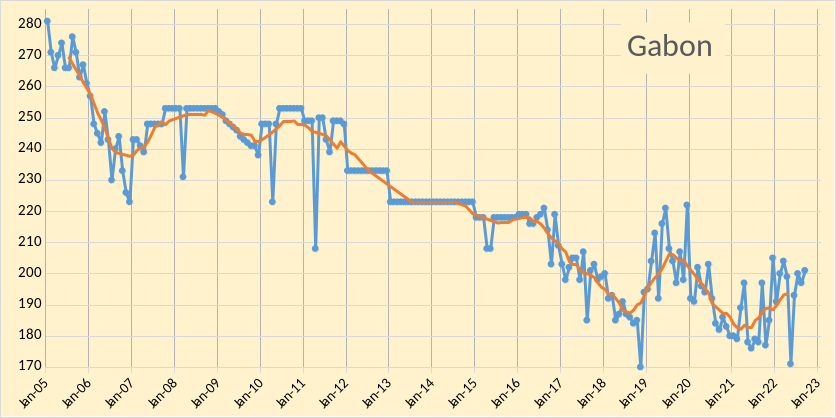
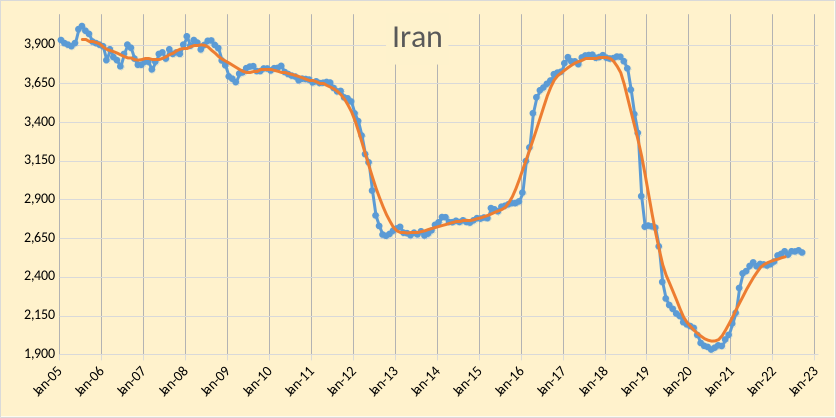
OPEC crude output was revised lower in August 2022 by 30 kb/d compared to last month’s report and July 2022 OPEC crude output also revised down by 69 kb/d. OPEC output has increased by 1884 kb/d since December 2021 and by about 4000 kb/d above the average level in 2021.
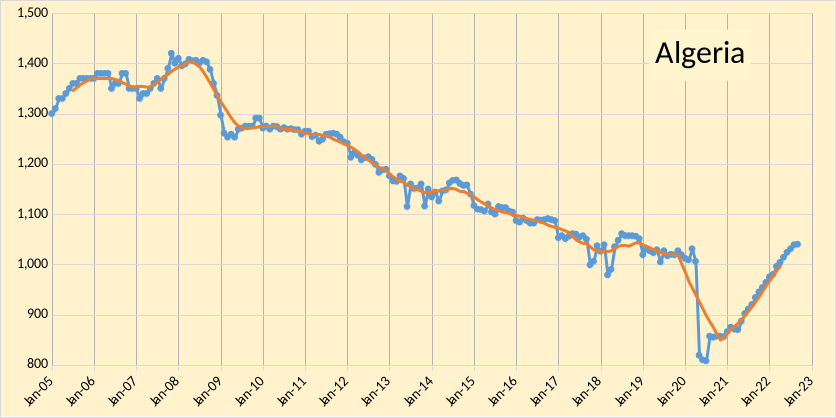
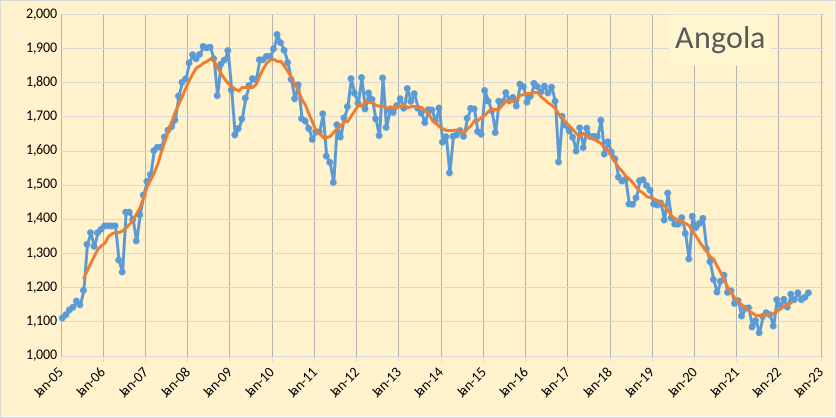
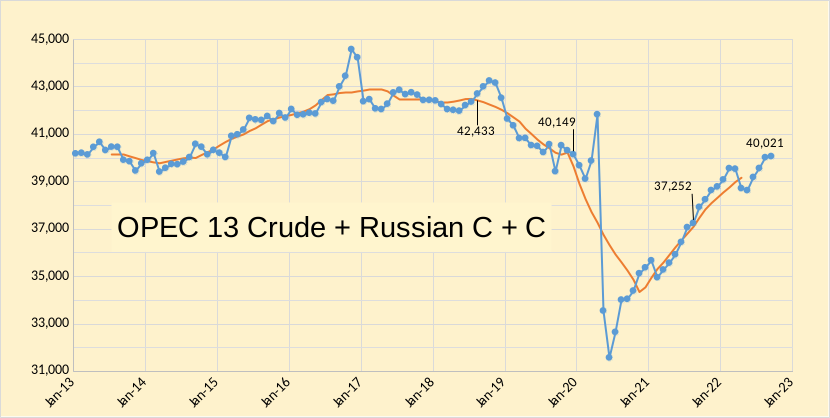
In the chart below we have Russian C + C and OPEC crude oil output. Output in Septembe 2022 was 2366 kb/d below the centered 12 month average (CTMA) in August 2018 of 42,433 kb/d (when the World CTMA of C+C output was at its peak.)
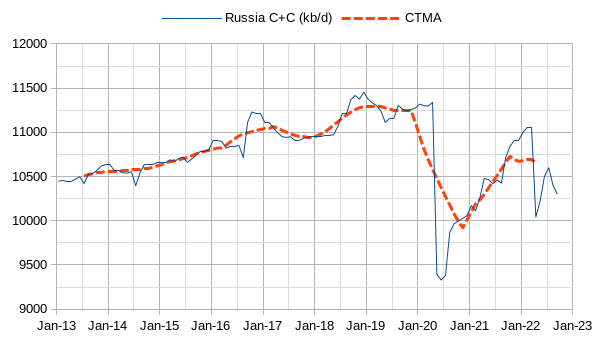
The chart below shows Russian output based on recent OPEC estimates and news reports. The preliminary estimate is 10.3 Mb/d for September 2022 and 10.4 Mb/d for August 2022.
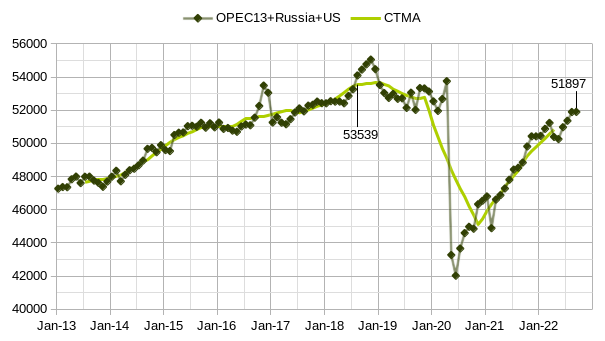
In the chart that follows, I used Short Term Energy Outlook estimates by the US EIA for US C+C output in August and September. Output for OPEC13 crude + Russian C+C + US C+C was 1642 kb/d below the level at the World centered twelve month average (CTMA) peak in August 2018 of 53539 kb/d for these 15 nations.
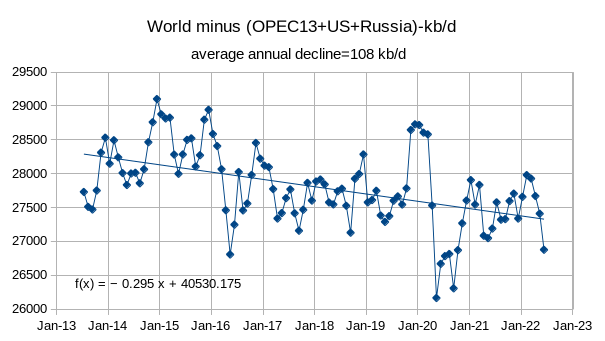
If we consider the World C+C minus the sum of OPEC13 crude and US and Russian C+C the annual rate of decline is 0.295 times 365.25 days or 108 kb/d per year for the period from July 2013 to June 2022, this chart uses EIA data.
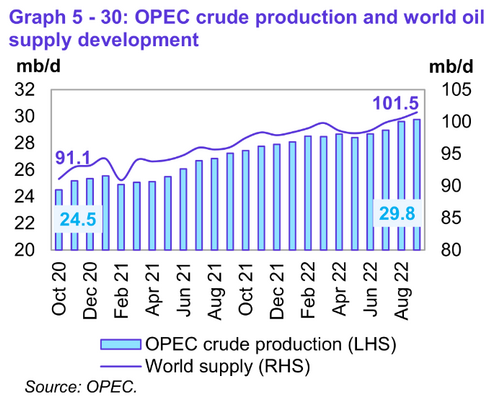
World liquids supply was 10.4 Mb/d higher than 2 years ago, OPEC crude output accounted for 5.3 Mb/d of this increase (51%).


With revisions to the balance of supply and demand, it may be that OPEC can meet the call on OPEC for 2023Q4, even if they cannot, the call on OPEC for all of 2023 may be able to be met as OPEC produced that level of output for 2022Q3. Also, looking at the level of OPEC crude needed for the next 6 months (based on the OPEC forecast) it is clear that lower output was needed, this is the reason for the voluntary cuts in November and December. Note that OPEC nations are free to ignore “voluntary” cuts in output, they are largely symbolic.
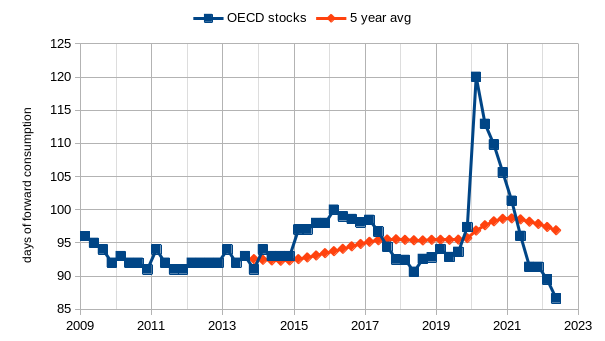
OECD stocks (commercial stocks plus SPR) have remained at very low levels at 87 days of forward consumption, this is lower than at any time since 2009Q1, with the lowest level from 2009 to 2019 being 91 days several times in 2010, 2011, 2013, and 2018. Stock levels this low suggest high oil prices in the future.
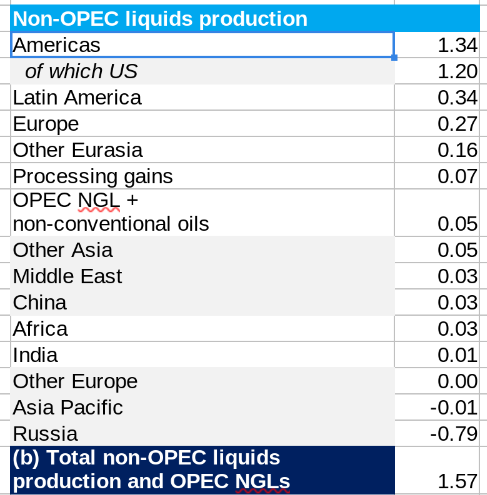
In figure 11 above I show OPEC’s estimate of the liquids increase in Mb/d from 2022 to 2023. OPEC expects (see figure 9 above) World liquids demand to increase by 2.34 Mb/d from 2022 to 2023 (change in annual average demand for liquids). The ratio of World C+C to World liquids, based on the past 12 month average of EIA data (July 2021 to June 2022) was about 80.64% and if we assume this ratio is roughly correct for 2022 and 2023, then World C+C would be approximately 80.4 Mb for 2022 (annual average rate) and about 82.3 in 2023. For comparison the EIA in its latest STEO estimates about 101.03 of liquids output in 2023 which would be about 81.47 Mb/d of C+C output, for 2022 the estimate by the EIA is about 99.55 Mb/d of total liquids or 80.28 kb/d of C+C. An alternative estimate looks at the trend of non crude plus condensate liquids and estimates that for 2022 this will average 19.57 Mb/d and in 2023 the average will be 20.12 Mb/d. These estimates are deducted from the OPEC and EIA total liquids estimates in 2022 and 2023 to arrive at at the following C+C estimates:
OPEC 80.17 Mb/d for 2022 and 81.90 Mb/d in 2023
EIA 80.05 Mb/d for 2022 and 80.91 Mb/d in 2023
Lastly we take a quick look at OPEC+ and US C+C output using EIA data through June 2022
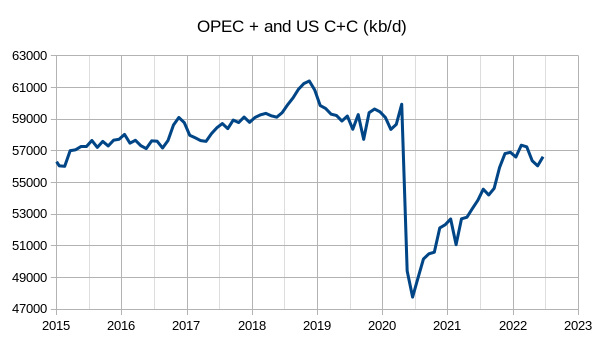
The average annual increase in output for the US + OPEC+ from Jan 2015 to Dec 2019 was about 647 kb/d. In June 2022 output was about 2750 kb/d below the CTMA peak in August 2018, in the past 3 months OPEC 13, US and Russian output rose by about 900 kb/d so for September 2022 the output may be about 1850 kb/d below the 12 month average peak (this assumes the 9 other nations of the DOC has flat output from June to September of 2022, which is likely to be incorrect).
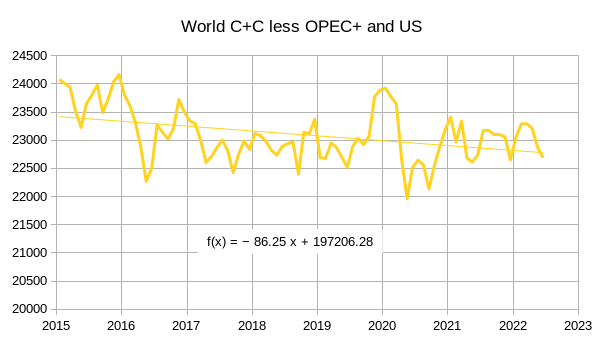
The annual decline rate for World C+C minus the sum of US + OPEC+ C+C output from Jan 2015 to June 2022 is about 86 Mb/d.
Nice work Dennis! Here’s the comment I just posted in the previous thread, some food for thought…
Here’s an interesting look at the top 11 oil exporters, some have faded away (Nigeria, Angola), while others have have generally held their ground. Only country to grow significantly is Brazil. What is impressive is that in <10 years the peak value of their oil exports has dropped 50% from ~$1.4 Trillion in 2012 to ~0.7 Trillion in 2021. Role of the US shale oil likely playing a big part, peak oil also expected to play some type of role.
For almost all of the exporters, their fiscal deficits turn sharply negative after the 2012 timeframe, clearly they are not getting the price they need for their oil.
In contrast, US deficit fell from -13% in 2009 to a low of -3.5% in 2015.
It's very clear that peak oil covers a time period of ~2005 – ~2015, from a financial and production standpoint, I don't believe these top 11 exporters will get back to 50 MBpD.
In fact, 2022 estimates suggest a drop of between 5-10% for this group from 2021 (maybe Ovi/Dennis/Ron can check this, seems pretty high!).
Kengeo,
Thanks.
The US had much lower net imports of crude oil in 2021 (3151 kb/d) compared to 2005 to 2007 when net imports of crude oil was about 10,000 kb/d. Of course oil prices make a big difference in revenue from exports, and the falling oil prices were due to oversupply (from 2015 to 2019) which is not a peak oil phenomenon, besically if we are talking about peak supply we would expect rising prices.
Also note the the only time in recent history (past 60 years) we saw a crash in oil production similar to the pandemic was after 1980 due to the Iran/Iraq war. It wasn’t until 1989 that annual output reached the level of 1980. From the bottom in 1983, ot was 6 years until a new peak was reached in 1989. In this case I expect by 2025 or 2026 we will have reached a new 12 month average peak of more than 83 Mb/d and I expect the final peak will be 85 Mb/d plus or minus 1 Mb/d in 2030 plus or mius one year for World C plus C output. Of course the odds are low that I will be correct.
Dennis –
Understood, so the negative impact to oil prices caused the bulk of the deficits in the Export-11 countries?
When do you expect the Export-11 group to reclaim 50 MBpD? It sounds like you are under the impression that 2016 drop in production of conventional oil is related to price alone rather than other factors (geology, natural decline, politics)? I thought there was general consensus that conventional resources peaked in last ~10-15 years or so (in fact I think a 74 MBpD plateau is apparent from ~2005-2015)? If you see future growth for Export-11 group, what’s your best guess?
Note that conventional crude fell below 70 MBpD in 2019, pricing in 2019 was also more favorable than the 2015-2017 timeframe. I think 2022 will go down in the record books as the most profitable year for major exporters, will be interesting to see how much it ends up being. Along the same lines, we should expect to see production increase in all countries where they have any spare capacity.
If decline is coming like I think it is, we will see major increases in decline rates, hitting at least 3% globally by 2025, if not sooner.
I would like to hear comments regarding the floor the Biden Administration proposed today via CNBC. I think it is very unlikely that this so called “floor” incentivizes companies to go out and drill more in the U.S. At $67 per barrel with today’s costs, the Shale Wells border on being uneconomic at current costs. I just saw an AFE for a 15,000 foot lateral Haynesville well at $23,000,000. With current gas prices, the IRR is not very enticing for the risk.
LTO Survivor
Here is a simple minded explanation that may reflect the knowledge of Biden’s advisors on this issue.
Somebody looked up the futures contracts and said, this table shows the price of WTI two years from now will be $70/b. Let’s guarantee the drillers $67/b to $72/b.
Today’s settled price in the right hand column.
LTO Survivor,
At that cost per foot it would be 15 million for 10k lateral typical in the Permian.
Is that a typical cost per foot these days?
snicker snicker
And the moon is made of green cheese.
Reservegrowthrulz,
I typically use full well cost (including overhead for the well facilities and land cost) and in 2019 was using 10.5 million for average Permian well capital cost, I have heard costs have increased by at least 30%, which would bring well cost up to around 13 million, I don’t look at AFE’s like Mike Shellman and LTO Survivor, so I don’t know what current rates are.
My input:
If the wells are drilled then price is less important, minimum breakeven for an existing well is ~$30, double that to put a well in and likely at least $75-80 if it’s shale/horizontal drilling. ~3 years ago breakeven was only ~$50. Compared to the major exporters, US breakeven is competitive – even at the low end of the top producers. Biden is wishful thinking, too much demand and limited supply to see any downward pressure on prices, more likely continued upward pressure. Seems like $95 plus/minus $25 is a very reasonable estimate for next 12 months, should keep supply up, may keep demand slightly muffled (which is a good thing as market is undersupplied).
Kengeo,
One needs to look at full well cost, breakeven does not get it done. Nobody is going to drill a well to get a 10% annual IRR, not worth the risk. An IRR of 30% to 40% is needed to incentivize a high risk enterprise like oil production. At least $80/b at wellhead and $4/Mcf for nat gas would be needed for an average Permian basin well to be considered. LTO survivor could give a more realistic estimate, mine is probably too low.
Dennis, I would recommend that you rethink the lack of value of a IRR=10% being insufficient. If only because I can identify most every well drilled in the major plays that failed that metric, or not, and while companies might need to claim a 30-40% IRR to shine on the money, anyone with a brain and a calculator can disprove it, let alone the idea that engineers don’t get the chance to claim 30-40% IRR, fail, and do it again.
Reservegrowthrulz,
The bar is set for the average well completed, some wells will be better than average and most will be worse, if we assume a lognormal distribution.
Would you invest in an oil company with a ROC of 10%?
That would be dumb, you could do just as well with less risk buying an ETF matching the S&P500.
Thank you Dennis for this insightful post. As I use to simplify to enhance the contours of the big picture, I would say that OPEC+ and US C+C are now 2mb/d below their plateau of 59mb/d (with the exception of the late November peak of 2018). And the slow but steady decline of the other countries won’t make a high secondary peak easier to achieve in the future. So it depends all on the big players: USA, Russia, SA. As SA has at least plateaued, and Rusia has peaked (with the additional weight of sanctions), it all depends on the US. While I stick rather to Ron’s predictions, I also have your perspective, Dennis, in mind. In the end, much, if not all, is dialectic …
Westtexasfanclub,
We will probably see increased output from Canada, Brazil, Norway, UAE, Iraq, Guyana, and Argentina as well. China may be working on tight oil and if they are successful might increase as well and may transfer their technology to Russia who might also develop tight oil, much depends on the price of oil. If demand starts to wane die to transition to electric land transport (or non-crude as biofuels and natural gas could also be used to power vehicles), The speed of the transition to BEVs in the future is unknown, my best guess is that by 2035 demand will fall below supply.
Consider EIA’s IEO 2021
https://www.eia.gov/outlooks/aeo/data/browser/#/?id=21-IEO2021®ion=0-0&cases=Reference&start=2018&end=2030&f=A&linechart=Reference-d210719.29-21-IEO2021&ctype=linechart&chartindexed=1&sourcekey=0
Dennis,
That EIA IEO forecast is a ridiculous. Might as well extend the line to infinity and get infinite oil production. Maybe they get paid to be consistently optimistic with lazy projections.
Iron Mike,
I agree especially after 2030, up to 2030 it looks reasonable, after that I believe they are too optimistic on tight oil output.
If memory serves, the EIA is about the only group left that came out of the idiot-oilers phase of 2002-2010 with a standing global peak oil claim not discredited by reality yet…2037 perhaps? They might be wrong with year/year estimates nowadays (along with most probably), but they sure aren’t so ignorant as to have fallen for the nonsense pumped out during the first decade of this century by others. There are other, more interesting, tidbits when examining EIA IEO data than near term effects. I am surprised they haven’t been noticed.
Reservegrowthrulz,
Perhaps you could enlighten us.
Reservegrowthrulz,
EIA IEO 2002 had World oil output (all liquids) at 118 Mb/d in 2020 for their reference case, the World peak thus far is under 101 Mb/d for any 12 month period. They also had oil prices at $25/bo on 2000 $, which amazingly was roughly correct due to the pandemic, but at that oil price output was 94 Mb/d in 2020, about 24 Mb/d less than the EIA’s reference case.
They have Russia averaging 10,831 Kbp/d in 2022, about half a million barrels per day above their average through June. Then they have them declining by about 100 Kbp/d until they reach 10.1 million barrels per day in 2029. Even their own STEO has Russia at about 1.25 million barrels per day below that level by February of 2023. This report makes no sense at all. Do those guys at the EIA even talk to each other?
Click on chart to enlarge.
Ron,
The projection was done in 2021, it will be updated in 2023.
Dennis – If I’m reading that correctly, no new peak for at least 3-4 years? That seems like a new world peak can’t possibly occur, right???
Kengeo,
No, it shows that it will take 4 years to recover from a steep drop in output, that last time we saw such a big drop (1979 to 1983), it took over 10 years to reach an output level above the previous 12 month peak. So this time it happens more quickly, if the EIA’s IEO 2021 estimate is correct.
Dennis
The Brazil National Petroleum association is back online updating production. July reversed the downtrend that Brazil was in since January 2020. The June 2020 low was 2,829 kb/d. Note the steady drop in each succeeding lower high since January 2020. September came in at 3,148 kb/d.
No, you will not see increasing output from Canada. There is not enough natural gas available to generate the steam necessary to separate the bitumen from the sand.
Mike,
My estimate is based on what the Canadian Energy Regulator forecasts.
https://www.cer-rec.gc.ca/en/data-analysis/canada-energy-future/2021/key-findings.html#kf5
Perhaps they are wrong, forecasts of the future often are.
Westexasfanclub
In your comment above you mention a Secondary peak. I think you are one peak behind. The second peak occurred in November 2019, see attached chart. What I think we are looking for is the third peak which I believe happened this past September, which unfortunately won’t be reported by the EIA until January 2023.
In the chart, the projected September peak for C plus C is close to 2,800 kb/d higher than June. Of that 2,800 kb/d, 1,100 to 1,200 kb/d will be made up by OPEC, based on the latest September and October OPEC reports. There are big rebounds associated with summer maintenance in Brazil, Norway and Kazakhstan that are close to 1,000 kb/d. Also US production should have increased by September. So the 2,800 kb/d will be close to achievable.
I also note in Dennis’ post, Figure 7 shows all liquids are at a new high for September. Also here is a statement from the IEA that implies that September or possibly October could be a new high since OPEC will be cutting back.
“World oil supply rose by 300 kb/d in September to 101.2 mb/d, with OPEC providing over 85% of the gains. After a massive 2.1 mb/d boost from 2Q22 to 3Q22, growth is forecast to decelerate markedly, to 170 kb/d from 3Q22 to 4Q22, following the OPEC decision to cut official production targets by 2 mb/d from November – a 1 mb/d cut to actual output given the bloc’s underperformance vis-à-vis quotas.”
Also in January, the STEO will extend its forecast production out to 2024. That should give us a good idea whether oil production will be able to recover in 2024 and beyond. With decline in the range of 600 kb/d to 750 kb/d, it makes it all the more difficult to increase production significantly beyond 2024. More than likely a plateau is what we will see.
Ovi, if you count all the ups and downs as a peak, you’re certainly right. For me, there is an era before April 2020 and after, while the all time peak is November 2018. I agree that September 2022 looks like the post pandemic peak. I also agree that depletion combined with a looming recession will make another high more difficult as time goes by. Maybe you’re a little bit too optimistic about the GOM September production, because there was at least one mayor hurricane in that month. I suppose when the red line turns green, it will look similar, but altogether several hundred thousand barrels lower.
Westexasfanclub
When I said that US production should be up in September I recalled the September hurricane. Since it moved close to the Florida coast I thought that maybe the hit on output would only be around 100 kb/d, averaged over the whole month.
I will be curious to see where September is when the EIA reports in January.
Ovi,
It would be interesting to dig up your spreadsheet from October 2021 with STEO projections for World crude and compare with actual output. The EIA was quite a bit more optimistic a year ago for Dec 2022, probably because the Ukraine war was unforeseen.
See image below from
https://peakoilbarrel.com/non-opec-june-oil-production-has-small-increase/
Ovi,
I noticed that the World real GDP annual growth estimate for 2023 was 4% in Feb 2022, STEO and by October 2022 the estimate had been reduced to 2.2%,
Dennis
Attached is a chart that adds the real C plus C data to the chart shown above. The real data is in blue. The general trend is good up to March 2020 which is almost spot on. Then the war hit and the price of oil spiked and demand dropped. The average error from July to March is 580 kb/d, 0.72%, and in general too high.
I will review the procedure to see if I can identify why the forecast is biased to the high side.
With regard to GDP being lower, that is why I think the latest projection reflects lower demand and is not related to pumping capacity. The world needs to get back to a high demand scenario to see if there is sufficient capacity to meet it.
Ovi,
Thanks for the chart, exactly what I was thinking of.
I agree, the slower GDP growth would result in lower consumption of crude oil as these are correlated quite well historically. From 1983 to 2004 World oil production rose by about 680 kb/d on average for each one trillion dollar rise in World real GDP (2015 US$, market exchange rates) and from 2007 to 2018 the corresponding increase was about 478 kb/d for each one trillion increase in real GDP.
The change in slope was a decrease of about 70% and if we assume a similar decrease post pandemic, the rate of increase might be about 339 kb/d for each 1 trillion increase in World real GDP (2015 $). Using this 339 kb/d estimate and assuming 3.5% World real GDP annual growth in 2022 and then either 2.2% growth (October STEO estimate) in 2023 or 4% growth in 2023(from Feb 2022 STEO estimate), the growth in World C plus C output would be about 670 kb/d in 2023 for the low GDP growth case (2.2%) and about 1216 kb/d in the higher GDP growth case (4%).
Ovi, I am curious. How do you convert the EIA’s “Petroleum and Other Liquids” data to C+C?
Ron
I will send you a private email.
A chart of World real GDP vs oil production for 1983 to 2004.
Interesting chart Dennis.
I’m guessing the real GDP vs global electricity production chart would look similar.
chart of global electricity production by source from 1985
Thanks Hickory,
Yes I imagine energy consumption correlates very strongly with real GDP and is probably the best metric as we will see substitution between different types of energy as relative prices change.
Hi everyone, I’m inserting my comment here at the start of this thread which is discussing the link between FF volumes and GDP. I would like to open up the discussion about GDP as an essential metric of standard of living/quality of life/happiness, etc. If we need to replace almost all FF in the next decade or so as Climate Scientists are saying, and if RE can only replace 25-50% of that energy use, what is left to do? Clearly, conservation/efficiency, which almost never gets discussed, is an easy target for replacing perhaps half of our FF use. I’m reminded that we, in the US, use about double the amount of energy today as we did in 1970 per capita. Our houses are twice as big and house half as many people too.
My wife and I are a bit old school, having grown up poor but have accumulated way more retirement funds than we need. We have hosted a half dozen 20-30 year olds doing service work over the last 5 years and we are always astounded at their assumptions about lifestyle, consumption, travel, etc. They clearly grew up in the period of peak FF/easy money. I worry about them and about our kids and grandkids as the economy and the energy system goes through increasingly rapid and radical adjustments. If I could give them any lessons, it would be to learn to think broadly, learn to problem solve, learn to work at a wide range of skills and to be happy with the simpler things in life.
I hope we can learn to treat energy as a precious commodity that needs to be used as sparingly as possible.
Jim Baerg,
If we look at US primary energy consumption per capita it was less in 2021 than in 1970. I agree that the US could do much better, Europe on average in 2018 used 128 GJ/person vs 294 GJ/person in the US based on BP Statistical Review of World Energy Data (see link below for data).
https://www.bp.com/en/global/corporate/energy-economics/statistical-review-of-world-energy.html
For the World as a whole the average primary energy consumption was 76.3 GJ/person in 2018 and that was the peak year over the 1965 to 2021 period for the World per capita energy use. The peak per capta primary energy consumption for Europe was 1988 at 146.6 GJ/person and for the US the peak was in 1979 at 341.8 GJ/person.
“I hope we can learn to treat energy as a precious commodity that needs to be used as sparingly as possible.”
We will move in that direction one way or another. Probably the hard way.
A second chart showing 2007 to 2018 trend for World real GDP vs C plus C output.
Dennis
My sense has always been, without proof, that the increase in oil demand is around half of GDP growth on a percentage basis.
Looking at you chart, over the range 70 to 80 on GDP, crude output increases by close to 5 Mb/d. 5/77= 6.5%. On GDP 10/70 = 14.3%. 6.5/14.3 = 0.46
So as a quick estimate using half is not a bad estimate.
Ovi,
Also in absolute terms when using trillions of real GDP in 2015 $ and oil in Mb/d, it is also about 0.5 Mb/d increase in average annual C plus C output for each one trillion $ change in real GDP, at least for the 2007 to 2018 period. So yes a pretty good rule of thumb for the past 20 years before the pandemic. It will be interesting to see if this changes post pandemic, at this point I don’t think we have enough data to really know if there has been any change.
There’re a lot of good articles at The Surplus Energy Economics site concerning the interrelation of economic growth and energy, including the effects of debt and energy cost of energy (equivalent to ERoI). This recent summary is especially apposite and cogent: https://surplusenergyeconomics.wordpress.com
Some quotes:
“Critically, the calculated expansion in C-GDP [stripping out debt] (of 114%) tallies almost exactly with the increase in energy consumption (112%) over this forty-year period. Put another way, the relationship between underlying economic output and the use of energy is linear.
“In short, if we consume less energy, the economy gets smaller. Likewise, if we use less energy per capita, the average person gets poorer.
“These are important points, because it’s all too easy to assume that the economy can transition, seamlessly, from fossil fuels to renewables. This mistaken assumption – and it’s no more than that – informs vast swathes of corporate, financial and government planning.
“At no point since 1776 – not even during the Great Depression between the wars, which caused severe hardship, but was temporary – have we ever had to confront anything even remotely comparable.”
From Georges quoted article-
““In short, if we consume less energy, the economy gets smaller. Likewise, if we use less energy per capita, the average person gets poorer.
These are important points, because it’s all too easy to assume that the economy can transition, seamlessly, from fossil fuels to renewables.”
It is a naive notion to think that the world can ‘seamlessly’ transition from the great reliance on oil, gas and coal. As I see it, the best we could hope and work for is a partial replacement of energy as the fossil fuels deplete.
Its a mater of degree and timing and purpose- too late, too weak of an effort, and a task which fails to confront the idea that humanity has grown far too big.
I would have preferred to live in a world where the retreat was gradual and managed, with proactive steps taken to address the pending decline in fossil energy beginning when it was first obvious that the trend reversal was approaching [1970’s], but that reality and message was met by a grand effort in denial by most of humanity.
The current efforts to diversify energy production are far too late to achieve the ‘seamlessly’ goal.
And the idea that less energy means less prosperity, and within one or two generations will result in peak population is an idea that people need to begin to digest.
George,
Not clear why debt would be stripped out of an analysis. At the World level, if we assume no interplanetary lending for every liability there is a corresponding asset and on balance the sum is zero. In short debt is money owed to ourselves (where ourselves is the population of the World).
Dr Morgan studied philosphy and history at Cambridge.
https://www.gresham.ac.uk/speakers/dr-tim-morgan
Not much evidence of peer review for his model.
I thought Morgans article was an interesting read.
His rationale on solar and wind are based on fallacious evidence/arguments, however.
I could expound on that if anyone has interest.
Hickory,
He has interesting things to say, but on economics I prefer work that has undergone peer review. As far as I can tell, that is not the case for the SEEDS model. Note that when we look at energy consumed, some of it will have been used in the production of energy itself, the amount is notoriously difficult to assess and depends on the boundries of the analysis. What is actually known is the energy consumed, on “clean” GDP that reduces growth rates due to debt, as long as the system functions with existing debt, there is no need for such an adjustment. Much of the expansion in debt from 2011q4 to 2019Q4, was emerging economies getting better access to credit. There was an expansion of debt during the covid crisis as there should have been during a severe economic downturn.
Difficult to dig out the details of the analysis from the blog, we get comments such as I don’t want to reveal too much, a bit opaque.
Another way to look at World real GDP and oil is to make World oil output the independent variable and see how the natural log of World real GDP responds to changes in oil output. This measures how the rate of growth of World real GDP repondes to changes in oil output. For 1960 to 1980 we find that on average the slope of the curve is 0.023 which suggests that a 1 Mb/d change in oil output per year results in an average annual growth rate in real GDP of about 2.3%. Over this period the average annual growth of real GDP was about 5.1% which suggests oil output grew at about 2 Mb/d per year or more on average over that period.
For 1983-2018 we have chart below
From 2012 on OilPrice-
“Oil is too Precious to be Used as Transportation Fuel”-
An oil executive once observed that burning oil for energy is like burning Picassos for heat…
https://oilprice.com/Energy/Crude-Oil/Oil-is-too-Precious-to-be-Used-as-Transportation-Fuel.html
even more relevant now than it was one decade ago
Dennis
What this clearly shows is the strong linkage between GDP growth and C + C, which everybody on this board knows. How much of this can be replaced by wind and solar? I think maybe 25% to 35% over the next 50 years. Conservation that would lead to a lower standard of living would not be acceptable.
Hickory
Fifty years from now, our descendants will be cursing us? I still think that 1985 to 2005 were the golden years. Things are still pretty good but dawn in looming.
Ovi,
Yes, but notice that the linkage has changed from 1960-1980 vs 1983 to 2018. In the later period a 1 mbpd increase in oil output gives us 85% higher real GDP annual growth rates on average, Will this change in the future? My guess is yes, that we will see even higher growth for any increase or possibly the World economy becomes less linked to growth in oil output. The pandemic has brought big changes to the percentage of the workforce that can work remotely, also EVs may reduce demand for oil, along with more use of rail and EV heavy duty trucks for rail terminal to warehouses that deliver to consumers with EV vehicles.
It does not need to be solar and wind, it can be wind, solar, nuclear, natural gas, and coal that provides energy with wind, solar and nuclear gradually replacing coal first then natural gas over time.
“Fifty years from now, our descendants will be cursing us? ”
For many reasons-
being so wasteful with energy and with the environment,
and being so careless with the experiment in democracy
being among the big reasons.
btw- much of the world already is.
“Fifty years from now, our descendants will be cursing us? ”
Hint:
There is a possibility that there will be no descendants in 50 years, and that possibility in not minimal.
Considering total primary energy consumption and fossil fuel energy consumption (coal, oil, and natural gas) from 1965 to 1973 we see that about 98% of the percentage increase in energy consumption per year over that period was due to increased consumption of fossil fuels. The average annual rate of increase in fossil fuel consumption was 5.3% per year for fossil fuel vs 5.4%/year for total primary energy from 1965 to 1973.
When we consider the annual average growth rate of real GDP for the World from 1965 to 1973, it was about 4.98%/year. Thus for each 1% of World real GDP growth we needed 1.064%/year growth in fossil fuel consumption.
If we consider 2011 to 2019 we find that total primary energy grew at an average annual rate of 1.5% per year and fossil fuel energy grew at about 1.09% per year, while real GDP grew at 2.97% per year over this period. For each 1% of real GDP growth only about 0.37% growth in fossil fuel is needed.
Consider the average annual growth rate of renewable energy consumption from 2011 to 2021 at 11.8% per year (BP stats data). If we assume future growth in renewables continues at 11% per year until 2040 and that non-fossil fuel non-renewable consumption (this would be nuclear and hydropower energy) remains flat (a simplifying assumption), then fossil fuel consumption peaks in 2029 at 512.9 EJ if we also assume primary energy consumption continues to grow at about 1.5% per year (as it did from 2011 to 2019).
Chart below has the projection of fossil fuel consumption based on this set of assumptions.
The G7 price cap on Russian oil was formulated with the idea to keep Russian oil on the market to prevent a massive global oil price shock. The presumption was that Russia would be forced to sell at a tremendous discount to third-world countries . . . which would reduce funding for Putin’s war effort. The mandate for western Big Oil talent to unilaterally leave Sakhalin Island was intended to wreck new production in the exciting Russia Far East (which used to be Outer Manchuria).
Japan originally settled Sakhalin Island and has chased its oil since 1922. A consortium of Japanese companies own about 30% of both developments on Sakhalin. With Exxon and RDS gone, Japanese talent will make production sing. The fact that Japan is part of G7 is probably of secondary importance: Japan needs energy security and Sakhalin is their best shot at it.
Western Siberia is a mess. Jutting into the Kara Sea, both Yamal and Gydan infrastructure is sinking into the muck of global warming. Not only that but massive collections of methane hydrates are exploding the ground due to heat from the mantle. The wells empty into pipelines at a rate. There is no Cushing Hub to absorb excess–and if hundreds of thousands of old wells are shut in, they will forever be. But the Russians know how to run those things–just whack ’em with a pipe wrench and let ’em grind it out.
Russia’s only way out is to produce balls to the wall, every well that will pump, and to hire on the Japanese know-how to push Sakhalin. There will be a lot of tankers with the port call of “Destination Unknown” leaving Russian offloading piers, with plans to rendezvous with a half-filled tanker from somewhere else. India, China, Indonesia and Europe are all so hungry for hydrocarbons at this point that a lot of eyes are going to look the other way. Transshipment is a very large business. Urals Blend is going to wind up in many places, mixed in with Iranian crude–Putin has nurtured that relationship and is even using Iranian drones to hit Kiev.
Hard times are coming. Fast. Many people who rant about the evil of fossil fuels have no idea that their Tesla chassis was manufactured from petrochemicals or that their blood pressure medication was too. Harsh realities are about to knock on many doors. The truth is that Russia controls a massive amount of oil and gas. The Battle of Stalingrad was fought for Baku, the Black City, because Hitler was sure he couldn’t win the war without Baku oil. He was right. Once again, the Caspian Sea is in play–over whether to call it a lake or a sea, because how the oil is divvied up depends on the designation. Russia plies the Caspian Sea with a sizable flee–they’d like it all.
I don’t pretend to know what will happen other than where the rubber meets the road–profound scarcity of fuel, electricity, and end products from petrochemicals–nobody will really give a damn where the oil came from. I’m no fan of Putin, but this is a blip on the radar. The world needs Russian oil and Putin knows it. So does the EIA.
To me, this seems to be a realistic view, Gerry. The world isn’t in shape for a long energy war. Mankind should collectively focus on transition, including nuclear and Russian and Iranian fossile fuels, even fusion energy or whatever suits now or in the future. Germany for example was on a good track with renewables combined with Russian gas, even while the nuclear exit was probably Merkel’s most stupid decision. Now the green party wants to opt out of everything while pushing child labour in Africa and dangerous nuclear technology and war in eastern Europe. Ideologies just don’t work when you have to face reality.
Ron – Since we are approaching 4 years since the peak, other than the 70’s, has there ever been 4 consecutive years where oil production has been trending lower? My guess is no, but would be good to check. US production has essentially been flat in this high price environment, has that ever happened in past 10 years, my guess is no…
Well no, I don’t think there has ever been a four-year period of World decline. Of course, there have been even longer periods of US decline. It was only the shale revolution that reversed the US decline that started in the early 70s. However, the current World decline is an anomaly that happened because of the covid demand collapse.
I believe next year, 2023, will be the year that convinces almost everyone, that peak oil is in the past. I think prices will spike, but production will continue to decline.
Ron,
There have not been four years of decline, there was a low after the pandemic and then output has recovered. After the centered twelve month average (CTMA) peak in October 1979 at 63033 kb/d, it took almost 16 years until that CTMA peak was surpassed in September 1995. World C plus C output 12 month centered average output has been increasing since November 2020 from 73699 kb/d to 79167 kb/d in Jan 2022 based on EIA data.
Amazing, from 53 million barrels per day to 83 million barrels per day in less than 35 years. Almost one million barrels per day per year. The population explosion along with globalization caused it all. And of course, it could not have happened unless the oil was just there for the taking.
All that is about to change. And it will not be pretty.
“There have not been four years of decline” – check that statement for accuracy…
Take a look below, you can simply ignore the 2020 downturn and still see the decline rate of 1.1 MBpD each year, beginning in 2018…decline of this nature has not happened within the past 40+ years. Now if you remove North America’s contribution it becomes very clear. World Peak of 72.8 in 2016, 72.4 in 2017, 72.2 in 2018, 70.5 in 2019, and 65.9 in 2021. The one year drop from 2018-2019 amounts to nearly 2 MBpD.
Between 1983 and 2019 there were very few drops of 1.5 MBpD or more:
The only one in fact was between 2008-2009, almost 2 MBpD.
Looking at production growth over a four year period since 1983, excluding covid, there has only been one interval where production declined significantly over 4 years, guess which 4 years? Between 2015 and 2019 world production less North America declined by 1.5 MBpD. In 1990s, average 4 year growth rate was 4 MBpD (1 MBpD annually). In 2010s this dropped significantly, to only 1 MBpD every 4 years, then turning negative in 2018.
The last significant growth in production occured between 2014-2015, an increase of ~2 MBpD.
Covid can’t be blamed for the lack of production growth since 2018, especially when the top producers are near all time highs…
Prices are also very high, so can’t blame the lack of production on pricing…
Kengeo,
Your argument only holds water if you ignore the huge drop of 10% from 1979 to 1983, try again. The last time we had a global pandemic was 1918-1920, this does not happen on a regular basis.
Kengeo,
The decrease in output in 2019 was because OPEC cut production.
Also from June 2020 to Feb 2022 output was increasing not decreasing. It will take time to recover from the decreased output during the pandemic, the last time such a significant decrease in output occurred (1979 to 1983) it took nearly 16 years before the centered twelve month average output returned to the October 1979 peak. Three years is a relatively short period.
“The last time we had a global pandemic was 1918-1920, this does not happen on a regular basis.” ~ DC
Dennis, not to be pedantic, not my style, but the H1N1 influenza A pandemic of 1918–1920 (colloquially, but likely inaccurately, known as the Spanish flu) remains the deadliest pandemic of the modern age, but it was not the most recent one prior to COVID; see 1957–1958 Asian flu (H2N2); 1968–1969 Hong Kong flu; 2009 influenza A (swine flu); AIDS and Hepatitis B & C for example.
Whilst the data and philosophical underpinnings supporting a conclusion that an infection is either epidemic, pandemic or endemic can be a little fuzzy, I feel it’s worth recognizing the larger picture of contagious illness and it’s impact on people and the economy (aka the cost)
“By epidemic we actually mean a pandemic that no longer kills people in rich countries. By endemic we actually mean a disease the world could get rid of but hasn’t.”
https://www.statnews.com/2021/07/06/why-arent-diseases-like-hiv-and-malaria-which-still-kill-millions-of-people-a-year-called-pandemics/
Linked is a write up on the economic impact of AIDS.
https://www.news-medical.net/amp/health/The-Economic-Impacts-of-AIDS.aspx
SARS in 2003, MERS in 2012 and ongoing, COVID in 2019 and ongoing …. unsettling trend in corona virus evolution; give it a few years for the next one to pop up.
https://www.emro.who.int/pandemic-epidemic-diseases/outbreaks/index.html
As an evolutionary selection mechanism it seems contagious illnesses select, in part, for resources and ability to practice precautions and employ controls, like respiratory protective equipment.
Social distancing tip- picture the tallest dead person you know lying on the ground at your feet. That’s about the right distance.
New study suggests risk of extreme pandemics like COVID-19 could increase threefold in coming decades
https://www.pnas.org/doi/10.1073/pnas.2105482118
Survivalist,
Of the pandemics of the past 110 years, the 1918-1920 pandemic is most comparable to the covid19 pandemic in my opinion. I am not an epidemiologist so may be mistaken.
Kengeo,
The way you seem to define “4 years of decline”, there was a 15 year decline for the World centered twelve month average peak of C plus C output from October 1979 to October 1994. Most people would not ignore the obvious increase on output starting in June 2020 on your chart, if we consider the centered 12 month average output there is simply a steady increase from December 2020 to Jan 2021.
Ron,
The rate of increase from 1935 to 1975 was about 7% per year on average. The rate of growth for the 1983 to 2019 period was far slower( about 1.2% per year on average). I agree things may change when growth stops.
Ron —
On a wild guess, I would say there probably was a four year period of world decline about 1350, when the Black Death raged.
Another candidate might be about 1250, when Genghis Khan wiped out much of (Persian ) Central Asian civilization and western Chinese civilization. The Mongols thought land for grazing horses was more valuable than cities and agriculture. Whole provinces of China were converted. The Mongols bragged about wiping out entire cities and erecting pyramids of the skulls of the victims. The now mostly forgotten realm of Khwarezm, near the Aral Sea, almost completely disappeared. Baghdad, said to have been the world’s largest city at the time, was completely destroyed, and the populace wiped out in a planned multi-step genocide.
The Islamic Golden Age ended, and Islam has never really recovered. The region has mostly been ruled by various bands of turkic horsemen who came in to fill the void.
There is a lag time between investment and increased production. Investment
in oil extraction was very high from the mid 1970s to 1986 (offshore and
Alaska). The price of oil fell in 1986 and investment fell but the
infrastructure put in place during the investment boom allowed oil
extraction rates to increase through 1999. Investment increased at almost
11% per year between 2001 and 2014. In spite of this increased investment,
world oil extraction rates were essentially flat between 2005 and 2010.
Investment fell in 2015. By 2016, investment levels were back to roughly
2009-2010 levels, still way above 2005 levels. Extraction rates increased
till 2018, roughly flat in 2019. Covid hit in 2020 and investment levels
fell sharply, up only 8% in 2021.
I am actually surprised at the resilience of oil extraction given the
decreased investment since 2015.
1979 to 1985 is then excluded? Global peak in 1979 and drop was far worse than any/all of the peaks claimed/occurred this century.
Reservegrowthrulz,
He said 1979 to 1985 that extraction rates and investment was high.
In a short 3 month period, no drop has been worse since 1973 in percentage terms than the drop from March to June 2020, an annual rate of about 50% (15.8% drop over 3 months for World C plus C output.)
Dennis,
Thanks as always for the post.
What is your prediction of oil price range for the first quarter of next year in the scenario we tip into a global recession ?
Do you see a bottom in prices for that scenario ?
Iron Mike,
If the recession is fairly mild (2.7% annual World real GDP growth in 2023 as the IMF forecasted in Oct 2022), I expect oil prices to remain above $80/bo, if it is a deeper recession (2.2% annual World real GDP growth as the EIA predicts for 2023), perhaps oil prices will be as low as $75/bo in 2022 $ for Brent crude. Note that these low oil prices assume adequate production to meet consumption. Prices will be a function of both consumption and production of crude oil, my expectation is that production in the short term will be less than consumption unless there is a severe economic down turn and that prices are more likely to be above $90/bo rather than below for annual average prices for 2023, first quarter of 2023 will be a problem as Russian sanctions kick in and releases from SPR will need to cease, so prices would tend to be high, perhaps even $100/bo unless we see a Worldwide financial crisis this fall.
These scenarios above all presuppose no change in the violence in the world, a war in Ukraine that goes on without change, no further attacks on Abqaiq, Putin grinding away, no humanitarian threat because of scarce electricity, business cycles as usual–just another recession, wonder how deep and wide it’ll be.
I think the likelihood of that scenario is zero.
Putin started out to take Ukraine, but he truly wants all the countries that border the Caspian Sea back in a new iteration of the Russian Empire. The United States is smirking, fighting a proxy war by funding a non-NATO country, and it’s taking a very large sum of money at a time of a national debt of $31Trillion and with homeless lying all over the streets of our big cities. Ukraine has received more in humanitarian aid in 2022, per capita, than the senior citizens of America. Our military is having a hard time getting enough recruits and our fleet of ships is depleted, not to mention our Strategic Petroleum Reserve–which is mostly medium-sour oil that our refineries truly must have in order to run. A major interruption in importation of medium-sour oil and we’re in a pickle. Not only that but every producer is lying like a rug about reserves and longevity of supply. Our president has piss-poor advisors in energy because they have no background in anything but politics as usual.
Who can game this? There are too many moving parts. I believe that energy insecurity is nearly global–even in parts of the United States. For example, due to the absence of pipelines, the northeast is going to be paying a very, very large premium for their NG this winter. They will basically be competing with Europe for LNG. At some point the Chaos Theory kicks in. Something will break in the economy. A major event will occur. Putin will lose his few remaining cookies and shoot off a nuke or two. I don’t pretend to know the way this will go, but I am pretty sure it’s going to make a monkey out of us.
Gerry – I agree, there are so many “what-ifs” but the reality is the trend. You can start to look around you, out the window, down the street, you can almost feel the deceleration of the global engine, it’s knocking and ticking, teetering. Few realize (myself included) its complex nature and difficult to understand system is at work, the interdependencies and feedback loops cause changes that almost no one can expect. It’s funny that the optimists here basically project a very minor increasing trend for global production growth, I’d say this pushes the pessimists (myself included) the opposite direction, hoping for only a 5% decline rate and now thinking a much larger drop might be in store. From what it sounds like, maybe there was no choice at all in taping into the SPR, now that’s a very scary thought – and what exactly happens in a couple months when it’s tapped out???
If it wasn’t for all the US/European ESG concerns there would be a lot more oil on the market now-
from Iran, Venezuela, Russia. And lead in the gasoline.
And there would still be slavery too.
+1
Sadly.
Another opinion on US energy policy
https://finance.yahoo.com/news/ignore-analysts-misinformation-oil-slick-214838915.html
Hmmm…so the Biden administration actually knows what it’s doing???
“They portray the administration as largely rudderless on energy challenges, politicizing releases of the fast-dwindling strategic petroleum reserves (SPR) to put a band-aid on lowering prices before the midterm elections, unable to tackle supply challenges.”
Gas price has been above 10-year averages for 18 months now…it’s doubtful release of the SPR had any measurable impact on prices. US treasury says maybe a couple of pennies per gallon: https://home.treasury.gov/news/press-releases/jy0887
Article doesn’t really make any points supported by evidence…
Hz Oil Rig Count for week ending Oct 21.
It’s up 5 from last week to 563 and 12 from the first week in October. Left column is first week in September.
Permian is flat because 4 rigs moved form NM to Texas. Four of the five increase in rigs came from the Niobrara basin
I’ve heard about labor problems in the oil industry here, but this is the first time I’ve seen the media reporting on it.
https://grist.org/energy/young-people-are-steering-clear-of-oil-jobs-retention-hiring/
“And we did discuss Nader’s suggestion about putting terms into a more practical vocabulary, like Neoliberalism being called a Dictatorship of Bankers or Bankers Dictatorship as the term dictatorship is understood correctly by most people.”
As further indication of some of the issues surrounding sub-saharan OPEC members, this shows the developed and undeveloped proved liquid reserves for the nine IOCs active there. Undeveloped would have been close to zero had not TotalEnergies announced some new development in Angola last year. They are likely to increase again this year as TE will announce another new FPSO. Most of any probable reserve will be in the undeveloped numbers so this is tending to zero, as also shown by the “adjustments” line, which includes improved recovery and revisions (part of which is problematic to proved upgrades) and is tending to an asymptote. The new discoveries line represents FIDs, which came to a virtual halt after the 2015 crash. There are known fields waiting to be approved (e.g. SW Bonga) but they are difficult developments apparently the IOCs do not yet expect prices to be high and stable enough in the future to warrant the financial risks for most of them.
Based on HHH’s prediction of $25 by March, here’s an update of my (fictitious) put option positions.
Outside the US inflation is running rampant because lack of dollars not too many dollars.
Look no further than Japan and China. Their currencies are imploding because it’s costing them way more to source dollar funding. The two countries with the largest foreign currency reserves that are mainly dollars can’t keep their currencies from imploding against the dollar.
Eurodollar market isn’t creating the dollar’s needed for oil prices to remain high.
High prices are due to supply shocks. Without the money available to support prices we get demand shock.
Shit is absolutely going to hit the fan over next 6-12 months. And I don’t believe it matters if the FED pivots or not.
$25 oil is a good call. Maybe it takes longer than I thought. But then again it could also happen faster than I expect.
And of course none of the talking heads. IMF, FED or any government agencies are predicting this. They’d likely lose their job if they did.
There is a lot of talk above about GDP and energy. Oil in particular. Well expansion of Eurodollar market greatly correlates with GDP particularly in places like China. When Eurodollar market is in contraction so will GDP.
Can someone remind me what the Eurodollar curve looks like right now? Yes it’s deeply inverted!
Global dollar shortage.
HHH
Not sure if you are joking but here is a table. I think it is saying the Euro is strengthening on the futures contracts. Doesn’t mean it is true.
I’m not even talking about the Euro. Though I will talk about it. As their energy crisis deepens the currency the Euro will likely continue to fall.
0.8000 is where I’ve been saying it will go to with the dollar. But let’s be clear there is no reason it can’t go to 0.5000 to the dollar.
No reason the yen can’t go to 250.00 from where it is today at 148.00 No reason the yuan or renminbi can’t go to 9 or 10 or higher against the dollar. We are talking currency crisis.
I’m not joking.
Eurodollar system is dollars not Euro’s. It’s what makes the global economy run. When banks decide they don’t want to lend because of counterparty risk. What you get is 2008-2009.
Right now we are in the short period of time before the bottom falls out and shit hits the fan just like we were in right before 2008-2009.
And let’s be clear this isn’t a hard call to make. It obvious. Everything, absolutely everything is pointing in the direction I’m saying. Yield curves, dollar swaps, collateral they are all pointing towards crisis.
HHH
Could you explain the Euro Dollar system. What is it and its relationship to the EURO or US$. What does it do. What is its roll in financial markets. Maybe too many questions but I am trying to understand what it is and its significance. I am a crude guy not a $ guy,
Eurodollar system is the global monetary system. We have an onshore dollar here in US. Then there is the offshore Eurodollar market which is about 4-5 times the size of the onshore dollar market. They aren’t the same.
Eurodollar market creates most of dollars that are outside US. It is the global reserve currency. And it’s ledger money no physical cash. Large banks create the dollar’s that fund the global economy. No bank reserves created by central banks are required.
When we get into a situation like 2008-2009 or like right now. These banks stop creating the dollar’s needed for the global economy to function properly.
Look up what a REPO fail is because they are spiking. It’s due to collateral scarcity or banks requiring more or better collateral. To make loans. They are tightening lending standards big time.
My opinion is this will be bigger than 2008-2009. But it’s not going to look exactly the same so to speak.
Go look at what is going on with the dollar against all major currencies. What your seeing isn’t the FED or rate hikes or QT or the amount of bank reserves on FED’s balance sheet.
It’s the Eurodollar market saying no we aren’t going to lend.
Governments and central banks want you to believe that they are in control of the value of their currencies. But that is not the truth. FED isn’t in control of the value of the dollar. What goes on in Eurodollar market determines the value of currencies. And there is plenty of proof to back that up.
How much has FED expanded it’s balance sheet since 2008? Where is the dollar currently?
Oil prices are going much lower. Regardless of all the nonsense that keeps getting said.
HHH
Thanks. I think I have a better understanding. So these dollars are created out of nothing by the banks as long as people/business want to borrow to create something.
Is this why the gold bugs don’t believe in dollars.
Ovi,
Most money is created by lending, whether it is US, Canadian, or “Eurodollars”.
HHH,
Your best guess remains March 2023 for $25/bo oil price, last I checked. Is that still your best guess? The futures market has March 2023 at about $81/bo at present. The December 2032 contract is at $55/bo. The US EIA AEO 2022 has nominal WTI at $95/bo in 2032 and for 2023 they have WTI at $61/bo nominal for their reference case.
Dollar shortage and astounding debt.
All growth for 30+ years doesn’t equal the runup in debt.
I try not to think about how bad it could be. The price of oil could be $25 and that might still be unaffordable.
No problem if it is affordable or not – there won’t be much oil for 25$ to buy.
Shallow, Mike and his US collegues will shut in most of their wells since producing is much more expensive than wellhead price, the OPEC will cut by 70%, and even Russia will get insulted and stop exporting.
So – no problem, only full scale crisis. And Biden can refill the SPR for cheap (at least he provides then the much needed US government bonds).
Eulenspiegel,
The $25/bo price assumes a major financial crisis (worse than the GFC is envisioned). I doubt we will see this by March 2023 as some predict, I expect average monthly price for Brent crude will remain at $80/bo at minimum in March 2023 and my expected price for June 2023 is about $100/bo to $120/bo in 2022 $.
Why do you doubt it?
Kleiber,
March 2023 is about 5 months away, a major financial crisis can never be predicted in advance, but to me this looks like a recession like many before (1974-1975 or 1980-1982), but not likely as bad as 2020 where World real GDP was -3.3% or even 2009 with a -1.3% rate of growth. The future remains unknown, but I think it highly unlikely we see growth in World real GDP under 2% in 2023. If I am correct, we will not see oil fall to under $70/bo for Brent crude for monthly average oil price in 2022 US$.
I would ask, why would one believe it?
Dennis,
A lot of the indicators coming out of the US now point to a pretty harsh downturn, with some metrics hitting 2008 levels e.g. repo markets for things like cars and homes.
China is doubling down on zero COVID, with international shipping rates dropping along with tonnage being shipped (one reason the actual backlogs are being dealt with).
And then there’s Europe, which is presently imploding its economy because of heavy industry and even basic services like hospitality being untenable.
This may clear up, but I’m not seeing anything that changes any of these factors. Affordability is already a problem with just food and energy. Discretionary businesses like Big Tech are not going to survive the bubble bursting with reality intervening.
Kleiber,
Things do not look that bad to me, I expect a recession, but do not think we will see real GDP growth for te World at less than 2% in 2023. Hey I could be wrong, I don’t think market moves can be predicted, certainly not be me,
what’s interesting is that several commodities have recaptured a bullish trend, including oil. Which makes the HHH prediction seem a little foolish at first glance. But in reality it makes the overarching HHH prediction of compounding economic crises EVEN WORSE. A Deflationary “collapse” (ala 2008) was actually a better case scenario than a dragging Stagflation (ala the 70’s). And it’s global. And it’s a mega-bubble (or pile of bubbles). There is no soft landing option… “So you’re saying there’s a chance we’ll be okay?”
Better find a couple more Permians – and fast. I guess we’ll have to wait and see if China and/or Russia can pull a Permian out of the hat?
Chart I’m looking at WTI peaked in March of 2022 and has been in downtrend ever since. Now things never go to hell in a straight line. And oil price won’t go straight down without some rallies.
Watch China and their currency because as their currency implodes it’s going to cost them a lot more to source the dollar’s they need to import everything. Which will weigh on all commodity prices not just oil.
I’m starting to see more articles that are suggesting China’s central bank is doing a devaluation of the yuan. Which are complete and utter nonsense. This a unwanted move they can’t do anything about.
HHH,
It will also tend to increase their exports as the prices of their goods will be cheaper as their currency weakens. They get plenty of foreign exchange through their exports which are far greater than the amount of imports.
No their goods will be more expensive to produce. Cheaper for us to buy. But we have a record glut of inventory buildup here in US and are canceling orders that have already been made.
Cheaper currency in China is a bad thing. It means things are bad and getting worse by the day. Not better.
You want to see China’s currency appreciating because that means dollars are flowing.
HHH,
Like most things the price of Chinese currency will be determined by supply and demand for that currency.
85% of China’s cross border settlements are done in US dollars. China exists as it does today because of Eurodollars flowing into China. Tied has turned and those Eurodollars just aren’t flowing into China like they use to.
As supply of dollars shrinks their currency implodes.
The strong dollar will hurt US exports as US goods will be more expensive in other nations (whose currencies are becoming weaker/cheaper relative th the dollar), but it reduce the prices of imports to the US and tend to reduce the rate of inflation in the US.
You are correct – only a bullish trade. I was looking at XLE at the time. But some commodities – like Corn – bottomed in July. This ties the hands of the Fed for anyone looking to a “pivot”. My point is inflation is lasting a lot lot longer than typical currency / earnings / bond prices would suggest. I still think March for $25 oil is a strong possibility. As I said, “A 2008” is a sort of “best case scenario”.
Twocats,
Do you expect monthly average WTI price to be $25/bo in March?
What is your probability estimate?
Mine would be about 0.001%.
Shale oil output threatens to peak in 2024, Energy Aspects says
(Bloomberg) — Don’t expect U.S. shale producers to ride to the rescue as the world clamors for more oil, according to Energy Aspects.
Oil output from shale basins is at risk of peaking in just two years as drillers combat rising costs, analysts including Amrita Sen wrote in a note to clients dated Tuesday. Rampant inflation is prompting at least five producers to consider the unusual step of cutting rigs at the start of the year, while none plan to boost oil activity substantially, according to the report.
That’s bad news for the global market, which needs US barrels to help make up for OPEC’s production cuts and supplies upended by Russia’s invasion of Ukraine. It’s also a blow to the Biden administration, which has pressured American drillers to raise output in its quest to tame pump prices and is urging refiners to stockpile more gasoline and diesel.
“As much as the Biden administration would like for domestic oil producers to ride to the rescue in the short term, there’s little chance the administration can do anything to reverse this activity slowdown,” Energy Aspects said. Private-equity backed operators — the growth engine for West Texas’s Permian Basin, the most prolific US oil play — are the most likely to curb activity, the analysts said.
Forward prices for US crude — currently hovering around $78 a barrel for next year — would need to rise above $80 for producers to ramp up, according to the report. Prime drilling land is dwindling, with only a few counties in the Permian still offering the so-called Tier 1 acreage that drives profits, the analysts said.
Note the peak in 2024 story assumes oil prices under $80/bo. That seems very unlikely.
HHH:
So you’re saying that we’re running up against the Triffin Paradox?
The demise of the Eurodollar complex always seemed assured, as it was a third-tier “money” created out of desperation. Triffin warned about this dilemma–after gold began to trade well above its Bretton Woods level.
But the International Monetary Fund was also created at Bretton Woods, and later on it was acclaimed to be the stopgap for monetary collapse due to dislocation of investment, which is where we are now.
Eurodollar system evolved in the 1950’s as a way around triffin’s paradox. US doesn’t have to run near as large deficits as they otherwise would to meet dollar demand outside US.
FACT SHEET: President Biden’s Plan to Respond to Putin’s Price Hike at the Pump
https://www.whitehouse.gov/briefing-room/statements-releases/2022/03/31/fact-sheet-president-bidens-plan-to-respond-to-putins-price-hike-at-the-pump/
March 31st, 2022
Biden-Whitehouse Oil Fact Sheet…
Plan A) sell ~1 million barrels per day for 6 months from SPR
Plan B) increase domestic oil production.
Plan A worked, not Plan B… LOL.
U.S. Oil Production Dec 2021 = 11.8 M/bd
U.S. Oil Production Oct 2022 = 12.0 M/bd
With the U.S. Shale Industry suffering from a 45% Natural Decline Rate, the wish for a 1 million barrel per day increase in 2022 has not materialized. Furthermore, the 700,000 bd increase set for 2023, will likely be more WISHFUL thinking.
WELCOME TO THE ENERGY CLIFF… LOL.
steve
https://mishtalk.com/economics/there-is-only-25-days-of-diesel-supply-the-lowest-since-2008
USA 25 days of diesel left
King Kong,
The US exports (net or exports minus imports) about 1000 kb/d (average for first 7 months of 2022), so accounting for this we have about 35 days of supply for US consumption.
Chart below adds net imports of distillate to consumption of distillate to get US consumption in monthly average kb/d and then divides monthly ending stocks of distillate by the monthly rate of US consumption to get days of US consumption as a measure of distillate stock levels. Note the low level between 2000 and 2010.
Low oil price in this decade is possible on any given day or month, just as it has been for the past 50 years.
One day in 1987 the stock market dropped 22%.
Stuff like that happens.
Fragility and volatility in a complex, leveraged, and contested global system shouldn’t surprise anyone.
Only a severe and prolonged downturn in the global economy would keep oil prices down for long.
That kind of downturn could begin any day…. or not.
I wouldn’t/don’t bet even a nickel on anyone’s prediction [date of start] of that kind of event.
The setup for an abrupt downturn is there, and has always been there.
Its the nature of the world, and that will never change.
Show me a reliable and time-tested economic and political Fragility Index if you’ve got one
Hickory,
Agreed. I think the likelihood of a monthly average price of $25/bo is pretty low and an annual average oil price that low is very unlikely prior to 2035, much more likely we could see this happen for a day or two if there was a stock market crash in most major World markets. Those could happen unexpectedly for many reasons (for example, if Putin feels he has been backed in a corner, he may decide to use nuclear weapons in the Ukraine invasion.)
Dennis – Something we can agree on. In 2020 oil fell below $40 for only ~3 months (Mar-May). In 2020 it was below $50 for just under 1 year. The other 2 periods that saw prices below $50 (2008 and 2015) were relatively short <1 year each. Excluding these high volatility periods, the price of oil has a very solid base of $50…going below that takes a massive upward move in supply or downward move in demand…(or combo)…right now there doesn't appear to be any risk over market oversupply…if anything a drop in demand would help to balance the market a bit and if Biden is very lucky he might find some $70 oil to refill the SPR (very unlikely)…if price drops significantly he could look like smartest guy in the room, which is incredibly scary…
Kengeo,
I agree a market oversupply might only occur in the face of a severe recession, if we see something like a fall in World GDP such as what occurred in 2020, then we would likely see low oil prices, perhaps as low as $25/bo. I just don’t see that on the horizon, but must admit I did not foresee the GFC or the pandemic, so just as I have been wrong in the past, this is likely in the future as well.
Fund Manager for Oil Stocks Outlook for Supply and WTI Price
Scroll to the 2:10 mark after the adverts where his outlook starts.
“West Texas Intermediate and oil will trade at a “higher” price, roughly US$100-$120 /bbl, for the next six or more years.:
I am not sure if this video will play in the US. If It does not, I can update with a summary
https://www.bnnbloomberg.ca/video/eric-nuttall-s-market-outlook~2548454
Ovi,
Thanks. Eric Nuttall actually said $100 is the floor and gave a high end of $180/bo so $100-$180 over the 2023 to 2029 period. He seems to agree with Energy Aspects that tight oil may peak in 2024, though I believe the Energy Aspects thesis was the peak occurs if oil stays at around $80/bo. That is not consistent with Nuttall’s oil price prediction (which seems reasonable), the call for a tight oil peak in 2024 seems wrong to me, I expect tight oil to gradually increase and peak in 2031 at 9900 kb/d.
Note that at the centered 12 month average(CTMA) World C plus C peak in August 2018, the CTMA for tight oil at that time was 6628 kb/d. So at its peak, tight oil will be about 3272 kb/d higher than in August 2018 when the World was at its most recent C plus C peak.
Dennis
Eric is an oil bull and last year his fund beat every fund because Cdn oil stocks, penny stks and medium oil company stocks roared back from penny values while the rest of the market dropped.
His comment regarding 2024 peaking in the Permian is just quoting Energy Aspects. I think more critically he has access to info we don’t have on shipping. I think he is looking at what happens after the OPEC cut and the end of the SPR releases.
His comments regarding $180 not being too expensive is off the mark. $125 caused a big drop in usage in the US.
His main concern seems to be the low P/E of Cdn oil stks and he is talking to a lot of companies encouraging them to buy back their stock now while it is cheap.
Looking at your chart from 2023 to 2025, seems to be consistent with the EIA seeing growth into 2023 going up at close to 500 kb/d. Energy Aspects thinks the Permian is running out of Tier 1 areas. Not sure if you have different well profiles for Tier1 and Tier 2 wells.
The next two months will clear the air once we see the impact of the OPEC cuts and the end of SPR releases on the price of WTI and on drilling/completions.
As for the Permian peaking in 2032 and being higher than in 2018, decline will have wiped out 8,400 kb/d over 14 yrs at a decline rate of 600 kb/d/yr.
Ovi,
I doubt decline will be 600 kb/ year. World less OPEC plus and US, see figure 13 from post. Nations such as Canada, Norway, Brazil, Guyana, Suriname, and Argentina will see increases in output, offsetting some of the decline you foresee. Note also that I expect World output to peak around 2029. So 7 years at 86 kbpd per year decline, would be 602 kb/d. Also note we could see increases from UAE, Iraq, Iran, Kuwait, and Saudi Arabia that more than offsets declines from other OPEC plus producers. My guess is that we are very likely to see a new 12 month average peak above 85 Mbpd. The current 12 month peak is between 83 and 83.5 Mbpd.
Ovi,
The drop in demand you believe was the result of high prices was a typical seasonal demand drop during the spring (NH). You may be right theta $180 is too high, but with current level of GDP the World could handle oil at $150/bo, beyond that we might see slower economic growth. Oil is becoming less and less important in the economy and as more people switch to hybrids, plugin hybrids and EVs, work from home and shop on the internet, oil will become less and less important.
Ever wonder how you could get around in a world where petrol is too expensive or maybe simply unavailable. After all, as crude oil depletes it will be diverted to other critical economic uses either by market forces or governmental action.
Well, surely by now you have heard of electric vehicles and I will walk through some simple numbers to show what it would take to produce enough of your own electricity to travel 15,000/yr in two currently available vehicles- the Ford Mustang Mach E and the Ford F-150 Lightening.
These vehicles travel 100 miles with 37 kWhr and 51 kWhr consumption respectively. To go 15,000 miles you need to produce (or import over the grid) 5,500 kWhr/yr or 7,650 kWhr/yr respectively.
The national average grid retail electrical price is up to 14 cent/kWhr, which means that home charge up of the vehicles to get 15,000 miles would cost $770 and $1,071 respectively.
Of course your state may have higher or lower electricity rates, and the rates will likely go up over time.
The petrol version of 2022 Ford Mustang is rated at up to 25mpg combined. To go 15,000 miles would take 600 gallons. Gas would have to be less than $1.28/gallon to come in with a lower annual ‘fuel’ cost than the electric version.
The petrol version of 2022 F-150 is rated at up to 22mpg combined. To go 15,000 miles would take 682 gallons. Gas would have to be less than $1.60/gallon to come in with a lower annual ‘fuel’ cost than the electric version.
How about providing your own electricity from photovoltaics if you have some sunny space, and don’t live in one of the cloudiest spots in the country?
As an example, if you take locations with as much annual solar input as Philadelphia, Chicago or Minneapolis you can provide the annual electricity for your vehicle to go 15,000 miles with 12 solar panels (330W) for the Ford Mustang Mach E, and 17 panels for the F-150 Lightening. This is a 4kW and 5.6kW system respectively.
Keep in mind that a majority of the country has better solar performance than this, and that modern solar panels have output depletion less than 1%/year. If you dig into the details you will be amazed at how cheaply you can travel over the next 25 years with such a system. And the money you save is going to pay for your own equipment rather than someone else’s equipment and profit.
You may ask- how much would it cost to get a 10 or 20 or 30 panel system at my place? Its easy to find out- go to https://www.energysage.com to get competing quotes nationwide.
You may ask- how much solar does my area get? The tool is at your fingertips- https://globalsolaratlas.info/map?c=37.961523,-100.942383,4
Its good to save oil, and dollars.
https://www.cbsnews.com/news/texas-pete-hot-sauce-lawsuit-phillip-white/
Texas Pete hot sauce maker sued by a man who claim he was psychologically damaged because it is actually made in North Carolina.
Which of you texan oil pros is behind this lawsuit?
https://www.oilystuffblog.com/forumstuff/forum-stuff/both-feet-and-one-knee
Great post on Gas to Oil ratios here!!
Brazil is becoming part of the problem.
https://www.nasdaq.com/articles/oil-output-from-brazils-petrobras-dips-nearly-7-in-third-quarter-0
Judging by the move overnight in the Chinese yuan it strengthened. China is starting to drawdown on their foreign currency reserves mainly US treasuries. Because they are in desperate need of dollars.
Remember China doesn’t get any dollar swaps from the FED. Since Eurodollar market isn’t going to provide the dollar’s needed they are now tapping their reserves. Last time they had to tap their reserves back in 2015. They lost $1 trillion in reserves then.
They have about $3 trillion in reserves. Sounds like a lot but once those are gone you can forget about Chinese demand for oil and everything else coming back.
In your worldview how high do you see the DXY going? 120+ ?
Fred no longer tracks DXY, but for a broad dollar index we have the following
https://fred.stlouisfed.org/series/DTWEXBGS#
click on chart for better view.
Yeah but it probably doesn’t get there in a straight line. Since there are things that central banks can do like sell treasuries and buy their local currency.
But when they runout of reserves which might not take as long as most people would imagine. There is nothing they can do to stop or slow their local currency depreciation.
DXY could go 150 or higher. All depends on when and if Eurodollar banks starts providing dollar liquidity in the volume that is needed.
New posts are up.