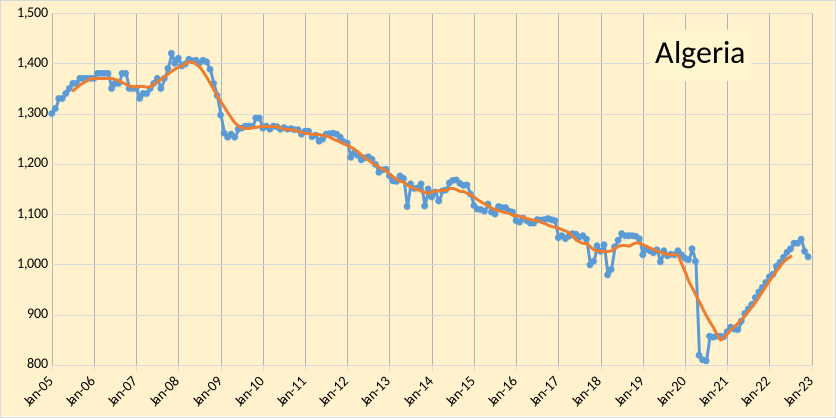
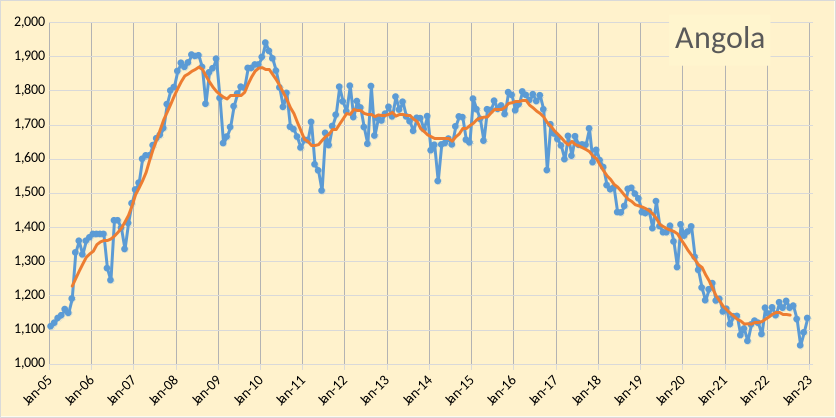
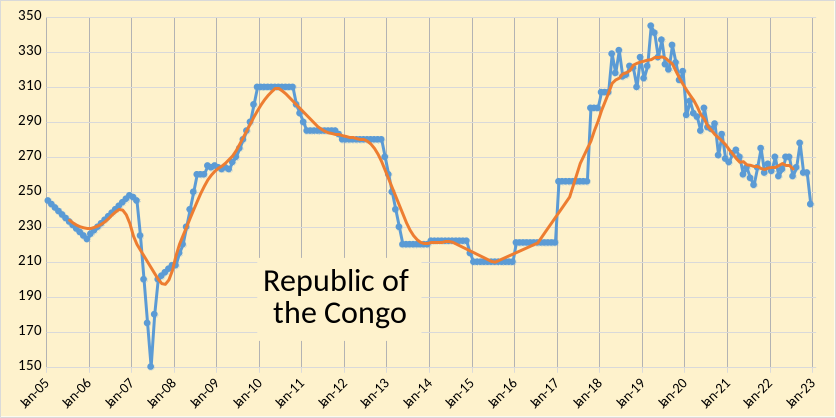
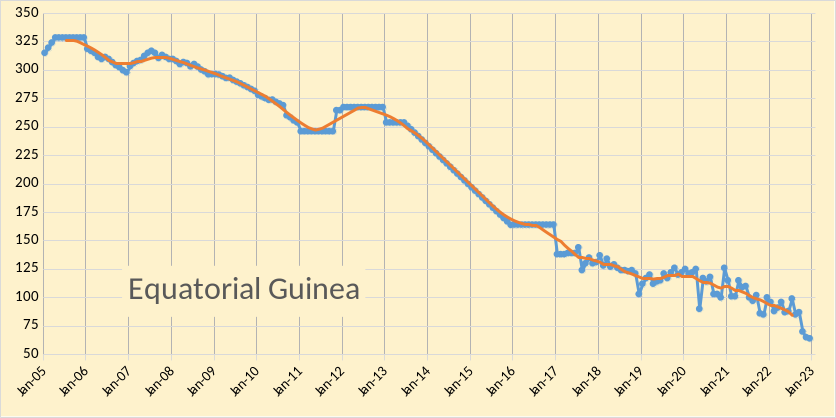
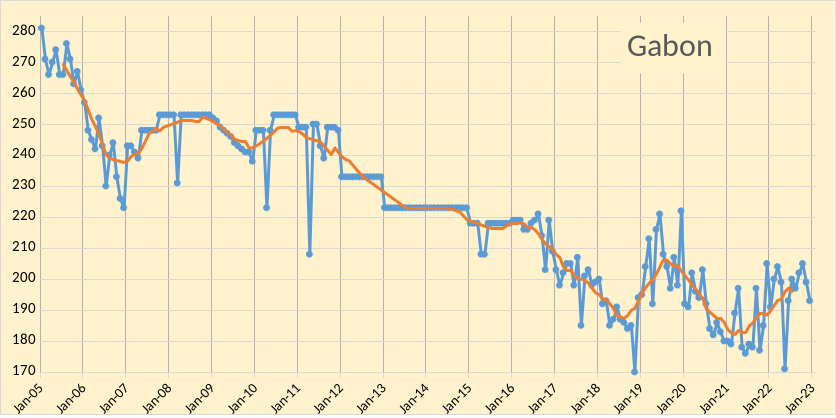
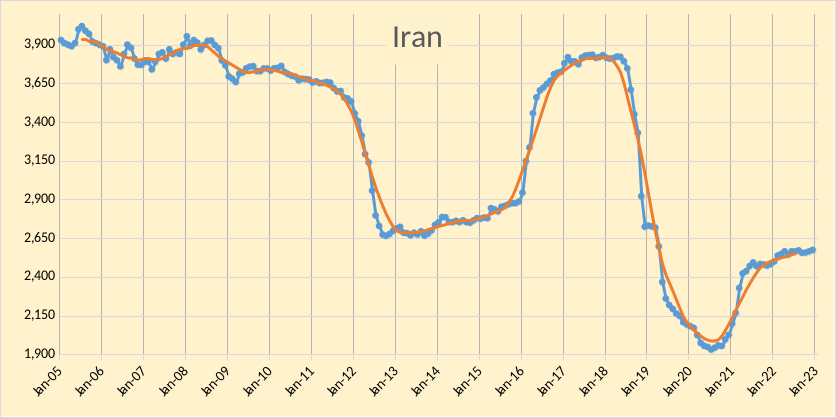
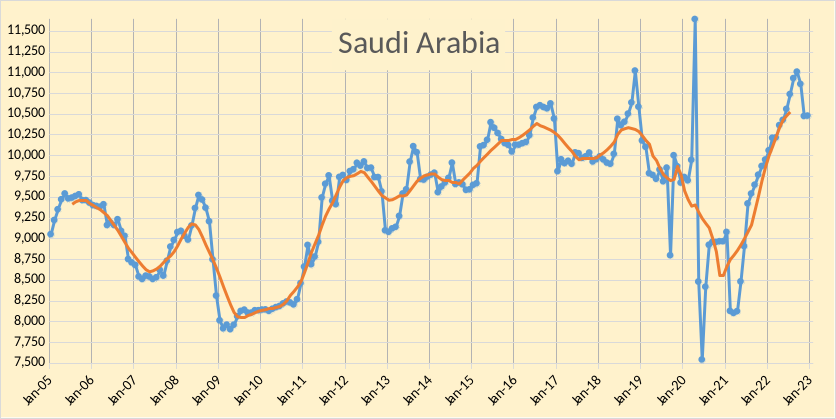
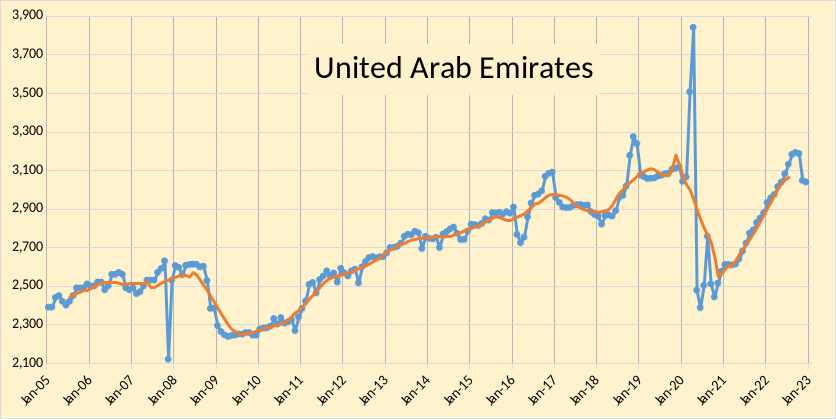
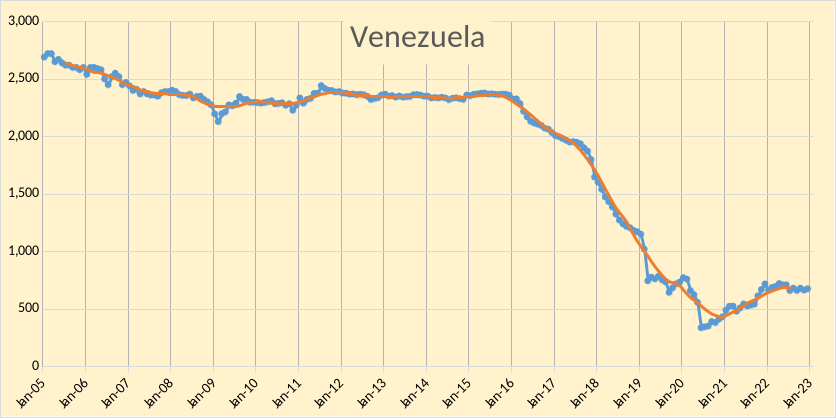
The OPEC Monthly Oil Market Report (MOMR) for January 2023 was published recently. The last month reported in most of the OPEC charts that follow is December 2022 and output reported for OPEC nations is crude oil output in thousands of barrels per day (kb/d). In most of the OPEC charts that follow the blue line is monthly output and the red line is the centered twelve month average (CTMA) output.
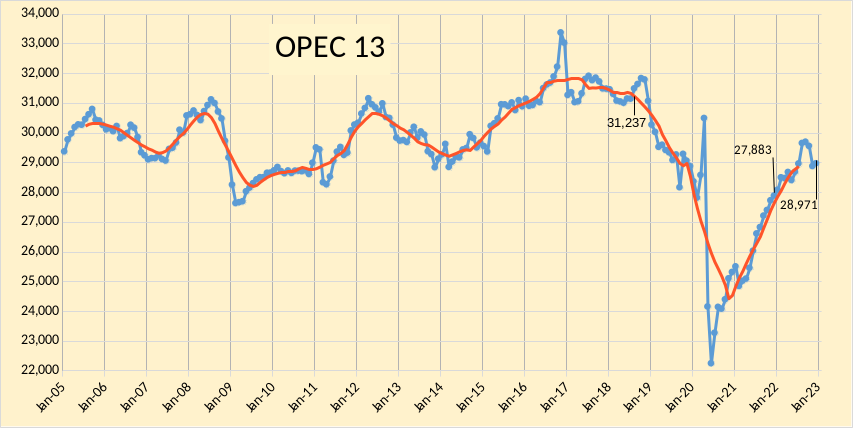
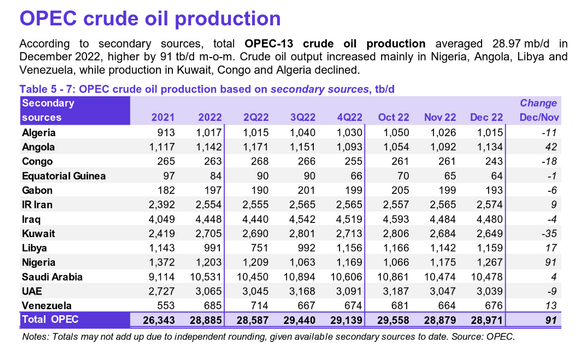
OPEC crude output was revised lower in October 2022 by 12 kb/d compared to last month’s report and November 2022 OPEC crude output was revised higher by 53 kb/d. OPEC output has increased by 1088 kb/d since December 2021, from 27883 kb/d to 28971 kb/d in December 2022. When the World was at its centered twelve month average peak for C+C output in August 2018, OPEC crude output was 31237 kb/d (as shown on the chart), December 2022 OPEC crude output was 2266 kb/d below that level.
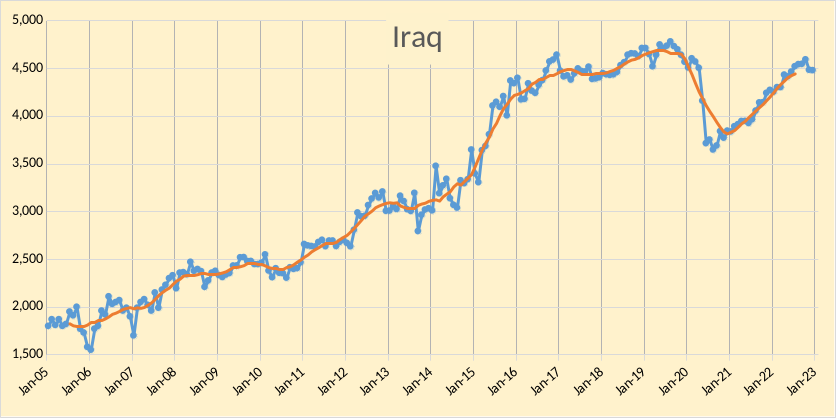
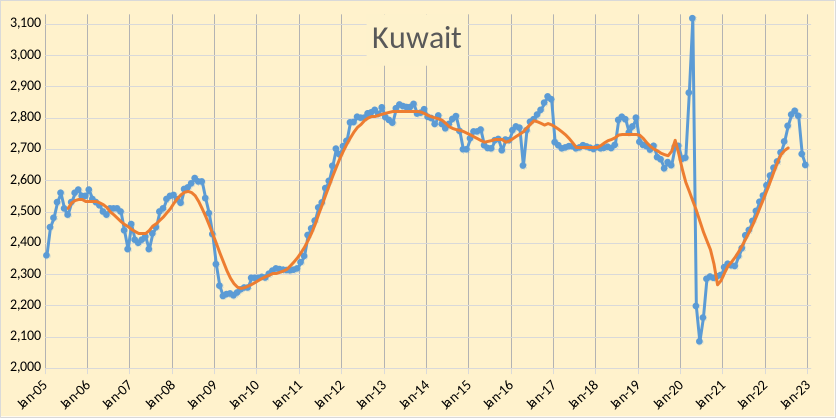
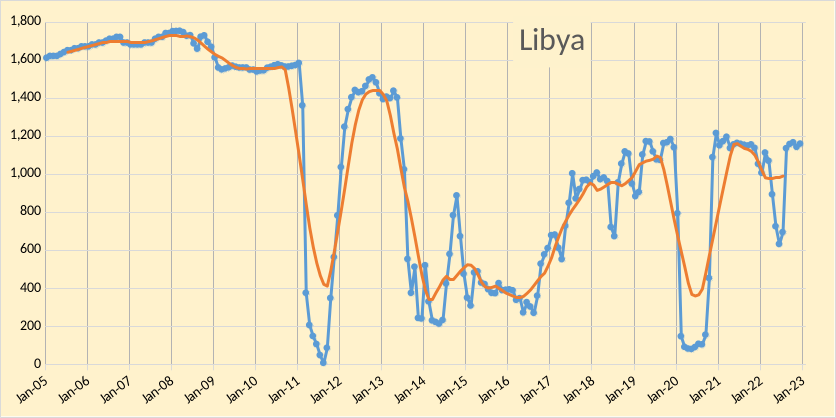
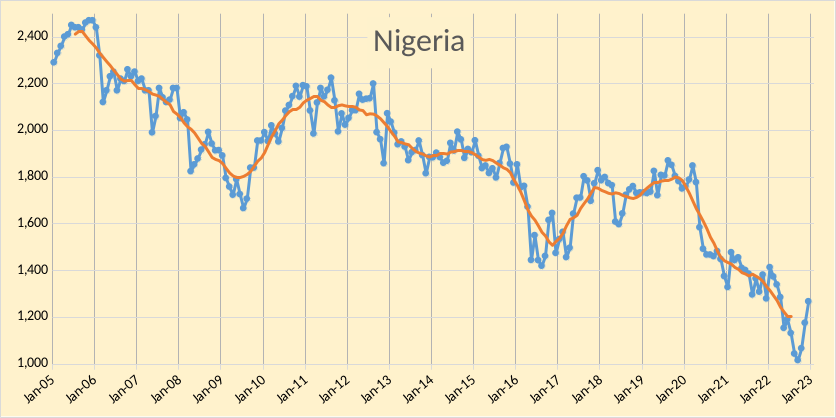
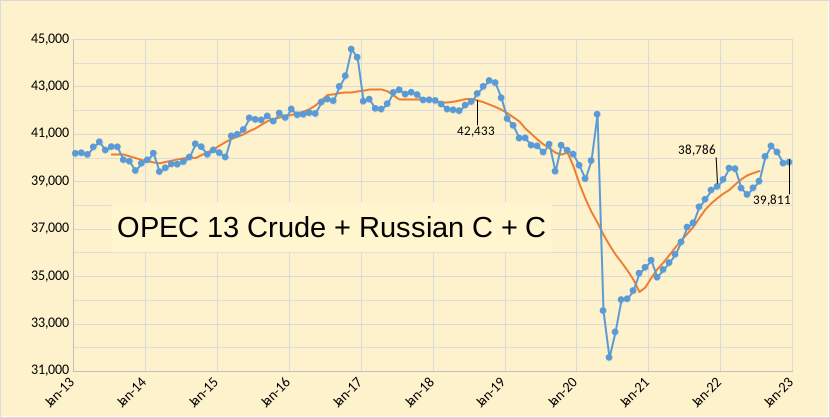
In the chart below we have Russian C + C and OPEC crude oil output. The centered 12 month average (CTMA) of output for OPEC13 crude and Russian C+C was 42443 kb/d in August 2018 when World C+C output was at its centered 12 month average peak, output for Russia and OPEC was 2622 kb/d below the August 2018 CTMA at 39811 kb/d in December 2022. In the past 12 months OPEC and Russian output has increased by 1025 kb/d from 38786 kb/d in December 2021.
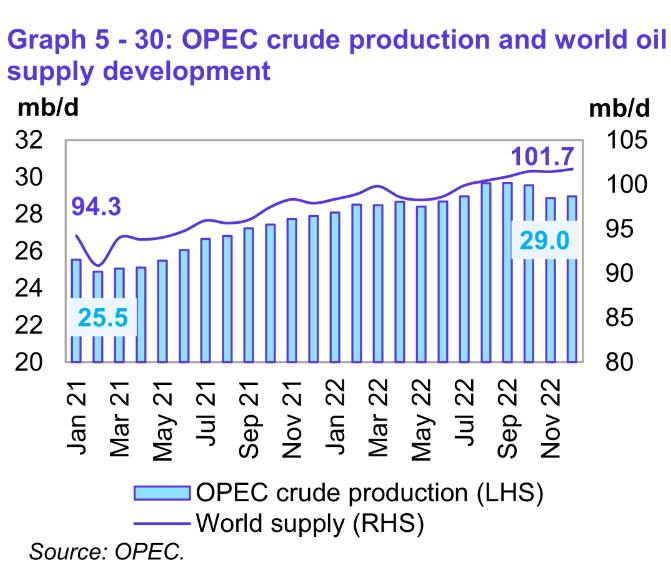
World Oil Suppy (all liquids) was 101.7 Mb/d in December 2022, 7.4 Mb/d higher than output in January 2021, OPEC crude oil output increased by 3.5 Mb/d over the same 23 month period.


OPEC expects the balance of supply and demand to be close to the the December 2022 OPEC output level of 28.88 Mb/d from 2022Q4 to 2023Q4. If OPEC’s estimates for future supply and demand are correct we might expect oil prices to be fairly subdued in 2023, perhaps in the $70-90/bo range for Brent crude.
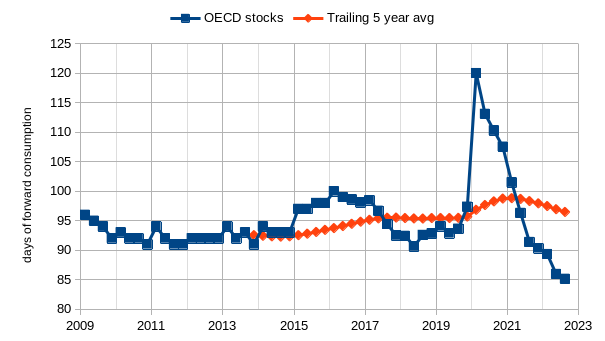
OPEC stocks are at historically low levels relative to 2009 to 2020, but this has not lead to high oil prices of late, it may be that World stock levels are at a comfortable level, unfortunately the data for World Oil Stock levels is not good.
The chart below is OPEC’s estimate for average annual US tight oil output in 2021, 2022, and 2023.
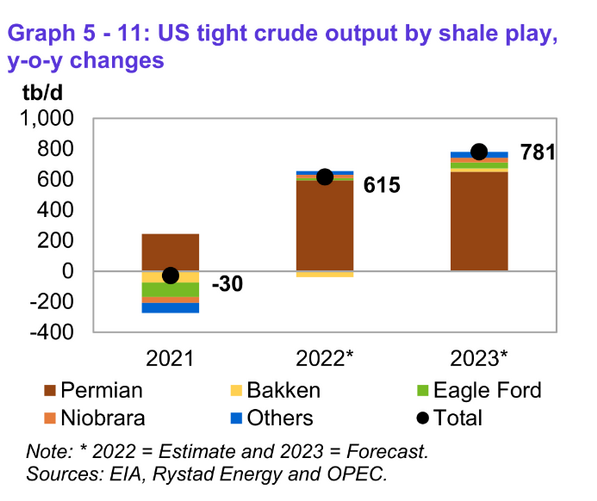
Note that the OPEC estimate for US tight oil output in 2023 looks high, my expectation is that US tight oil average annual output will increase by about 550 kb/d from 2022 to 2023.
Thanks Dennis for the effort and work you’ve put in to supply us with this invaluable data.
Would you agree with this line of thinking that it is ultimately the U.S that is putting a lid on oil and gas prices by overproduction?
Iron Mike,
thanks. I tend to think of overall World output rather than a single country. In 2015 and perhaps 2019 US might have been overproducing, currently at $80/bo or so, I don’t think so. Tight oil has been growing fairly slowly of late relative to 2017 and 2018.
Certainly the flip side of the statement Mike is true- if not for the rapid growth of oil from shale coming from the US then the oil and gas prices would be dramatically higher now. It would be a whole different ballgame right now.
Hickory,
I agree. The hypothetical scenario where tight oil output was zero would mean World C plus C output was about 73 Mb/d, if we assume all other nations are at full output capacity. Of course, if tight oil had never been produced, other nations probably would have expanded their capacity, perhaps by as much as 8 Mb/d over the 14 years since 2008 when tight oil took off.
Definitely, but looking at more recent developments, if one looks at the last quarter of 2022, natgas prices have crashed.
Also if one looks at the data Dennis has presented above from OPEC they don’t seem to have any spare capacity to produce. This should be concerning especially come 2nd and 3rd quarter of 2023. One would expect oil prices to be shooting higher, but they have not.
One hypothesis could be what i mentioned in my original comment, U.S production or anticipation of overproduction in the coming quarters. Hence investors are still iffy regarding overproduction hence putting a headwind for prices both natgas and oil.
Iron Mike,
I was focused more on oil, US natural gas may be being overproduced, part of the problem is warmer winter weather in Europe and the Freeport LNG facility being down. On an annual basis OPEC may have enough capacity for 2023, if OPEC estimates for non-OPEC production and demand are correct.
I think OPEC is overestimating non-OPEC output in 2023 and think oil prices will rise.
There is a way of looking at the young transport electrification trend in terms of oil demand displacement- just how much oil consumption has been avoided by global electric vehicle miles traveled.
Of course it a hard thing to measure exactly, but last May estimates came out at 3% of global oil demand,
which roughly equates to output from Kuwait or the UAE’s.
Sometime before the end of the decade I suspect we will be able to say that Saudi Arabia equivalent gasoline production has been displaced.
Of course this is simplistic for a few reasons
-most of what is being displaced is gasoline demand, and gasoline is only about 45% of crude oil.
-demand isn’t really displaced, since the world appetite for energy is still growing. So far, electrification is just taking some of the edge off of petrol consumption.
Will the transition be fast enough to prevent huge price surges for gasoline?
Unlikely as I see it. Late start to effort, although one big country seems to take the challenge a little more seriously than others.
Dennis,
Thanks, just saw this- “World C plus C output in 2019 from BP was 83122 kb/d, so jet fuel consumption was 9.6% of crude plus condensate output. In 2021 World jet fuel consumption was 8.6% of World C plus C output (last data point available).”
https://peakoilbarrel.com/all-september-non-opec-oil-production-increase-from-us/#comment-751466
With half the rigs in the Bakken now drilling outside core areas the data is starting to reflect the new reality.
This table doesn’t say this.
It’s normal that the older an oil field is, the more mature wells you have even when the newer ones are better than the old.
It’s a statistical phenomen – you have to try harder, and get current data. Something like “First 6 month production” over the years. And normalized for well lenght, since this changed, too.
So – it isn’t that easy.
Eulenspiegel,
Correct much of the change in average productivity per well is due to changes in average completion rates.
Completion rate was low in 2015 and 2016, increased from 2017 to 2019, then fell from 2020 to 2022. That is the main reason for changes in average productivity and also falling output after 2019.
I really believe the product prices will have an immediate effect on the rig count. The ability or lack thereof exporting the natural gas via Freeport plus the withdrawal of the SPR and its affect on product prices should limit domestic production if not impact it in a small negative way. While $80 oil and $3.00 is higher than I have seen during 95% of my career, the IRRs are just not there to warrant a hyped up drilling program. Frankly I would love to see these oil prices (stable) and gas prices at $4.00 with D&C costs coming down at least 20%.
I do however, barring an expansion of the Ukraine/Russian conflict and avoiding a severe recession/depression see an under supply of about 3 million barrels per day coming late in the second quarter. It should get interesting.
US horizontal oil rig count
https://rigcount.bakerhughes.com/na-rig-count
Lights out, Very interesting- peak production in 2019 with decline curve faster than growth curve, 10% decline rate seems really high…curious what Dennis’ take is…
Kengeo
In this case a picture gives a better overview of what is happening with the decline rate.
The decline date since January 2021 is 1.93 kb/d/mth. It is actually less than that if the April plunge due to bad weather were removed from the OLS analysis. Closer to 1.16 kb/d/mth.
Kengeo,
Scenario for Noth Dakota Bakken/Three Forks where I assume well productivity starts to decrease in Jan 2025. Completion rate is 74 wells per month from March 2023 to June 2033 for this scenario, total wells completed from Dec 2004 to Sept 2034 for scenario is 27062 horizontal tight oil wells with 17135 completed as of December 2022.
Below are two charts regarding Saudi Arabia.
The first chart shows the strong relationship between Saudi Arabia’s production and exports and how they move together. Production peaked at 11,000 kb/d in September 2022 and then dropped in November due to OPEC’s decision to reduce production.
The second chart shows SA’s crude stocks. At the same time that production and exports were climbing, excess crude was being produced that went into inventory. Over one year, November to November, stocks increased by 19 million barrels for an average rate of a little over 1.5 Mb/d/mth.
An interesting point to notice is the production spike in April 2020 to 11,700 kb/d. Note how the export spike was larger, 1.7 Mb/d vs 2.8 b/d. Note the drop in the stocks in April 2020. Lends some credibility to the stocks chart
Definitely gives the impression there is a lot of reserve production capacity in SA.
To be exact 1.5 Mb / month is 50kbpd. In these big numbers > 10mbps production more or less peanuts. Perhaps even working stock, since increased production means increased number of needed pipelines, trucks, processing tanks…
Perhaps real oil men can help out here, my job is industrial logistics and we know this phanomenon. When you crank up production, you need more material in all the pipelines (literaly, trucks, conveyor belts, ships, intermediate products…) because most times the pipeline speed is near constant and increasing it is a complete different matter.
Stocks Chart
for those who enjoy objective energy analysis you might follow Abhi Rajendran, he has some thoughts on the BP annual review worth reading.
https://mobile.twitter.com/araj_energy
Sure,
He tweets about exactly the vibes I am getting from all sorts of angles. Natural gas is going to be the beadrock of the global economy the next maybe 20 years(?). How much LNG infrastructure that relies on, I don’t know. If pipelines don’t work due to geopolitical tensions, LNG shipping is the number 2 option in terms of cost. The flexibility of LNG mirrors that of oil though and that is an asset in its own right. We could very well end up in a situation where coal consumption goes down. It will very much depend on investments going forward and it will be easy to see if there is an appetite for admittedly low quality coal going forward or not. Oil production goes down as a base case, but I still think that electrification and slashing excess usage can mitigate that somewhat. We may very well have a society where elderly people drive around in mini electrical vehicles, while younger people rent more. The impacts of oil decline does not necessarily have to be huge.
Anyway it is a bit sad if the “energy bible” (BP’s annual review of world energy 2023) is proposed to be cancelled. No matter the data accuracy or politics involved it is very useful to have a stable source of reference.
I see Texas broke a natural gas production record again, per oil price.com.
How much of that is due to drilling more gas wells in the EFS and how much is due to rising GOR in the Texas Permian.
These guys never learn, natural gas prices have cratered.
SS by the numbers
https://oilprice.com/Latest-Energy-News/World-News/Texas-Breaks-Natural-Gas-Production-Record.html
So, after getting a brief reprieve after COVID, natural gas producers are going to be back to the bottom of the barrel.
Almost all of the public natural gas producers had to reorganize in some way or another, so it’s not easy to find a good 10 year chart on stock performance.
The 10 year chart on Range Resources is -63%. The 10 year chart on Southwestern is -83%.
What a solid business plan it has been to ignore supply and demand. As I posted, they have never learned.
I assume they are still flaring like hell in the Permian too, and this will only increase now that the gas isn’t worth a lot of $?
At least our electric rates, chemical rates and service rates all spiked due to the brief price reprieve we all received.
I did never understand why the big boys of fracking oil and gas never met somewhere on a golf course between hole 8 and 9 and did a bit of talking. And another talk on a golf course in Dubai.
Golf courses are invented for action like this – they have been tap-proof for a long time and can be secured easylie even today.
This is stricly forbidden but very profitable, other industries do it most times, too. It makes better stock option plans for every manager and owner.
For example car companies never tried for an all out price war, all of them paid big dividends instead.
worthy read
https://oilprice.com/Energy/Energy-General/Expert-Analysis-What-To-Expect-In-Energy-Markets-This-Year.html
for what it is worth he does not mention the greater than normal geopolitical risk which I think argues for the risk being higher oil prices, i think a lot of our adversaries will think about taking a take a shot now that we have weak leadership and preoccupied with another war.
I agree Robert Rapier’s analysis is good. In my opinion his predictions are quite good.
It looks like IOCs and larger independents are allowing for at least $300 billion buy backs over the next two years. Chevron is the largest at $75 billion, which is around 20% of the company’s worth (i.e. if this continued for ten years there would be one share left that would own the entire company) , ExxonMobil has increased to $50 billion and if oil prices increase this year will likely do so again. Companies that haven’t conducted many buy backs in the past, like TotalEnergies and independents concentrating on US tight oil, are now expecting to pay multi-billions. This is separate from dividends, which will inevitably increase. This is not the pattern for an industry that expects to be making lots of new discoveries and increasing production. Part of it is the loss of investment opportunities in Russia, but only part – investment there is down $15 billion this year.
George,
Another interesting trend taking place is the CAPEX to EARNINGS in Chevron’s Upstream Sectors. You will notice that Chevron made more money in its International Upstream Sector ($17.6 billion), while it only spent $2.7 billion on CAPEX, vs. the U.S. Upstream Sector earnings ($12.6 billion), while investing $6.8 billion.
We see the same trend in ExxonMobil’s CAPEX to EARNINGS in its Upstream US vs. International Sectors.
steve
Steve Buddy,
Oil production is an up front capital intense investment business. If Exxon and Chevron are focused on developing their Permian basin growth projects currently vs. International. One should expect higher capex costs for growth vs. on going maintenance projects.
Tight oil requires continual, and with current cost inflation, growing capital input to frill all the wells. With conventional oil there are a few years of capital cost while the project is built but then it is mostly operating cost. Chevron has been withdrawing from some areas, like the North Sea, and hasn’t had any recent major oil discoveries (I think there mau be some as projects but I can’t remember at what stage they are)..ExxonMobil might be slightly different as it has Guyana with four or five projects in development Chevron has some legacy GoM production, which probably shows a ratio similar to the international sector so the ratio for tight oil and gas only will be even lower (EMs might show this especially as it is heavier on gas I think). Even with raised prices the return ratio for tight oil doesn’t look that great; the large profits are coming from (declining) legacy conventional production
BP Energy Outlook 2023
Global oil demand plateaus over the next 10 years or so before declining over the rest of the outlook, driven in part by the falling use of oil in road transport as vehicles become more efficient and are increasingly fuelled by alternative energy sources.
– Oil continues to play a major role in the global energy system over the first half of the outlook in Accelerated and Net Zero, with the world consuming between 70-80 Mb/d in 2035. The decline accelerates in the second half of the outlook, with oil demand reaching around 40 Mb/d in Accelerated and 20 Mb/d in Net Zero in 2050.
– Oil consumption in New Momentum is stronger, remaining close to 100 Mb/d through much of this decade, after which it declines gradually to around 75 Mb/d by 2050.
– The single biggest factor driving the decline in oil consumption is the falling use of oil within road transport. Rising prosperity and living standards in emerging economies support an increase in both the size of the global vehicle parc and in distances driven, boosting the demand for oil. But this is increasingly offset by a combination of the road vehicle fleet becoming more efficient and the growing switch away from oil to alternative energy sources.
– Lower demand for oil in road transport accounts for more than half of the reduction in total oil demand in Accelerated throughout the outlook. In 2030, this largely reflects the impact of the increasing efficiency of the global vehicle fleet, which is more than twice that of the switch to alternative energy sources. By 2040 these two effects are broadly equal, and by 2050 the switch to alternative energy sources, led by the increasing electrification of vehicles, accounts for more than twice the impact on oil demand than the effects of greater efficiency.
https://www.bp.com/content/dam/bp/business-sites/en/global/corporate/pdfs/energy-economics/energy-outlook/bp-energy-outlook-2023.pdf
This opening statement excerpt says a lot-
“The scale of the economic and
social disruptions over the past
year associated with the loss of
just a fraction of the world’s fossil
fuels [Russian invasion] has also highlighted the
need for the transition away from
hydrocarbons to be orderly, such
that the demand for hydrocarbons
falls in line with available supplies,
avoiding future periods of energy
shortages and higher prices.”
I will reaffirm that demand will absolutely fall in line with depleting supplies.
Thats what happens in the real world, either via the hard way or the harder way.
I will reaffirm that demand will absolutely fall in line with depleting supplies.
Hearty belly laugh
Thanks Ovi,
They are essentially calling peak oil demand 2025ish. Not too far away. I personally disagree but who knows.
Javier Blas
@JavierBlas
OIL MARKET: Another substantial revision to US total oil demand as
@EIAgov
releases more precise monthly data (vs weekly estimates).
November pegged at 20.593m b/d (up almost 400k b/d from weekly data indicating 20.211m b/d). Gasoline, diesel and jet-fuel all revised up #OOTT
The new monthly data means that total US oil demand was up in Nov 2022 vs Nov 2021 (by a mere 20k b/d, but still up, vs previous indications of a significant year-on-year drop). It was however slightly down (143k b/d) from the same month of 2019 | #OOTT
US November Oil Production
Production has been essentially flat for the last two months.
Oct: 12,410 kb/d
Nov: 12,375 kb/d, down 35 kb/d.
Full report late Friday Feb 6.
In the GoM Thunder Horse has overcome whatever issues from operations or drilling it was having and has added about 40kbpd in the last quarter. Kings Quay had a really smooth ramp up and is operating above nameplate already. On the other hand Appomattox and Buckskin have seen quite significant declines recently. Shenzi added subsea pumping but its effect on production has not yet shown up. PowerNap looks like a bit of a disaster at the moment – it didn’t get to expected nameplate production and has dropped steadily by half since. The smaller and more mature deep water platforms and shallow water fields combined have been dropping quite fast, they may have run out of tie-back or in-fill drilling options now.
Ovi,
Do you mean Friday, Feb 3 or Monday Feb 6?
Dennis
Friday February 3. Sorry for the confusion.
We should try for Fridays for all of February .
Ovi with thes current product prices there will be zero growth in the shale and possibly a pretty serious decline.
Being what we experienced was a supply side shock. What is on the other side of supply side shock is demand destruction. Because people can’t afford the higher prices.
I’d expect product prices to remain low and go lower. As a whole factory orders in US have tanked to March 2020 levels which everyone knows was the worst part of the pandemic economically speaking.
How is that even possible? Not enough money in the economy to support higher prices. Mass layoffs are coming. We know that because factory orders are a forward looking indicator.
Maybe oil prices don’t hit $25 by March but that don’t mean oil prices won’t hit $25 in 2023.
HHH,
During the pandemic factory orders increased because people were buying a lot of durable goods because they were spending less on eating out and travel. Now people are strating to spend more on dining out and travel and have less to spend on durable goods. So less spending on durable goods leads to fewer factory orders. So far we are only seeing layoffs in the tech sector which expanded too much during the pandemic and are now adjusting to lower growth (again due to fewer online orders as people spend less on durable goods). Employment overall in the economy is fine.
Show me where more money is now being spent on services instead of goods now. You can’t because they are both down. Money being spent on goods is just falling faster than money being spent on services.
All the big tech layoffs that have happened in last 2 months haven’t even shown up in employment data yet. All those people got severance packages that usually last about 12 weeks. You’re not unemployed while still collecting severance pay.
As corporate earnings continue to fall more and more people will be laid off. And why are corporate earnings falling. Because higher prices have caused demand destruction and companies are unable to pass on full costs to the consumers.
HHH,
See
https://fred.stlouisfed.org/release/tables?rid=54&eid=3220#snid=3211
total consumption is down, but expenditures on services is up in most recent month (Dec 2022). Click on figure for largere view.
That’s in dollars not volume. We are paying something like 5-6% percent more year over year for about 4% less volume of goods and services.
Economy has shrunk we are paying more for less and calling it growth in nominal terms. We’ve done less business and it’s costed us more.
Stay tuned to the HHH economic collapse report, WTI going to trade at $25 March 2023
HHH,
Here is the data in inflation adjusted dollars.
From
https://fred.stlouisfed.org/release/tables?rid=54&eid=3232#snid=3223
click on figure for larger view.
US real GDP
https://fred.stlouisfed.org/series/GDPC1
click on chart for larger view
US tight oil from spreadsheet linked below (EIA official tight oil estimate)
https://www.eia.gov/energyexplained/oil-and-petroleum-products/data/US-tight-oil-production.xlsx
Data from March 2021 to December 2022. The line is the OLS trend over the 22 month period above, an annual rate of increase of about 488 kb/d.
LTO Survivor
I looked up the CVX and XOM earning calls and picked out these comments on the Permian. They might give you and the rest of us an idea of what the big guys are planning and saying about the Permian.
CVX
Analyst question:
You talked about 0% to 3% total production growth for the year, led by sale in the Permian. And last year, you had another strong one for the Permian, unit volumes were up16%. I was wondering if you could just talk through your expectations for that asset in 2023, whether or not you’re adding rigs there, overall activity trends.
Answer
A couple of things driving that, some project deferrals like Mad Dog 2, which we thought would start up in 2022 and now looks like a 2023 start-up. We’ve got some downtime, plant downtime that shifted from 2022 to 2023. And then, our Permian growth would be a little bit lower in 2023. A couple of things.
One, in 2022, we had the benefit of a lot of prior DUCs that had been sitting that came online, and it boost early production in 2022 a little bit more. And then, we also are reoptimizing some of our development plans to factor in some of the things we continue to learn relative to interactions between wells and benches, how we, you know, space laterals and do single or multi-bench development. So, our revised plan will have some deeper targets, a few more rig moves, and a few more single bench developments, all of which brings that pace down a little bit. So, that’s kind of at the highest level, what is behind the production numbers.
XOM
Analyst question regarding Permian
Answer
Yeah. Thanks, Neil. I would take you back to 2018 when we were talking about our strategy in the Permian. And we had said at that time, our plan was to grow to a million barrels a day of production by 2025.
When the pandemic hit, we basically said there’s going to be a delay in a lot of our plans and pushed out those objectives by about two years, so moving from 2025 to 2027. If you look at my comments and the plans, we’re now forecasting that our Permian production will reach about 1 million barrels a day by 2027. So, very much in line going all the way back to 2018 and then the comments that we made around the pandemic and the delay that was introducing. So, I think that’s the context to think about what we’re doing in the Permian and that development.
If you look at 2021, we added about 90,000 barrels a day of production. 2022, very similar number, 90,000 barrels a day. And that, in part, was what I’d call the organic development and the drilling and the production, as well as clearing our DUCs inventory. So, as we were in the pandemic, obviously, not a lot of incentive to bring production on.
And so, we concentrated our spend on drilling. And then as we got into higher-priced environments, concentrated on clearing that inventory and bringing those wells to production. And so, we were bringing our DUC inventory down. As we go into next year, we’re going to rebuild that inventory, get to an optimum level that we can then use and maintain as we go through the next several years.
So CVX is expecting lower growth in the Permian while XOM plans on increasing production. Both are clearing their DUC inventory.
I find it odd that in BP 2023 Energy Outlook they predict a peak in Total Energy Consumption sometime between now and the next 15 years depending on which combination of factors/policies/trends plays out, yet they give the reason for peak consumption as greater energy efficiency throughout the world.
Conversely, I see an energy peak being due to
-lack of physical supply or
-lack of collective human purchasing power or
-disruption in the smooth function of international trade and industry
I know they wouldn’t hire me since it would be destructive for the brand value.
Quick – think of something we’re using less of because we’re using it more efficiently…
I can see complete global fleet replacement making a difference, is that really going to happen? Even without a lot of population growth, there is still growth in overall consumption and desire for a set of wheels. For a while, we’re going to be adding to the fleet, not replacing it. Just like energy use – yes there are more renewables, on top of ongoing FF use.
I believe the only way total energy consumption will go down is involuntarily. Were it left up to humans, they would choose infinite growth.
“Net zero” – why do they even entertain that fantasy? It’s invalid 5 minutes after they release the report.
“Conversely, I see an energy peak being due to
-lack of physical supply or
-lack of collective human purchasing power or
-disruption in the smooth function of international trade and industry”
Hickory,
Or replace your two times “or” with “and”
yes Hans.
After giving it more thought I see the terminology of ‘gains in energy efficiency’ as referring to a global shift away from fossil fuel combustion in ICE’s and furnaces
with replacement by more efficient mechanisms such as
heat pumps and electric motors supplied by electricity generated from non-combustion sources.
This electrification of civilization can indeed gradually replace fossil fuel use for certain purposes and to some degree,
and it is the most significant method to hold some ground in this retreat against depletion.
Building insulation and change of energy consumption behavior are also big factors.
With that in mind I view those projections in the chart with a slightly less jaundiced perspective.
As we have observed in Europe over this past year, people can and will change fast when faced with energy shortage…chapter 1.
The most obvious statement that somehow gets lost in the jumble-
‘Consumption will drop to match supply’
Interesting year end summary of Europe Energy 2022
https://ember-climate.org/insights/research/european-electricity-review-2023/
Jevons paradox should be taught in schools.
True. But I doubt Jevon’s paradox will apply as readily in a period of sustained global energy contraction.
Stephen,
Our conclusion in https://link.springer.com/article/10.1007/s41247-016-0016-6 is essentially your remark.
Thanks for the link, Schinzy!
RRC Issues Weather Notice to Oil and Gas Group
Texas to Prepare Another Cold Spell. The Railroad Commission of Texas issued a notice to oil and gas pipeline operators to secure equipment and facilities as snowstorms and icy drizzles are expected to spread across the Permian Basin this week, increasing the risk of freeze-offs and blackouts.
Will this affect Permian February production?
https://www.rigzone.com/news/rrc_issues_weather_notice_to_oil_and_gas_groups-31-jan-2023-171924-article/?amp
Biden Administration Recommends Scaled-Back Alaskan Oil Drilling Project — WSJ
1:35 pm ET February 1, 2023 (Dow Jones) Print
By Benoît Morenne and Andrew Restuccia
“This would be the largest single oil drilling project proposed anywhere in the U.S., and it is drastically out of step with the Biden administration’s goals to slash climate pollution and transition to clean energy,” said Jeremy Lieb, a senior attorney with Earthjustice, which sued the federal government over its support of the project.
“Biden will be remembered for what he did to tackle the climate crisis, and as things stand today, it’s not too late for him to step up and pull the plug on this carbon bomb,” he said in a statement.
Biden administration officials recommended moving forward with a scaled-down version of ConocoPhillips’s multibillion-dollar Willow oil-drilling project in the Alaskan Arctic, but the Interior Department raised concerns about the project, signaling more hurdles ahead.
The Interior Department’s Bureau of Land Management issued a final supplemental environmental-impact statement Wednesday that recommends shrinking the project to three drilling sites down from the five ConocoPhillips initially proposed.
Interior Secretary Deb Haaland still has to make a final decision, and her department issued a statement saying that the alternative favored by BLM posed concerns, “including direct and indirect greenhouse gas emissions and impacts to wildlife and Alaska Native subsistence.”
Environmental advocates condemned BLM’s recommendation, saying President Biden was backing away from his commitment to transition the U.S. away from fossil fuels.
The $8-billion development would require drilling on top of permafrost, laying out gravel roads and building out pipelines in Alaska’s National Petroleum Reserve, a 23-million acre reserve managed by the federal Interior Department. ConocoPhillips has said it expects the project will produce 180,000 barrels of oil a day at its peak, and about 600 million barrels of oil equivalent over the life of the project.
Alexander Novak reaffirmed Russia’s commitment to the plan to reduce oil production by 2 million barrels a day.
February 02 / 08:42
Moscow. Alexander Novak confirmed the commitment of the Russian Federation to the plan to reduce oil production by 2 million bpd, agreed upon at the meeting on October 5, 2022. The 47th meeting of the Joint Ministerial Monitoring Committee of the OPEC+ countries took place yesterday.
“The most important decision we have made is not to change the quotas that have been determined since November last year. They will be valid throughout 2023. We intend to monitor the situation on the global market online, as well as monitor the progress of the transaction. The discussion showed that now the situation on the market is quite stable, acceptable prices are formed, based on the balance of supply and demand. All this is due to the timely decision taken by OPEC + in October to reduce oil production,” Novak said.
Now oil reserves in the world are below the average five-year values, and there are many uncertainties in the oil market related to the level of supply and demand. China, emerging from pandemic restrictions, is expected to increase oil consumption.
But inflation expectations for the economies of Western countries remain high, which affects the level of demand for energy, the press service of the Cabinet reported.
Alexander Novak noted the stable situation on the Russian oil market, despite external restrictions: the EU embargo and price ceilings from the G7 countries and their allies.
“The situation with the production and export of Russian oil is stable. All necessary measures were taken to form new supply chains, find sales markets, and transport oil. On February 1, a presidential decree came into force prohibiting the use of language in contracts on the use of Russian oil price ceilings, and explanations to it. In case of violation, measures will be applied to prohibit export deliveries to those counterparties that apply ceilings. It is in Russia’s interests to limit the effect of non-market instruments that can affect not only the sale of Russian oil, but also the situation on the world oil market as a whole,” the Deputy Prime Minister emphasized.
OPEC+ members agreed to hold the next meeting of the Joint Ministerial Monitoring Committee of the OPEC+ countries on April 3, the OPEC+ ministerial meeting on June 4, 2023.
Do you have a link for that?
Thanks
WP
Yes, sure:https://www.angi.ru/news/2905228-%D0%90%D0%BB%D0%B5%D0%BA%D1%81%D0%B0%D0%BD%D0%B4%D1%80%20%D0%9D%D0%BE%D0%B2%D0%B0%D0%BA%20%D0%BF%D0%BE%D0%B4%D1%82%D0%B2%D0%B5%D1%80%D0%B4%D0%B8%D0%BB%20%D0%BF%D1%80%D0%B8%D0%B2%D0%B5%D1%80%D0%B6%D0%B5%D0%BD%D0%BD%D0%BE%D1%81%D1%82%D1%8C%20%D0%A0%D0%BE%D1%81%D1%81%D0%B8%D0%B8%20%D0%BF%D0%BB%D0%B0%D0%BD%D1%83%20%D1%81%D1%83%D1%82%D0%BE%D1%87%D0%BD%D0%BE%D0%B3%D0%BE%20%D1%81%D0%BE%D0%BA%D1%80%D0%B0%D1%89%D0%B5%D0%BD%D0%B8%D1%8F%20%D0%B4%D0%BE%D0%B1%D1%8B%D1%87%D0%B8%20%D0%BD%D0%B5%D1%84%D1%82%D0%B8%20%D0%BD%D0%B0%202%20%D0%BC%D0%BB%D0%BD%20%D0%B1%D0%B0%D1%80%D1%80./
Hello… checking to see why my newest comment was flagged as Spam.
Dennis.. would you mind reposting my comment that went into spam. I tried to repost but it won’t.
steve
Global Net Oil Export Math For Dummies…
While the RED QUEEN SYNDROME is currently doing serious damage to the Global Oil Industry, with the Natural Decline Rate (estimated & observed declines in legacy production without new wells, EOR, or investment) now likely over 10 million barrels per day each year, the other negative problem is the falling Net Oil Exports.
Thus, we have TWO, not ONE, Nasty Factors destroying the very energy source that allows us to enjoy the STAR TREK REPLICATOR AMAZON ECONOMY; Push a button on the computer, and in 1-2 days, the product magically appears on your front door.
While Jeffery Brown has been absent from this blog, the NET OIL EXPORT MATH is still doing harm silently behind the scenes.
If we look at this chart from some of the major Oil Exporting Regions of C & S America, Africa & the Middle East, we see that since 2001, Net Oil Exports have declined by 1.6 mbd while production has increased by 3.8 mbd.
You can see that both C & S America & Africa are experiencing the largest declines in Net Oil Exports.
Within the next 5-10 years, the Global Oil Industry Red Queen Syndrome & Net Oil Export Math will change the world as we know it.
GOD HATH A SENSE OF HUMOR…
steve
Understand oil economics for SMART investors
ConocoPhillips Reports Fourth-Quarter, Full-Year 2022 Results and 176% Preliminary Reserve Replacement Ratio; Announces 2023 Guidance and Planned Return of Capital of $11 Billion; Declares Quarterly Dividend and Variable Return of Cash Distribution
HOUSTON–(BUSINESS WIRE)–February 02, 2023–
ConocoPhillips (NYSE: COP) today reported fourth-quarter 2022 earnings of $3.2 billion, or $2.61 per share, compared with fourth-quarter 2021 earnings of $2.6 billion, or $1.98 per share. Excluding special items, fourth-quarter 2022 adjusted earnings were $3.4 billion, or $2.71 per share, compared with fourth-quarter 2021 adjusted earnings of $3.0 billion, or $2.27 per share. Special items for the current quarter were primarily driven by impairment of certain aged, suspended wells and corporate expenses.
Full-year 2022 earnings were $18.7 billion, or $14.57 per share, compared with full-year 2021 earnings of $8.1 billion, or $6.07 per share. Excluding special items, full-year 2022 adjusted earnings were $17.3 billion, or $13.52 per share, compared with full-year 2021 earnings of $8.0 billion, or $6.01 per share.
Full-Year Review
Production for 2022 was 1,738 MBOED, an increase of 171 MBOED from the same period a year ago. After adjusting for closed acquisitions and dispositions, the conversion of previously acquired Concho-contracted volumes from a two-stream to a three-stream basis and 2021 Winter Storm Uri impacts, production decreased 16 MBOED or 1% from the same period a year ago. Organic growth from Lower 48 and other development programs more than offset decline; however, production was lower overall, primarily due to fourth quarter weather impacts and downtime in Lower 48.
Reserves Update
Preliminary 2022 year-end proved reserves are 6.6 billion BOE, with total reserve replacement ratio of 176%, including closed acquisitions and dispositions and market factors. Reserve changes excluding closed acquisitions and dispositions result in an organic reserve replacement ratio of 177%.
Outlook
The company’s 2023 total capital expenditure guidance is $10.7 to $11.3 billion, which includes $9.1 to $9.3 billion for base capital and $1.6 to $2.0 billion for anticipated major project spending at NFE, NFS, PALNG and Willow. Base capital includes funding for ongoing development drilling programs; exploration and appraisal activities; base maintenance; and projects to reduce the company’s Scope 1 and 2 emissions intensity and fund investments in several early-stage low-carbon opportunities that address end-use emissions.
Exxon soars to record annual profit as analyst calls Permian Basin ‘key part’ of growth
8:36 am ET February 1, 2023 (MarketWatch)
By Claudia Assis
Exxon stock among top energy gainers in S&P 500
Exxon’s Permian production hit a record in the quarter of more than 560,000 oil-equivalent barrels a day, growing by about 90,000 oil-equivalent barrels, Exxon said.
The company produced about 272,000 oil-equivalent barrels a day in the Permian Basin in 2019
The Permian is “a key part of [Exxon’s] growth engine,” Alastair Syme at Citi said in a report.
The basin “has had its prepandemic output target restored and which signals output will be 80% bigger in four years,” Syme said.
Exxon guided its Permian holdings to hit production of about 1 million oil-equivalent barrels by 2027, from a previous forecast of about 800,000, Cowen analyst Jason Gabelman said in a note.
That appears to be in line with expectations, and it is “an encouraging sign,” Gabelman said.
Chief Executive Darren Woods told investors on a call that Exxon’s quarterly earnings “clearly benefited from a favorable market,” but that the energy giant had laid the groundwork years before, aiming to take advantage of an undersupplied market.
“We leaned in when others leaned out, bucking conventional wisdom,” Woods said. “We continued with these investments through the pandemic and into today.”
Shares of Exxon have gained more than 52% in the past 12 months, contrasting with losses of around 4% for the Dow Jones Industrial Average and about 10% for the S&P. Exxon was removed as a Dow component in 2020
I think an update of the original ELM combined with a recent Mazamascience data set would be really interesting.
Done
i would think the article may have some interest here.
https://oilprice.com/Energy/Energy-General/WoodMac-2022-Saw-Bigger-Better-And-More-Strategic-Oil-Discoveries.html
Peak Oil is Peak WoodMac.
Expect optimistic projections from here on out.
Interesting article positing shale faces headwinds this year as output per lateral foot falls for the first time since 2015
https://oilprice.com/Energy/Crude-Oil/Will-US-Shale-Ever-Return-To-Its-Glory-Days.html
Note that the Novilabs analysis is for the Midland basin only.
Consider the chart that follows from a Novilabs analysis in Dec 2022 at link below
https://novilabs.com/blog/permian-update-through-august-2022/
click on chart for larger view
US Horizontal Oil Rig (HOR) count and Permian anf Other (rigs not in Permian basin). From pivot table at link below
https://rigcount.bakerhughes.com/na-rig-count
US HOR count is 556 down 4 from last week, Permian HOR is 330 down 3 from last week, data is for week ending Feb 3 2023. The 52 week high HOR count for the Permian basin was for week ending Jan 13, 2023 at 334 rigs.
Question for George K.: Why has the GOM been dropping so many rigs lately?
Greenbub,
GOM oil rig count from baker Hughes. There seems to be a seasonal decrease in GOM oil rigs in Jan-March.
Thanks, Dennis.
“Russia’s budget revenues from oil and gas plunged in January by 46% compared to the same month last year due to the sanctions on Russian oil exports, which led to a slump in the price of Russia’s flagship crude grade.”
Dennis, my weather app is showing 6 degrees in boston and -6 in Pittsfield, how is that tesla doing in that type of weather, what range to you get when the heat is on? I am curious. Texas just made is through yet another major winter storm. no electricity for 2 days, so I sat in my diesel Tahoe drinking coffee, heated seats, 76 degrees inside with radio and it has a range of over 600 miles, doing my part with 24mpg.
I still think electric vehicles are hype, but over the last few months we now have a few cruising in this area of heaven on earth. So some, even Texans, are seeing it a different way. I expect someday to be give them a ride when they are parked on the side of the road with no power, but will be happy to do so.
Texastea,
From what I have read the tahoe diesel gets about 500 miles on a full tank. The Model Y goes about 330 miles. Currently the temperature is about minus 22 F where I am and the Y is doing fine. Just like a diesel the range is lower at minus 28 F. If you like diesel buy that, the Tesla Model Y was the fourth best selling vehicle worldwide in 2022. In 2023 it will likely be number 2 or possibly number one.
See https://www.focus2move.com/world-car-market/
A new update on US November oil production has been posted.
https://peakoilbarrel.com/us-november-oil-production-shows-small-drop/
A new open thread Non-Petroleum has been posted.
https://peakoilbarrel.com/open-thread-non-petroleum-february-3-2023/