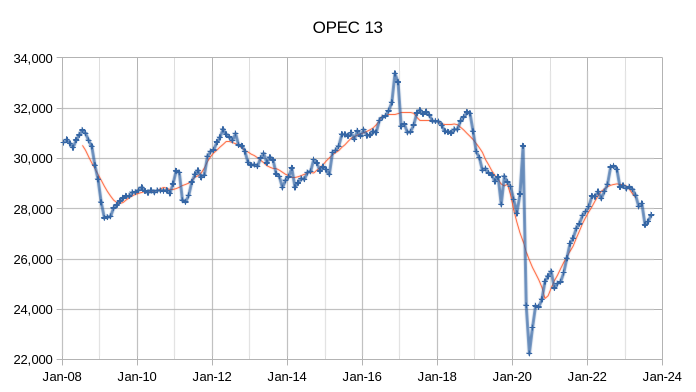
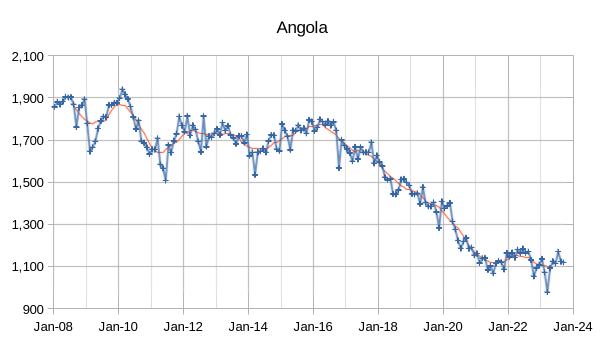
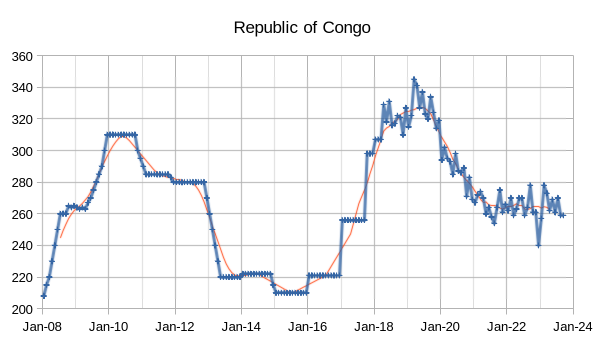
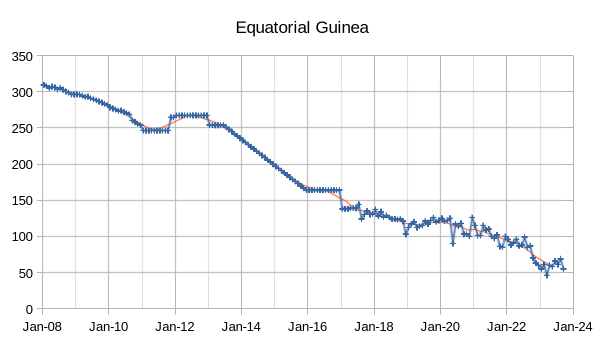
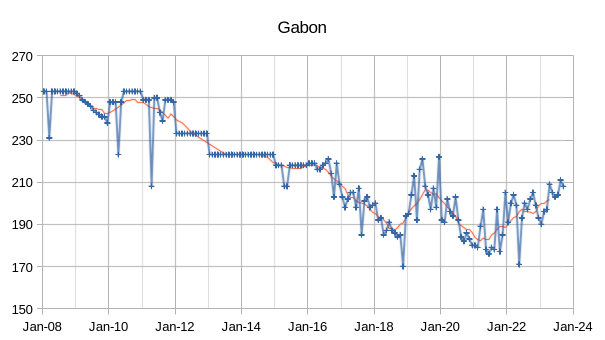
The OPEC Monthly Oil Market Report (MOMR) for October 2023 was published recently. The last month reported in most of the OPEC charts that follow is September 2023 and output reported for OPEC nations is crude oil output in thousands of barrels per day (kb/d). In many of the OPEC charts that follow the blue line with markers is monthly output and the thin red line is the centered twelve month average (CTMA) output. The charts for the International Energy Outlook (IEO) will report crude plus condensate (C+C) output with annual output estimates up to 2035.
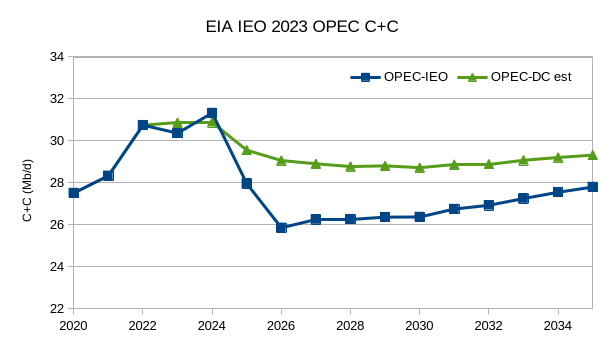
The IEO reference scenario has a sharp drop in OPEC output of 5.5 Mb/d from 2024 to 2026, an alternative scenario (OPEC-DC est) is presented which will be discussed after the OPEC part of the post.
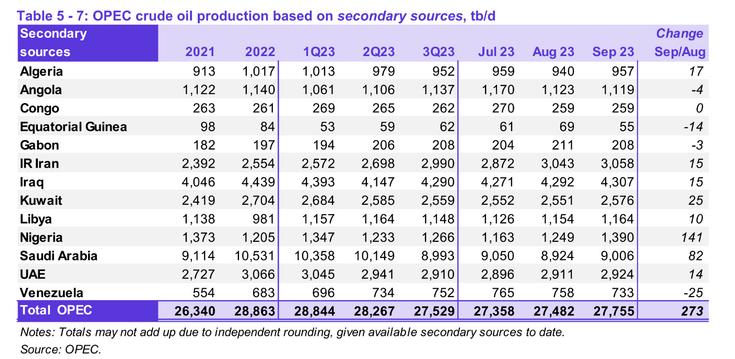
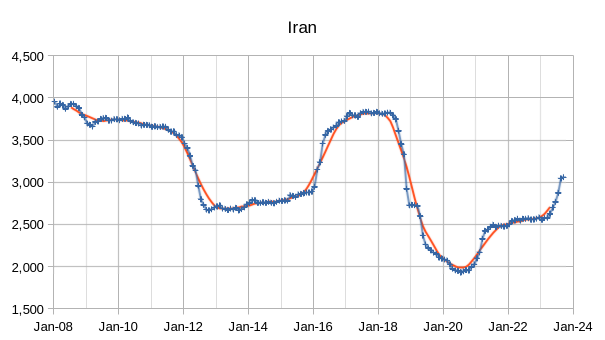
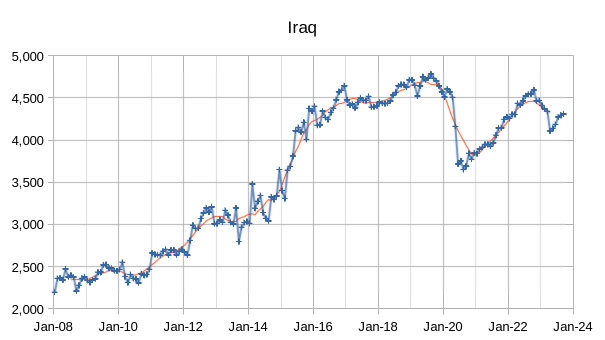
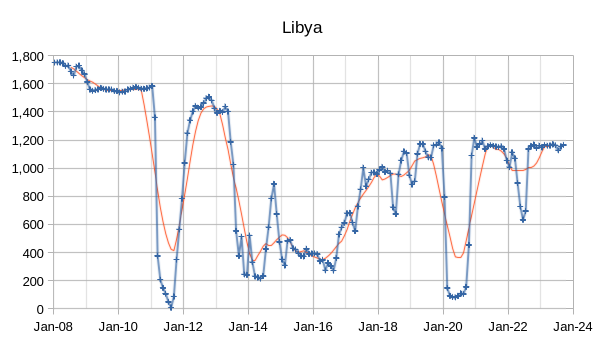
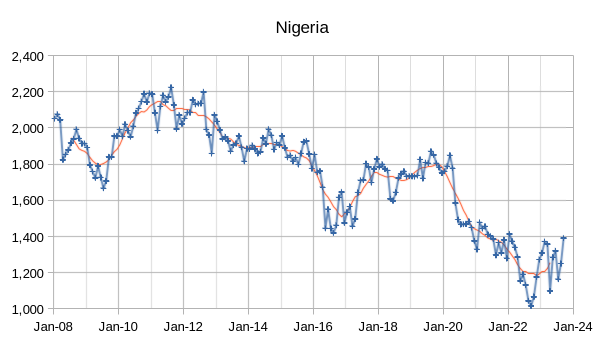
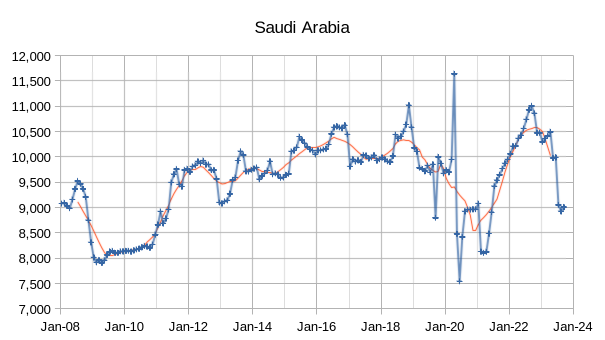
OPEC crude output was revised higher in August 2023 by 33 kb/d compared to last month’s report and July 2023 OPEC crude output was revised higher by 22 kb/d. When the World was at its CTMA peak for C+C output in 2018, OPEC crude output was about 31300 kb/d and by September 2023 OPEC crude output had fallen to roughly 3545 kb/d below the CTMA peak in 2018.

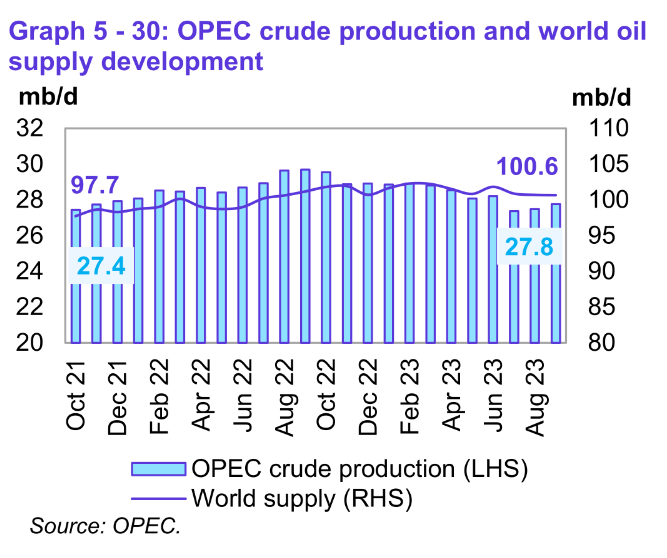
Preliminary data indicates that global liquids production in September was 0.1 Mb/d less than last month
and averaged 100.6 Mb/d. World liquids output increased about 2.9 Mb/d in the past 23 months (from 97.7 Mb/d in October 2021).
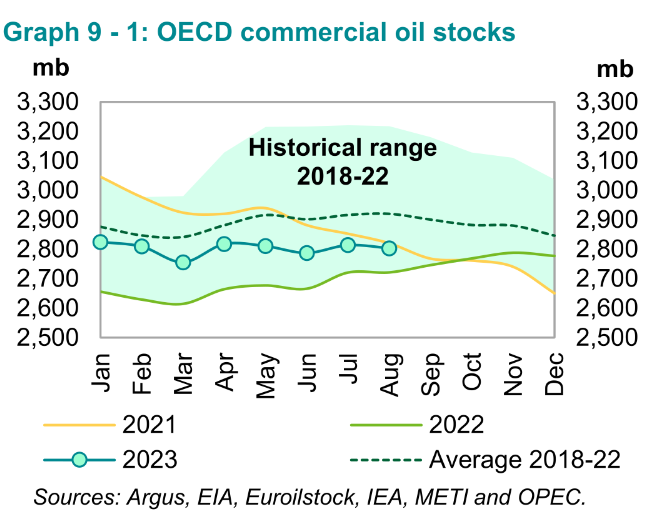
Preliminary August 2023 data sees total OECD commercial oil stocks down m-o-m by 11 Mb. At 2803 Mb,
they were 82 Mb higher than the same time one year ago, but 117 Mb lower than the latest five-year
average and 182 Mb below the 2015–2019 average. As World Oil stocks continue to fall the risk of an oil price spike will increase.
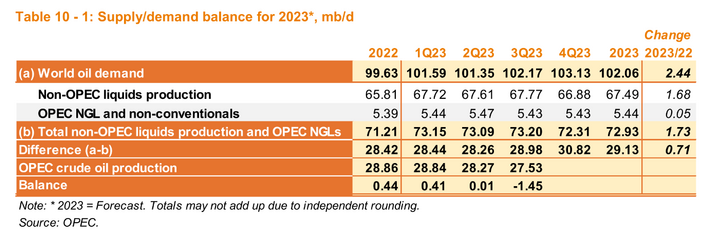
There was a significant draw on World oil stocks in 2023Q3 of about 133 Mb, if OPEC estimates of World Supply and Demand for Oil are correct. A continuation of OPEC cuts in 2023Q4 could lead to another 300 Mb of stock draw if OPEC estimates for oil supply and demand are correct in 2023Q4.
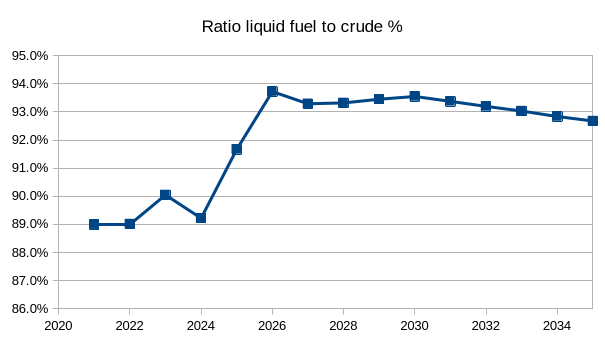
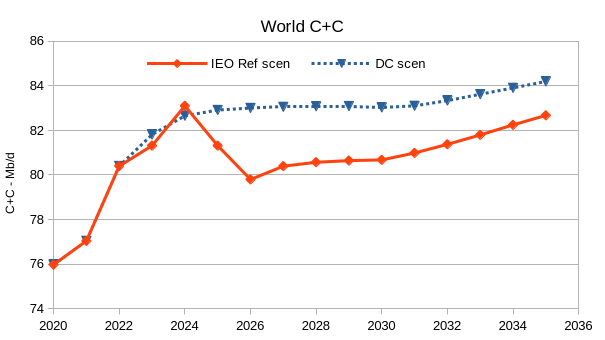
Now a quick discussion of the EIA’s IEO 2023. The IEO reference scenario for World C+C output has a sharp drop in crude output from 2024 to 2026 of about 3.3 Mb/d, but this is not reflected in their estimates for demand for the main liquid fuels (gasoline, diesel, jet fuel, and residual fuel). From 2021 to 2022 the ratio of these 4 liquid fuels in barrels of oil equivalent to C+C produced was about 89%, but the ratio jumps sharply from 2024 to 2026 as shown in the chart below to over 93%.
My alternative scenario (DC scen) for World C+C assumes the ratio of liquid transport fuel to C+C production rises gradually from 89% in 2022 to 91% in 2031 and then remains at that level until 2035 and assumes the quantity of liquids fuel demand is unchanged. My expectation is that after 2030 the demand for transportation fuel is likely to be lower than the EIA reference scenario, but I did not add that assumption to the DC scenario presented below. The OPEC-DC est presented in the second chart of the post simply subtracts the EIA’s IEO reference scenario for non-OPEC C+C output from the World C+C- DC scen presented in the chart below. I also expect that non-OPEC output may be slightly lower than the EIA has published in the IEO 2023 reference scenario and that OPEC C+C output will likely need to be about 30to 31 Mb/d from 2025 to 2030 in order for World C+C to match the DC scenario in the chart below.
150 responses to “OPEC Upate October 2023 and EIA International Energy Outlook 2023”
Thanks for the work Dennis.
I’d say the current M&A activity with the super majors reflects a lack of exploration opportunities and discovery success as much as anything (i.e. drill on Wall Street rather than some risky location offshore). You can only go on buying back your own shares for so long if you want to remain as a recognisable operating company. Hess is a smaller company than Pioneer (at least after the Pioneer purchase os Parsley in 2021), with about half the reserves, 40% of the equity and double the debt; but it is one of the bigger independents around and with, albeit declining, assets in Africa and GoM that might fit in with some Chevron activity there.
About five years ago I started looking at reserves and financial information for dome of the largest E&P companies with SEC listing. In total I looked at 47, since then 15 have been purchased or merged.
Opec drilling (ex Iran, which Baker Hughes doesn’t record) is remaining fairly steady). Iran is probably increasing given the new gas developments and rising oil supply.
It may be noteworthy that the decline slope in OPEC currently closely parallels that in the years before Covid. If this was a normal collection of fields the only conclusion would be post peak decline, but with quotas and sanctions it will need a year or more data to know, and even then there will always be some doubt (e.g. with TotalEnergies developments in Iraq due).
George – It would be silly to think that OPEC is not in decline. Right now the 5 year trend is 2.5% annual decline.
Assuming OPEC is producing ~27 mb/d (one third of world supply), 2P reserves (190 Gb) will only last ~25 years with 2.5% decline. That will be a loss of ~10% every 4 years.
An alterntive is that the loss could increase to 5% annually, in that case OPEC will run out of 1P reserves by 2035.
Kengeo,
One might also consider that the World was oversupplied with oil from 2018 to 2022 and OPEC cut output in response, OPEC still seems to believe the World is oversupplied with oil and might only change their thinking when Brent oil prices remain above $90/b for a year or more. If the OPEC decline continues with Brent oil prices remaining above $90/b for more than a year, then my thinking would change.
Sounds more like $110… “Andurand Says Oil Must Hit $110 Before Saudi Arabia Eases Supply Curbs”
https://www.bloomberg.com/news/articles/2023-10-24/andurand-says-crude-oil-needs-to-hit-110-before-saudi-arabia-eases-supply-curbs
Your point doesn’t make sense though: In 2018/2019 oil price was ~$50 and OPEC production was >31 mb/d. Fast forward to production in August 2022 of ~29 mb/d, with June ’22 price of $120.
Kengeo,
Prices were high for a short time due to war in Ukraine and uncertainty arising from that. Brent was over $100/b for about 6 months in 2022 (average monthly prices.) In any case if prices remain over $90/bo for a year or more I believe we will see an increase in OPEC crude output to about 29 Mb/d (about 30 to 31 Mb/d for C plus C output).
Another possibility is they know they are in decline and justify the cut for other reasons. Looking at the d3cline trend from 2017, this is highly likely.
This is personnally my line of thinking and i also think that we would probably see “soon” if it was the case or no.
Frenchfries,
I agree we will know soon, probably in 6 months. I doubt th recent decline will continue, it has been due to oversupply.
Looks like we’re about to witness a miracle. Somehow refiners are going to become 5% more efficient in 2024-2026 and stay there. Maybe just maybe oil production declines more than 3.3 mbd like 6.6 or 9.9 I guess refiners will become 10% or 15% more efficient. Heavens if oil production declines 50% refiners will become 100% more efficient this is great news!!!!
JT,
It seems to me that someone at the EIA got some inputs incorrect in their model. I would have thought someone would have double checked when they saw the drop in C plus C output at the World level with basically no change in demand for crude.
This might make sense if there was an oversupply of oil, but it looks like that is also not very likely over the next few years.
In short a poor job by the EIA on their most recent IEO reference scenario.
Interesting discussing of GOR in post below from Novilabs
https://novilabs.com/blog/why-is-gor-relatively-stable-in-the-permian/
Excerpt from concluding paragraph:
I do not expect the Permian to suddenly get much gassier; instead it should follow a slow, steady rise as its wells get older. But there is latent potential for a big increase in gas production, though that would be driven by external factors (price, offtake) rather than intrinsic reservoir properties of the Wolfcamp/Spraberry/Bone Spring plays.
Interesting that they don’t break out the differences in GOR among the 3 formations mentioned. Do they not have access to the formation designations per well?
Chart below looks at the ratio of World C plus C production to World total petroleum liquids consumption (includes LPG and biofuels).
The scenario below (DC-scen2) assumes the ratio of C plus C to total liquids for the World follows the trend line in the chart above up to 2035 (trend line is based on 2005 to 2022 EIA annual data). It is assumed that the EIA’s IEO 2023 reference scenario for total liquids is correct and the ratio is used to calculate World C plus C output from 2023 to 2035. The scenario looks reasonable (a bit on the high side in my view by 750 kb/d) up to 2030, but after that I think the EIA’s transportation assumptions are flawed because they anticipate a very slow uptake of electric transport. They will likely adjust this every 2 years as they adjust to the reality that ICEVs will be replaced by BEV far more quickly than they have forecast. My guess is that World C plus C output will decline slowly from 2028 to 2032 and the decline rate will gradually accelerate after 2032. If self driving cars gain approval by 2032 in many developed nations the decline may be quite steep for several years as the number of land transport kilometers by BEV will quickly rise and demand for crude will crash.
25/10/23
Middle East oil supply situation as Gaza war brings world into unknown territory (part1)
http://crudeoilpeak.info/me-oil-supply-situation-as-gaza-war-brings-world-into-unknown-territory
Excellent information.
IEO 2023 Brent Oil price scenarios in 2022 US$ per barrel. Reference scenario average price about $90/b from 2023 to 2030.
I comment upon Dennis’ blogpost above in this blogpost of mine, and try to understand what it means for global net oil exports:
https://skogslars.blogg.se/2023/october/update-on-oil-the-decline-of-global-oil-production-continues-and-some-calculations-of-the-present-decline-in-global-net-oil-exports.html
Lars,
It makes more sense to me to look at net exports at the World level and not exclude China and India as they are a part of the World market and will be subject to the same market forces as all other nations.
Using the Statistical Review of World Energy (link below)
https://www.energyinst.org/statistical-review
I get the following for World net exports of petroleum from 1993 to 2022 in kb/d.
If we use OLS to fit an exponential curve to the data from 2016 to 2022 the average annual rate of decline for World net exports is 1.64%. If we use a linear trend line the annual rate of decrease is 929 kb/d over that period.
If we assume linear decline at 929 kb/d per year, then net exports end in 2082, if we assume exponential decline at 1.65% per year net exports continue for a long time (in 2300 they would still be over 500 kb/d) unless the exponential rate of decline increases over time.
Note that I do not think we know what the future decline of net exports will be, they may fall steeply if demand for oil wanes due to a transition to electric transport.
Dennis, does that include crude and refinery products (gasoline diesel etc.)?
If so, do you know if the data collectors had a way to avoid double counting…crude exported from one country, then refined in another with the output products being exported to another)?
Hickory,
Yes it does include products and crude oil. I believe when the accounting is done, the imports and exports of crude and products are kept separate.
As an example nation X imports 100 million barrels and exports 50 million barrels of crude oil, net exports are minus 50 million barrels. Nation X also imports 50 million barrels of petroleum products and exports 75 million barrels of petroleum products, net exports of products are 25 million barrels.
It is impossible to know if the counts are being done correctly. I work with the data I have available.
Total net exports of crude plus products is -25 million barrels for nation X and they would not be included in the group of nations that are net exporters of crude plus petroleum products.
Dennis: As you may know, I build upon Jeffrey J. Browns calculations. I wonder how his numbers can be so different from “Statistical Review of World Energy’s” numbers. According to Brown, global net oil exports peaked in 2005, and was at about 30 mbd in 2021 (and this is not only ANE oil, i.e. global net oil exports minus China and India’s net oil imports). According to your graph above, global net oil exports peaked in 2016-2017, and was at 51-52 mbd in 2020-2021, and then rose to 55 mbd in 2022-2023. I don’t understand how the differences can be so great, and I trust Brown more than an energy institute (for example IEA and EIA have not won my trust, not the least). Brown is the one who have the most mathematical expertise in the field, of all involved. But I will calculate a scenario based on your data, anyway. I will link to that later on. I will also add that I have confronted many different sets of data in this field, all differing wildly, so I’m used to the confusion. But thank you for your answer, it gave me something to work on.
Lars,
J Brown may be doing crude only estimates. Not sure.
Do you know where Mr. Brown gets his data?
Dennis, I think you’re right (if you also add condensates), because the numbers of “Statistical Review of World Energy” is about 25 mbd higher than Brown’s numbers, which is exactly the difference between “crude condensate” and “All Liquids” in overall global oil production numbers (and now I don’t mean oil exports). I actually figured it out before I read your comment.
I think, by the way, that Brown is justified in his way of counting only crude condensate when calculating oil exports, because we cannot really count on the unconventionals in our economy, if we seek sustainability, we cannot rely on them for a very long time to come, because they are so very expensive, and increasingly so, exponentially.
But your answer in some way confirmed my calculations, because I have indeed said in my book that Brown counted only crude condensate, if i remember it correctly.
Lars,
Note that there is crude plus condensate that is from tight oil and oil sands, these are what I call unconventional crude plus condensate (C plus C).
For World C plus C exports divided by World C plus C production, I get the following for the percentage of C plus C that is exported globally. (OPEC export data used for 2019 to 2022 as there is no EIA export data for those years.)
Lars,
Took a look at EIA data available only through 2018
https://www.eia.gov/international/data/world
The chart below is for crude plus condensate only, the previous chart included crude and petroleum products.
Do you have any links to recent work by Jeffrey Brown?
Older post by Mr Brown at Oil Drum
http://theoildrum.com/node/2767
A later post
https://energybulletin.org/peak-oil-versus-peak-exports/
The second paper (from October 2010) presents two scenarios that have Global net exports falling from 10 to 15% from 2015 to 2015. The historical result was about a 2% fall in Global net exports of crude plus condensate from 2010 to 2015 and then a 7% increase from 2015 to 2018 (2018 was 5.6% above the Global net export level in 2005).
Dennis, EIA’s data look strange. Brown has it the other way around, he says global net conventional oil exports peaked in 2005 (which is reasonable, because overall conventional oil pretty much peaked by then) at 45 mbd, and then has it declining by 15 mbd to 2021, when it was at 30 mbd. We then have to add one or two mbd for the time up to February 2023 (when we reached the post-pandemic peak of overall global oil production), because of the recovery of oil production from the pandemic, and then subtract a few mbd for the time since February 2023, when the overall oil production declined by almost 1 mbd, and oil exports declined much faster, which takes us to 28-30 mbd of global conventional, crude plus condensate net oil exports, today.
I cannot understand how EIA can have the conventional oil exports growing since 2005, because conventional oil has been on an undulating plateau since 2005 (maybe the absolute peak was in 2016? People say so. But the difference was not big), and conventional oil exports can decline even with growing overall oil production, if the growth of the domestic use of oil by the oil exporting countries exceed the growth in overall oil production, which in fact has happened in reality (last year Saudi Arabia’s GDP grew by 8,7 %. Compare that with the slow growth of conventional oil between 2005 and 2016). According to Brown, not only has oil exports declined since 2005, they have done so at an accelerated rate of decline. And this happened with an undulating plateau of overall conventional oil production. Contemplate then how fast oil exports will decline with an accelerated rate of decline in overall conventional oil production, which will happen according to Hubbert and his “Hubbert curve”.
But even if I’m wrong, it does not disturb or affect the arguments in the following blogpost of mine, where I try to calculate an oil export forecast or future scenario with the data you gave me from the “Statistical Review of World Energy” (I add a calculation based upon your latest graph above):
https://skogslars.blogg.se/2023/october/calculating-a-scenario-for-global-net-oil-exports-based-on-dennis-coynes-numbers-2.html
Lars,
Net exports are for crude plus consdensate, their is no distimction on World oil markets between conventional and unconventional oil. They are not my numbers, they are from the Statistical Review of World Energy, the EIA, and OPEC, as to future net exports, that simply depends on the assumptions one makes about future output and future demand.
An infinite set of different assumptions exist and an infinite number of future scenarios can be created. The chance of picking the correct scenario from an infinite number of future scenarios is exactly zero.
Global Exports of Crude oil (OPEC data) and C plus C (EIA data).
Found data at OPECs annual Statistical Bulletin for 2019 to 2022, added to EIA data from 1993 to 2018 on chart below.
https://asb.opec.org/data/ASB_Data.php
Thank you, Dennis, I appreciate your charts, it gives me something to work on. I myself am bad at finding such stuff. The OPEC chart was better, but not at all satisfying.
I changed that “based on Dennis Coyne’s numbers” from the headline to my blogpost . It’s of course true, it wasn’t your numbers.
I’ll make a calculation based on that last chart, tomorrow.
We can, for sure, make a lot of scenarios, but we should be able to find a way to say “at least we will lose the oil exports before this and that year”, i.e. “best case scenarios”. Those are pretty useful.
Lars,
I would be cautious about using the same assumptions that Jeffrey Brown made in 2010, if you look at net exports historically compared to what was being forecast (net exports fall to zero by 2015 or 2020 or some such scenario). From 2005 to 2022 global net exports fell from about 39 Mb/d to 38 Mb/d, it may be that looking at total exports rather than net exports is more useful.
To Lars:
Jeff Brown used his own ELM to declare a major export oil crisis like in 2006 or so. Have you corrected for why his system was structurally wrong in the first place?
Lets consider the oil price Saudi Arabia wants (needs). If SA earns enough money from sales of crude, its amount of currency reserves increase. (https://www.ceicdata.com/de/indicator/saudi-arabia/foreign-exchange-reserves) If it don’t earn enough, reserves decrease.
A diagram of Brent crude price in BOE and monthly change of SA currency reserves is attached.
The thick black line indicates a monthly change of zero USD. The correlation coefficient between oil price and monthly change is about 0.6, indicating that the oil price is not the only thing influencing the change rate. But it has a large effect.
In 2018 and 2022 have been larger time periods when the reserves increase. The zero line hits the price at about 7 BOE, indicating SA needs about 7 BOE to stabilize its currency reserves.
But in detail, in 2018 the increase happened at 7 BOE, in 2022 at 9 BOE. So we see a strong sign that SA needs more money now and in the future, about 10 BOE. Today, 10 BOE is equivalent to 113 USD. So we can expect, that SA will restrict oil production, as long as the oil price is below 110 USD.
Berndt,
Interesting analysis, thanks.
It might be better to look at the product of exports times Brent price to evaluate changes in currency reserves. In some cases (such as the second half of 2023) Brent price increases because of Saudi cuts in output so in that case price increases, but Saudi petroleum exports decrease due to lower output and net revenue may decrease.
If net revenue decreases due to lower exports, SA will drop their cuts. They are no idiots.
According to the diagrams above, today they have cut about 1 Mbb/day or even more.
Interestingly, with the export numbers, and the oil price numbers it should be possible to calculate limit values for their production costs per barrel.
The Saudi’s and the UAE have both been selling US treasuries in large quantities. The official story is moving away from dollar.
The official story is BS. Treasury selling isn’t being done from a position of strength. Just like in China and India. They are selling treasuries to plug holes in dollar funding. Problem is as they continue selling treasuries to get dollars the collateral they use to borrow dollars leaves. They are basically spending their rainy day account to keep the wheels spinning.
The burning of currency reserves will continue until there is nothing left to draw from.
???
You can take US bonds as security to lend dollars.
You sell the bonds to spend the money directly.
At the momwnt there is still a fight between US / Wallsteet and SA/UAE about oil price.
As long there is enough commercial stock prices can shift everywhere the traders want…it only can get more expensive when the tank bottom becomes visible. Just my opinion with all the BS I can read on the financial sites.
At the start of the Ukraine war $300 billion of Russian currency reserves were directly confiscated.
China on the other hand has lost a trillion in currency reserves. Globally last time I checked which was probably two months ago, almost $4 trillion in currency reserves have disappeared.
Put two and two together and it’s highly likely these reserves were used to balance out ledger entries on the balance sheets of dollar providers in Eurodollar system.
That’s why these reserves disappeared instead of showing up somewhere else.
Global money supply is based on available collateral and willingness of banks to accept collateral and make loans.
Eurodollar market can contract violently without us directly being able to observe what is actually going on.
That’s why oil can actually go to $25 even when the storage tanks are empty and funding dries up in the shale business.
HHH,
Remind us when you expect this to happen, $25/b oil prices that is for a monthly average price for WTI crude? Note that the future is not an answer. Give us a window of 12 months for your best guess.
XOM, Conoco Philips, and Chevron will have no difficulty securing financing for tight oil development.
2024 is shaping up to be a hell of a year. US treasuries yielding the same as emerging markets bonds. Which is a huge problem for emerging markets.
Janet Yellen over at the treasury issuing massive amounts of new debt which will continue putting upward pressure on yields. And the dollar as money is leaving banks and emerging markets for risk free yields in treasuries and money market funds.
US debt is extremely attractive right now. And as a reminder the dealer banks are required to buy the debt. Which is why treasury auctions will remain over subscribed.
Certain parts of the world. Important parts are being starved of dollars. China in particular. China’s dollar problem is the world’s dollar problem. As they circulate dollars through the global economy through imports/exports.
Dollars are being locked up in the US banking system instead of circulating through global economy.
Currencies other than the dollar will continue taking a beating. This is a repeat of 2008. Sure the symptoms will look slightly different this go around. But the problem is the Eurodollar just like it was in 2008.
And it not necessarily the amount of dollars being the problem. It’s the lack of circulation of dollars that is the problem. And the incoming repricing of mortgage related collateral due to higher interest rates.
Futures markets are highly leveraged bets done via the usage of collateral. The repricing of collateral is the greatest threat to oil prices currently.
So watch MBS and housing prices. As housing prices and commercial real estate values fall. The value of collateral used in REPO market falls.
Like it or not it’s going to take a crisis to get the FED to reverse course and cut rates at this point. In the meantime collateral will be getting repriced little by little then all at once when a full blown crisis is upon us.
As the value of collateral declines there simply can’t be the same value of loans made using said collateral. Going to be far less dollars available to chase prices higher.
Treasuries have already been repriced lower but the MBS’s haven’t in the same way or to same extent yet. It’s coming though and a huge amount of loans simply won’t be rolled over at higher interest rates.
2008 was a collateral shortage. As collateral got repriced there was simply not enough enough collateral to back the current value of all the loans that had been made.
Tax receipts have already fallen by about 20%. As collateral gets repriced a property values fall tax receipts will fall even further. In the end interest rates go back to zero or negative.
Which is another reason why US treasuries are so attractive right now.
It’s also not just treasuries being repriced being the problem. The problem with collateral is way worse than just repriced treasuries.
There is about $4.5 trillion of MBS (mortgage backed securities) that are pledged for dollar loans to do all kinds of financial engineering. Including betting on higher oil prices via futures.
Some of these MBS’s are commercial real estate back securities. Which are likely to get repriced as these loans start to have to be rolled over.
But even a relatively small repricing of collateral can have huge impact on the availability of dollars to be loaned.
We can go from everything seemingly being ok to everything is definitely not ok fast.
“We can go from everything seemingly being ok to everything is definitely not ok fast.”
It is always that way…every single day. When things seem calm and stable
that is just an illusion.
https://market-ticker.org/akcs-www?post=249925
Cash Furnance companies that make money by arbitraging interest rates that are declining.
Are starting to fall apart in a rising interest rate environment! and there are A LOT OF THEM.
Buckle Up!
Thanks HHH,
How the international currency system has evolved over the last 150 years is given in Barry Eichengreen’s Globalization of Capital, now in the 3rd edition. He seems to add for each new edition the developments during the previous decade. (My guess, since I only have the 3rd edition)
https://www.reuters.com/world/americas/argentina-fuel-pump-crisis-deepens-government-threatens-export-halt-2023-10-30/
Argentina fuel shortages.
“The South American country, a major shale oil and gas producer, has suffered shortages of petrol and diesel since late last week because of domestic refining problems and as a lack of dollars has delayed imports.”
I looked at some oil trader boards.
The sentiment here is only the Israel crisis keeps the price up, the market is again in a surplus from US production.
To Ron and the crew, I have decided to remove Riyadh from my list, since MbS has shown progress in world affairs,
Best regards, Laplander
Interesting comment from Novilabs on lateral lengths and the effect on normalized output per foot of lateral.
https://www.linkedin.com/posts/ted-cross-8520b635_urtec-oilgas-permian-activity-6960610485951987712-jCww?utm_source=share&utm_medium=member_desktop
and full paper can be accessed at link below
https://novilabs.com/resources/urtec-2022-the-diminishing-returns-of-lateral-length-across-different-basins-id-3723784/?trk=public_post_comment-text
Another interesting comment from Novilabs at link below
https://www.linkedin.com/posts/ted-cross-8520b635_can-you-use-unconventional-well-performance-activity-6955576058066735104-kHzF/?utm_source=share&utm_medium=member_desktop
Another excellent paper can be found at the link below by contacting Novilabs.
https://novilabs.com/resources/urtec-2021-unconventional-well-performance-over-time/
Nice with some numbers. And they are worse than they look:
” we found ~80-90% production efficiency for 12,500′ laterals compared to 5ks.”
Looks like the 12.5er are only 10 or 20% worse than the 5er. No:
The first 5k of a 12.5er is a 5er (this is 100%), so the last 7.5 are 15%-30% worse (hope I calculated correct), letting a lot of oil in the ground.
Eulenspiegel,
Many proders claim the capital cost of the well in $/foot drilled and completed decreases when lateral length increases, if we assume the decrease in cost is about 25% when going from 5000 to 10000 feet and that EUR per foot of lateral decreases by 15% at 10k vs 5k, then under these assumptions capital cost per barrel produced is reduced by about 12% which would tend to increase profits. Something like this may be the reason lateral length has been increasing.
Yes, it’s an optimization from cash earned now at the cost of good acres drilled up with less recovery rate. The thing Mike Shellman always tells.
Now in numbers – it looks like that the last few 1000 feets only deliver round about 50-70% of the possible oil according to this source, assuming that the longer in the tube the more of these losses occur.
The USGS published a poster on this exact effect on the Barnett, must have been 15 years ago or more. And they sure didn’t lump all the formations together in the Fort Worth Basin to do it. Does Novilabs not a have a single geologist that can read a log to sub-divide these things into the categories that matter?
Reservegrowthrulz,
They have done that in other papers.
When looking at all of the US tight oil as they have done here, the charts get pretty messy if you break out every formation.
They have some pretty good papers publicly available.
Actually, the data is far more revealing if you break it out by formation, and reveals specific differences among the groups. There are only 3 formations that matter in the Permian, burying them in the other 150 designations, and smearing their production data in with the relevant 3, is hiding the profiles of the elephants in the room.
Reservegrowthrulz,
I disagree. Most wells completed in Midland are Lower Spraberry and Wolfcamp A and B, in the Delaware sub-basin it is second and third Bonespring and Wolfcamp A and B. A paper focused on only the Permian might have broken things out in that way, but the referenced paper was more general. They have a nice paper on Midland remaining inventory that breaks thing out by formation. Not sure if they have done a similar paper for Delaware.
As most wells in Midland will be Spraberry or Wolfcamp and for Delaware they will be mostly Wolfcamp anf Bonespring, basically looking at Midland and Delaware may be enough.
In fact they might have broken things out by formation and found little that was revelatory.
You disagree that formation breakout isn’t of value? And I am aware of the formations sitting in their respective sub-basins of the Permian, when analyzing Wolfcamp wells you separate them by sub-basin. The formation might have the same name, but there is no requirement that the geologic conditions during generation and that developed afterwards led to the same rock properties.
Reservegrowthrulz,
Most of the output comes from Wolfcamp, Bonespring, and Spraberry, if the differences between these formatins in the repective sub-basins is not significant then breaking things out further tells us little. When I have done such an analysis for EUR that is the case, perhaps Novilabs, which has better access to the full data set has found the same.
Reservegrowthrulz,
Breaking it out is useful for analysis, but not necessarily for presentation. You seem to assume this was not done by Novilabs. I am not sure you are correct.
I agree for analysis it is useful to break things out by formation. Novilabs has a wealth of information in their database.
Reservegrowthrulz,
My main disagreement is that the few wells completed in other formations besides the Big 3 in the Permian basin have little effect on the analysis. For example for wells completed in 2019 for all formations the cumulative at 36 months is about 257 kbo, if we drop formations besides Wolfcamp, Spraberry, and Bonespring the cumulative goes up a bit to 262 kbo at 36 months (about a 2% increase). The bigger difference is going from Midland to Delaware sub-basin where for wells completed in 2019 the 36 month cumulative is 231 kbo in Midland sub-basin and 283 kbo for Delaware sub-basin (a 23% difference between sub-basins).
All of this information is available at Novilabs
https://novilabs.com/blog/permian-update-through-april-2023/
RESERVEGROWTHRULZ, I could not give an answer to your comment to one of my comments above, on the spot, there was no “reply button” in your comment, for some reason, so I give the comment here instead. I have pondered your question about were the oil exports crisis is that has been predicted by Jeffrey J. Brown, and the answer took a whole blogpost to explain. I posted it recently on my blog, you can read it here:
https://skogslars.blogg.se/2023/october/response-to-more-critique-of-my-work-on-oil-exports-2.html
Dennis
Below is a chart which shows barrels of oil on the water (OW). Just trying to understand what is SA’s objective? Is it to get oil on the water down or oil on land which is more difficult to assess? The chart shows yearly averages up to 2020 and then switches to quarters for 2021 and onward. OW was roughly 1050 Mb between 2015 to 2019 and then began to rise and rose to a high in Q1-23 to 1,413 Mb. In Q2 it dropped by 111 Mb to 1,302 Mb. However according to Table 10-1 in the post, Q2-23 was essentially in balance.
So where does this 111 Mb belong. Does it mean that demand was stronger than what OPEC estimates?
The chart has been extended to Q4-2023, just to show where OW would be if all of the shortage came from OW.
Ovi,
I just think of oil on water as a portion of World crude stocks, I don’t believe it has any special signifigance relative to stocks on land. World oil stocks are very difficult to assess, we have oil on water and OECD stocks, but have no idea what the stocks are in most of the World (OPEC, less developed nations, BRIC, etc). Typically most nations aim for 90 days of forward supply for petroleum stocks. Lets say forward supply for the World for the next 90 days is around 100 Mb/d, that suggests World Stocks would be 9000 Million barrels (9 Gb). My guess is that not all of the supply shortfall will come from oil on water, some will come from land stocks as well, oil on water is not likely to fall below 1 Gb imho.
I believe SA’s main objective is stable high oil prices in the $90 to $100/bo range for Brent crude, this may be achieved by reducing World Oil Stocks.
Dennis
I agree with the SA range of $90 to $100 for Brent. With Q1-24 coming up, with typical low demand, we should expect SA to keep its 1 Mb/d cut. It will be interesting to see if they can unwind that cut because with new supply coming on and unknown demand increase they may have to stay at 9 Mb/d for a while longer.
It will be interesting to see the size of the drop in oil inventories in the next MOMR and the split between land and water. I think with tracking data and satellites, it is easier to track oil on the water and it may be more accurate.
I think China treats their inventory numbers as a state secret. Also I read some speculation that they were drawing some supply from their reserves to slow a price increase in oil.
Ovi,
You may be correct that the oil on water number may be fairly accurate, but it is only 10 to 20% of World stocks. There is a large piece which is not transparent and the best we can do is look at various estimates of supply and demand and perhaps average these as we don’t know which are correct and then look at how stocks have changed over time. This is very fuzzy, but the best we can do.
Not clear what will happen in 2024Q1, at some point in 2023Q4 we may see World oil stocks reach critically low levels that will be hard to ignore. Oil prices could spike to well over $100/bo if a shortage becomes apparent and the Saudis may choose to produce more to take advantage of higher oil prices and to bring oil prices back to under $100/b. I think the oil market is pretty tight now and most are simply unaware.
Dennis
The thing to watch when SA brings oil back on line is whether they add 500 kb/d or 1 Mb/d into the market. That will give us an idea of how SA sees world oil demand and new supply coming online. How much they have will have a big impact on the price of oil that day. US production will play an important role in that decision.
The other big unknown here is what will XOM and CVX will be doing next year in the Permian. Will they just be trying to maintain production or possibly increase a bit, not too much. I don’t think they want to fight OPEC and hurt themselves.
My book (english) about the end of the oil age is finished.
It’s free and can be downloaded here:
https://www.peakoil.ch/publikationen.html
Hi Berndt,
Congratulations!
How do I get to the english version? I can’t even read the website links.
thanks!
Please use:
https://www.peakoil.ch/media/files/the_end_of_oil_covered_230920.pdf
A substantial body of work. But the instant you began basing any of it on the work of the Hill’s Group, any conclusions drawn based on that go right out the window. You are aware of how poorly their credibility fared after they used their own work to predict the price of oil going to $0bbl? They seem to have scrubbed their website clean, they refused to have their work reviewed by any pertinent expert, even though it was offered, they were never able to validate their claims through data as simple as oil field temperature logs that their ideas on the thermal mass balance was altered by production, not a once. The precision of any calculation is irrelevant when it is the calculating something completely unrelated to the pertinent underlying physical principles.
Write your own book.
And: All other but AdamB are invited to ask, if they have questions concerning the book.
On basic geophysics? Why? They are already out there and you assume Hill even read let alone understood it in the first place? You referenced his work, not me, I know better, were you unaware that his calculations were so valid that they arrived at the conclusion of $0/bbl oil back in like 2017? Could have been a year earlier or later, doesn’t matter, it was ridiculous on its face when he wrote his reports.
I’m not writing a book pointing out the value of his ideas, he has already written an entire report proving their value….and then put an exclamation point on it by erasing everything on his website and papers and all the links aiming at it that he put up at peakoil.com because of how humiliating it was. I did my due diligence on the value of Hill’s work…I just mostly expressing my surprise that maybe you hadn’t.
I seem to recall the oil price going negative within the last couple of years, so maybe $0bbl wasn’t so off the mark?
Mike,
Yes during a global pandemic, it might occur again during the next one.
https://www.resilience.org/stories/2017-03-01/debunking-hills-group-analysis-future-oil-industry/
Bernt hangs on to the faulty analysis by the Hill’s group. Any conclusions derived from it will be also faulty.
Seppo, that is a quite lame statement. How about writing the truth:
The thermodynamic analysis of the Hills Group has a correct core, but you did not recognize it because, in their report, mistakes and inaccuracies obscured the core ?
And the core is: The earth crust has been at most oil reservoirs in a thermodynamic equilibrium. Oil extraction has changed the equilibrium.
Berndt:
The energy for the disturbed temperature equilibrium must come from somewhere, that I have understood.
But aren’t the costs for this already included in the production costs (part of the Energy Cost of Energy) as Tim Morgan calculates them.
https://surplusenergyeconomics.wordpress.com/
Is it possible that you calculated the costs twice?
Also a good read: https://thehonestsorcerer.substack.com/p/this-energy-crisis-is-here-to-stay
EL MAR,
please look at the image below. It is from Charles Hall. The extraction energy is only a small part of the energy required for the whole process. Charles Hall speaks of a societal EROI for the whole process. The EROI derived from my calculation corresponds to the societal EROI.
I don’t calc the energy twice.
(the image quality is low because i had to compress it to put it on this side)
This analysis is incomplete-
It fails to account for a roughly 70% loss of energy content at the point of use [Combustion inefficiency] primarily in the form of waste heat, when the fuel is used with Combustion Engines.
Apples to apples comparisons across energy sources requires end use inclusion in the analysis.
Berndt,
Pretty impressive volume of work there. I learned quite a few a things by the 2-3 hours devoted to reading the most important or new (for me) facets in this edition of your book.
I have to revert to a less confrontational view of what the fossil future might look like. It is the easy solution to add energy to the system, and I think adding natural gas and LNG is not a done proposition by any measure and definitely not renewables. Even oil is not “done” – but it is definitely challenging to find another Guyana prospect going forward. Probably it is there somewhere in the the far north or far south, Africa or central Asia to a higher cost. Before Guyana, we had Kasakhstan; it is probable to find more. And that oil companies will try to do their best for a hundred of more years although in a reduced state altogether – that I am sure of. But there are limits revealing themselves soon I would guess. There are all kinds of issues with the overconsumption going forward. But personally I do think we are a bit brighter and have a bit more rings on the onion to peel comparing to for example the Roman collapse. And it will play out differently across the world – a patchwork. Work in progress. Other than that there are tenfolds of good points in your writing that deserves some discussion.
” And that oil companies will try to do their best for a hundred of more years although in a reduced state altogether – that I am sure of.” The people studying the EROE for now and in the future are saying otherwise. https://www.sciencedirect.com/science/article/abs/pii/S0306261921011673?via%3Dihub
Berndt thanks for sharing your work. Ambitious scope of issues you address.
This simple statement is perhaps the biggest point of all-
“The peak described in this book is not peak oil demand, but peak oil affordability.”
Collective purchasing power for oil may peak soon, but the situation will be extremely variable. Some segments of the world will be able to afford oil for much longer than others, and this disparity will be a source of tremendous chaos within and between countries. That chaos will likely cut into the long fat tail of oil production decline in a completely unpredictable manner.
Also, I point out that humanity will pay much more for energy from oil or other energy sources, diverting the purchasing power from other sectors like health care, fashion, entertainment, leisure activities, etc. The alternative to energy spending is human labor, which is so much less reliable and problematic. (just what is the EROEI for an hour of human labor?).
Lastly, I will raise an objection to this point-
“But it (the move to replace ICEV’s with EV’s) won’t work without fossil energy. Electric vehicles are very likely to be a dead end”
Simply- Fossil fuel use isn’t about to disappear one day.
For the rest of the century there will be fossil fuel availability for important uses, perhaps not for all countries. But for many countries there will fossil energy that will increasingly be shunted to the more critical uses, including the energy and food production sectors. This applies not only to EV’s, but to other energy system mechanism upgrades and alternative deployments such as heat pumps, photovoltaics/wind/nuclear, energy storage and transmission.
I suspect the light transport sector for new vehicles will get smaller over the next three decades but that the global fleet will gradually be electrified (an osbourne chart with a declining overall slope). Between the inefficiencies of combustion and the depletion of oil, the case for electrification in transport is too compelling, even as the overall miles traveled will likely decline in a big way.
Permian Operators Unlock Efficiency Gains And Consolidate Acreage
“A lot of the Wolfcamp (in the Delaware sub-basin) is set up in two-mile (1,280-acre) units,” observes Michael D. DeShazer, Coterra’s vice president of business units. “Operators often have to skip around because they do not have contiguous acreage or they have midstream constraints.”
With six 1,280-acre units side by side in Culberson County, Tx., Coterra’s Windham Row project will not face those challenges.
“It is a half-billion dollar investment,” DeShazer says. “We will drill a well. As soon as the rig moves far enough away, we will come in with a frac fleet to complete the well. And then as soon as the frac crew moves far enough away, we will start producing the well. Eventually, we will develop 51 wells in a row from east to west. So we will be drilling, completing and producing wells at the same time all in the same block.”
Coterra, which has a joint development agreement with Chevron on the project, can bring wells on line quickly because it controls the water and gas midstream infrastructure that is servicing the project, DeShazer says.
https://www.aogr.com/magazine/cover-story/permian-operators-unlock-efficiency-gains-and-consolidate-acreage
Rig and Frac Report for October 27
Rigs Up. Fracs Up
– US Rigs up 2 to 451
– Permian rigs up 2 to 296. Texas added 2 while NM was unchanged at 89 and down 15 from the 104 high
– Eagle Ford up 1 to 47
– NG down 1 to 106 (not shown)
Frac Spreads were up 6 to 275
How high will they go?
A conservative (low) Permian Scenario.
Dennis
I can see you are trying hard to get the Permian to plateau. It is incredible that keeping the number of new monthly wells at close to 430 from early 2022 to now still adds about 400 kb/d.
Based on the latest DPR, 451 wells were completed in the Permian in September. The completed wells added 369 kb/d to September’s output for an average of 819 b/d/well. The overall decline was 391 kb/d which resulted in a net decrease for Permian output in September of 21 kb/d. To keep production flat in September, 477 completions would have been required to offset the decline, 26 more than than the 451 completed.
Is there some way of comparing your model with the DPR’s. What is the monthly decline in your model? Clearly the monthly additions from the 430 or so wells being added in 2022 are providing a net monthly increase.
Ovi,
I have modified the model to use the average 2020 Permian well profile for 2022 and later years, the earlier model used the average 2021 Permian well profile which was a high point (when not normalized for lateral length) in 2022 productivity decreased to roughly the 2020 level, for 2023 and beyond it is difficult to determine as I have little data beyond 2022. I have also emailed the spreadsheet to you, you can modify well completion rates and create whatever scenario seems appropriate, the EIA data is from the previous EIA official estimate as I think the most recent estimate is not very accurate for the Permian basin. Unfortunately it seems Novilabs has discontinued tight oil updates (last one was in June, they used to do monthly updates). So we don’t have very up to date accurate tight oil data as the EIA data has gotten pretty bad of late.
From Aug 2023 to Nov 2023 completion rate is 450 to 444 (decreases by 2 each month), legacy decline is 166 to 170 kb/d, newly completed wells add 190 kb/d in Aug and 188 kb/d in Nov 2023.
I have never thought the DPR for the most recent 5 or 6 months was very good. The model is based on rig counts rather than completions.
Dennis
Thanks for sending the model.
Ovi,
The legacy decline in previous comment is not right because the well profile has its high point in month 2 rather than month 1. When using that high month to estimate legacy decline I get about 348 kb/d on average for the Aug to November 2023 period. The DPR has about 392 kb/d for average legacy decline over this period.
Chart below compares legacy decline for my Model with DPR from Feb 2022 to Nov 2023.
On the Permian Model I show a decrease in the completion rate from about 450 wells per month in July 2023 to 360 wells per month in Dec 2028. An alternative way to think about this would be a continuation of the completion rate at about 450 wells per month with decreasing average well productivity at an average annual rate of about 5 % per year over that 4.5 year period.
An easy way to think about this is that if the productivity of the average well dropped by a factor of 2, then the amount produced by those wells would be the same as one half the original number of wells at the original producivity level.
As far as the scenario being conservative consider that the Bakken in North Dakota was evaluated by the USGS as having a mean TRR of about 11 Gb, my scenarios suggest a best guess URR of about 8 Gb, roughly 73% of the mean TRR. For the Permian basin the USGS estimates mean tight oil TRR of about 75 Gb, 73% of that would be a URR of about 55 Gb, my scenario has a URR of 31 Gb or roughly 56% of the 55 Gb URR estimate, based on the North Dakota Bakken/Three Forks play. My best guess remains a URR of 40 to 45 Gb for tight oil from the Permian basin.
https://aspofrance.org/2023/10/28/oil-what-risks-for-europes-supplies/
I wonder if this has been posted. Click on the …. pdf de la présentation and you get the slides in English.
Interesting data on three slides21, 22, 23 on Saudi Arabia. Also see slide 12
And slide 32 – they conclude 10% less onshore and 20% less offshore reserves than the Rystad numbers, which have themselves been steadily decreasing for the past 4 or 5 years.
If we follow the data communicated by Frenchfries, the peak of production of the ”rest of royal familly” will occur at the end of 2020s. As, at the same time, the productions of Ghawar, Safaniya and Abqaiq will be in terminal decline, this means that the decline of the Saudi oil production would begin in the 2030s and not in the 2040s as the Shift Project predicts based on Rystad Energy data. This hypothesis is reinforced by the fact that Aramco recently annouced in 2019 that they will prospect oil outside Saudi Arabia. https://peakoilbarrel.com/wp-content/uploads/2023/09/763764-1.jpg
IMHO Ghawar could already be in terminal decline. Can anyone say with authority that it isn’t? From a peak production of 5.7M bbls/d in 1981, down to a ‘regular’ 5.0Mbbls/d over 20 years ago, to 3.8M bbls/d in 2019 in the Aramco prospectus (not audited).
If Ghawar is in terminal decline it makes sense given Saudi cuts this year. If at the end of the year they ‘decide’ to keep production at present levels, no matter where the oil price is, with the excuse of keeping the price up, a pretty good case could be made about decline in their major (and the world’s major) oil field.
Hideaway
While the chart below is not proof that Ghawar is in terminal decline, it is consistent with the facts that have been made public in the past.
Attached is a chart showing the output of Ghawar starting in 2003 when it was widely reported that Ghawar was producing close to 5.2 Mb/d. After 2003, production is reduced by 2% per year.
The two percent comes from a presentation given in Washington in November 2016. In that report the following is stated: “Without “maintain potential” drilling to make up for production, Saudi oil fields would have a natural decline rate of a hypothetical 8%. As Saudi Aramco has an extensive drilling program with a budget running in the billions of dollars, this decline is mitigated to a number close to 2%.
As you can see in the chart, the 2% decline rate gives 3.8 Mb/d in 2018. In 2023 production is down to 3.47 Mb/d
I do believe that Ghawar is watering out, i.e. the water oil ratio is climbing above 35% as stated in the attached paper, possibly closer to 45% to 50% and that the 1 Mb/d lollipop cut that was initiated in July comes mostly from Ghawar.
http://www.ww.nyenergyforum.net/Data/Sites/1/media/resources/OilPresEFNYC.pdf
Thanks Ovi, nice chart. At some point the water cut is going to accelerate rapidly or the new wells wont add much and despite their best efforts the decline will be rapid. It’s the lack of honest robust information out of Saudi Arabia that makes me think we will only know it’s in rapid decline after the event.
That paper you referred to is 17 years old and at the time they claim that Ghawar had pumped 50% of it’s reserves (yet was past peak production by 25 years!!). Add another 24-26B bbls of production since then in those 17 years. Ghawar is now 42 years past peak production. As Ghawar reached maximum production in 1981, 30 years after first production, I have a hard time believing it wont fall off a cliff, production wise, sometime soon, assuming the ‘rest’ it’s currently having isn’t terminal decline…
As I stated above, I don’t really trust what we’re told about Saudi oil at all…
Your chart is pretty close. The below link is undated, but I believe it was written in December 2018.
Ghawar Oil Field
Oil production and recovery techniques at Ghawar
Although the Ghawar field’s production peaked at 5.7 million barrels a day (Mbopd) in 1981, the field’s maximum daily production capacity is currently stabilised at 3.8Mbopd, which is more than 30% of the country’s total oil production capacity of 12Mbopd.
Saudi Arabia’s two other major fields, the onshore Khurais field and the offshore Safaniyah, have the capacity to produce 1.45Mbod and 1.3Mbod, respectively.
Gas injection at the Ghawar field was introduced in 1958, while water injection was introduced in 1964 to provide additional pressure support. The field utilises water from the Qurayyah seawater treatment plant.
The Haradh III project, which was brought on stream in the southernmost area of the Ghawar field in 2006, was Saudi Aramco’s first project to be developed with maximum-reservoir-contact (MRC) wells with down-hole Interval control valves (ICVs) for flow control.
Saudi Aramco has also implemented a carbon capture and storage (CCS) project, named Uthmaniyah CO2-EOR Demonstration Project, at the Ghawar field for enhanced oil recovery (EOR).
Completed in 2015, the carbon capture and sequestration project allows for capturing and processing up to 45 million cubic feet of CO2, which is transported through an 80km-long pipeline for injection into the reservoir of the Uthmaniyah oil field.
I found one truly absurd statement in the article.
Owned and operated by the state-owned Saudi Aramco, the super-giant oil field has been producing since 1951 and is estimated to continue pumping oil at its current maximum production capacity of 3.8 million barrels a day beyond 2050.
Hideaway
We need a Geology engineer to help answer your question.
The difficulty of assessing whether Ghawar is close to terminal decline requires an understanding of the stability of the water oil interface as it gets close to 75% water and 25% oil.
To try to figure out where that interface is today, here are some estimates.
According to French Fries post, the URR of Ghawar is 100 Gb and 80 Gb have been produced as of 2019. So according to FF Ghawar is 80% depleted in 2018. See table from his post.
A paper in The Oil Drum estimates that the highest probability for the Ultimate Water flood recovery is 96 Gb ± 8Gb. So FFs estimate of 100 Gb is a reasonable. The same paper also states that the highest water flood recovery would be 120 Gb. So if FFs production of 80 GB is correct, the depletion level of Ghawar would be closer to 67%.
Adding in 6 Gb of production for 2019 to 2023 increases output to 2023 to 86 Gb or somewhere between 72% and 86% of ultimate water flood recovery. Appreciate these are average depletion levels. The highest depletion level would be for the Northern field Ain Dar.
Recall that the maximum reservoir contact wells started using automatic water shutoff valves. This implies that the rising water is causing problems in some areas, possibly in the northern field Ain Dar.
Considering these high depletion levels, Ghawar may be getting closer to the terminal decline phase.
http://theoildrum.com/node/2470
Thanks Professor Korpela,
Nice presentation. I encourage everyone to read it.
Yes, excellent presentation.
This caught my eye…profund insight-
“The US shale oil boom lasted long enough to undermine all
efforts to raise awareness among the public and politicians
about the need to take peak oil seriously”
slide 52
The US shale oil boom lasted long enough to undermine all
efforts to raise awareness among the public and politicians
about the need to take peak oil seriously
Yes, a thousand times, yes. I’ve mulled over the idea that the “shale revolution” was probably the worst thing that could have happened at peak oil because of the complacency it instilled. “Ha! Peak oil is a myth!” Then covid came and made it even WORSE because the peak was disguised by the lockdown. I suspect we may be royally screwed when decline sets in . . . but who knows?
Mike B, you are spot on. The decline of global oil production could have begun in both “All Liquids” (which in September this year was 0,9 mbd below its assumed post-pandemic peak in Februrary 2023) and “crude+condensate” (which in June this year was 0,5 mbd below its assumed post-pandemic peak, also in Februrary 2023), but it could be too early to say, although everything I know about oil and the global economy supports this assumption. Only a miracle can now reverse these trends.
What an interesting time to be living in.
The Problem Is We Are Running Low On The Good Stuff… Not the SHITE
First… there was no coincidence the price of oil remained at $1.80 a barrel during the crazy Geopolitical Decade of the 1960’s with the…
1) Cuban Missile Crisis
2) Assassination of JFK
3) U.S. Enters Viet Nam War
4) Arab-Israeli War
5) Assassination of MLK
6) Assassination of RFK
and so on and so forth. We could almost come to a Nuclear war in early 1960s, but you wouldn’t know it with the Oil Price Action because the world more than doubled oil production by 24 Mb/d. 🙂
Second… today is a different story as we have made up the Decline of Conventional Oil with all kinds of Low EROI SHITE.
Good Luck after 2025.
Data courtesy of ASPO France. Thank God the smart folks in France still keeping ASPO alive on Twitter, while the U.S. Chapter DIED back in 2017.
steve
Steve,
In most of the World condensate is included with crude, also much of World output is “heavy” crude. Heavy oil is any oil with an API Gravity of less than 20 degrees, there is a significant portion of World output with API gravity between 10 and 20 degrees. A better metric is extra heavy oil which is what Laherrere typically uses which is oil with API gravity less than 10 degrees, most of this is from the Orinoco belt in Venezuela and the Canadian Oil sands in Alberta, Canada. I define conventional C plus C as all C plus C less tight oil and extra heavy oil, by that definition conventional oil peaked in 2015 at about 73.5 Mb/d.
The UK 2022 reserve estimates were published last week.
https://www.nstauthority.co.uk/news-publications/reserves-and-resources-2022-report/
Since around 2011, despite wide price volatility, the 2P (proved and probable) plus cumulative production has remained pretty constant so at any time 2P has given the best estimate of remaining reserves. That holds true for most conventional fields and basins with honest reporting. The P3 (possible) reserve is gradually dwindling as reserves are upgraded to probable or are assessed as non prospective. Only a tiny amount of the contingent resource will ever be produced as its EROI is too low or the exploration risk too high. FID for new developments like Rosebank will convert probable to proved. New discoveries should add to the 2P number but the few recent additions haven’t made much difference suggesting the older 2P numbers may have been a bit high.
Thank you Mr Kaplan.
Export Land Model
Off the back of Seppo’s post
https://www.aspo.be/app/uploads/2023/10/Peak_oil_ERM_09_oct_2023.pdf
The little discussed aspect of global oil production peaking is the availability of oil for export from countries that actually produce more oil than they need.
http://theoildrum.com/node/7007
Over the last 12 years the Export Land Model has been working in reverse. The United States which was the largest importer of oil managed to reduce imports by around 12 million barrels per day.
This allowed other importing countries such as China, India, South Korea, etc to develop large car based manufacturing and transport infrastructure.
Once US shale oil starts to decline the world will be facing not just a decline in global oil production but the mush faster decline in available exports. For instance if Saudi Arabia’s oil production declines by 2% in a year. It’s available exports will fall by 4%.
In 2010 there were around 15 countries that were able to increase oil exports, how many countries will be able to do that in 2030?
It looks to me that we shall not be facing a challanging decline of 1% or 2% in global oil production.
We shale be facing a devasting 3-4% yearly reduction in available oil to import.
How will India, France, China etc cut oil consumption by 30% in ten years?
I think Dennis’s optimistic outlook is way into the rough
Charles,
I am always in the rough off the tee or in the sand or pond or trees or brook.
In the past my best guess “optimistic” scenarios have consistently proven to be too low when compared to historical output. I have never really focused on exports and trying to project what those would be. What I have presented in the comments section has mostly been historical data and in my view the most important number is total exports. Also keep in mind that exports of crude plus products is probably the most important number as some nations with excess refining capacity will import crude and then export products.
The export land model may seem impressive, but historically it has missed the mark badly.
An updated model with slower transition to electric transport, high oil prices (over $100/bo Brent price in 2023 US$) and a tight oil market assumed from 2028 to 2038, average annual decline rate in World C plus C output is about 1.3% per year for this scenario.
Dennis
Export Land Model has proved itself to be correct in almost every oil producing country that has passed it’s production peak.
Take the United Kingdom for example, producing 2.5 million barrels per day when it peaked in 2000AD.
https://tradingeconomics.com/united-kingdom/crude-oil-production
At that time it was exporting around 1 million barrels per day, in just 8 years it became a net oil importer.
Thankfully at the time, several countries were increasing production and international oil exports were available be it at much higher prices. As I said the US tight oil temporarily turned the Export Land Model on it’s head allowing around 10 million barrels of oil to go to other countries.
https://www.worldstopexports.com/worlds-top-oil-exports-country/?expand_article=1
Which of the above countries will be increasing production in 2030?
I think by 2030 global available oil exports will be falling by 3-4% per year.
China is run by an evil regime, but they are not stupid, they know what is coming. That is why they are building out wind and solar at such a rate. It is nothing to do with protecting the environment as they are also commisioning 2 coal fired power plants each week! They will need the electricity for all the electric cars.
https://energyandcleanair.org/wp/wp-content/uploads/2023/08/CREA_GEM_China-coal-power-briefing-2023H1_08.2023.pdf
At the moment global oil consumption is still increasing despite millions of electric cars being sold. Increasing demand from shipping, aviation and chemicals is outpacing demand reduction from road transport. When exports start declining things will get very difficult
Charles,
Looking at individual nations does not tell us much as there is a global oil market. At the World level if there are not enough exports, oil prices will increase and this will affect demand. At the World level the Export land model was predicting zero global net oil exports by 2014. This was not close to being correct. Your implicit assumption that the decline in exports will be 2 times the rate of production decline is the same basic assumption made by J Brown, my guess is that it will be similarly flawed.
Much of the petrochemical industry is supplied by natural gas and NGL rather than by C plus C output, the minor amount of crude that is not used for transportation and farming are mostly by products of the refining process and in many cases there are substitutes for these products.
Also keep in mind that much of the transportation use of C plus C is highly inefficient with perhaps 30% of the primary energy actually converted to work, electric transport is far less wasteful and solar and wind do not require a thermal process so they eliminate much of this wasted energy while also reducing carbon emissions.
Dennis,
I don’t know where you got this 2014 number from, but the latest predictions from Jeffrey Brown (2015) that I know of, was of an end to “ANE” oil (“Available Net Exports”, which is global net oil exports minus China and India’s combined net oil imports) in 2032. You can check it up for yourself, in this interview (it’s well worth a read, what I talk about is halfway into the interview):
https://www.resilience.org/stories/2015-09-15/to-understand-the-oil-story-you-need-to-understand-exports/
I quote:
“Jeffrey Brown: Well, if you extrapolate, what you can do is do an ECI ratio, but it’d be the global net exports divided by Chindia’s net imports. I call it the GNE over CNI ratio. If you extrapolate that out, they would be theoretically consuming 100% of global net exports around the year 2032. So, basically 17 years from now.”
Lars,
The 9 year scenario was a fall in available net exports in the early model from 2006 and was for the mythical “export land”. Later in October 2010 a piece was published that looked at the top 33 net exporters which were responsible for 99% of global net exports at the time. Two scenarios were presented and Global net exports fell 9.6% from 2005 to 2015 in scenario 1 and by 14% for scenario 2 for the same 11 year interval.
Historically global net exports of crude oil fell by about 1.26% from 2005 to 2015. From 2005 to 2019 global net exports rose by 1.5% and from 2005 to 2022 global net exports fell by 2.8%, an annual rate of decline of 0.17%.
Lars,
The 9 years is based on this post from July 2007
http://theoildrum.com/node/2767
Dennis
What is the point of you posting post after post after post about tight oil and nothing else?
Between you and Ovi you have reduced this website to:
Bakkan drilled 2 more wells this month, Permian has 3 more DUC.
and on and on, month after month.
Your knowledge of anything else that is going on globally in the oil world is seriously lacking.
Your obsession is causing you to be blind to the big picture why don’t you give permian DUCs a rest for a couple of months and look at what else is going on.
Do you know that a civil war started in one country due to oil production peak causing cuts in support to an important section of the economy in that country?
550,000 deaths so far.
You simply have no idea of the impacts peak oil is having and no idea how badly it is effecting different countries.
Charles,
If we are concerned with peak oil, one question we would lke to answer is approximately when this might occur. You are welcome to discuss the consequences of peak oil and the problems this may cause. Not every problem in the World is associated with peak oil, typically problems are multifaceted and reducing them to a single cause is typically flawed.
In 2008 tight oil output was under 500 kb/d and was of little importance, many at that time thought it would never amount to much (including me). Of the increase in World output of C plus C from 2008 to 2022 (from 73 Mb/d to 81 Mb/d) nearly all of this increase has come from tight oil output, see chart in comment below. For that reason I follow tight oil closely, you can focus on whatever you like.
World C plus C and World C plus C minus tight oil output.
From 2004 to 2019 World conventional oil had an OLS increasing trend of 65 kb/d (basically flat), this is the undulating plateau that some claimed might occur back in 2005 or so. Conventional crude plus condensate is defined here as World C plus C minus extra heavy oil output (oil with API gravity less than 10) minus US tight oil output.
Came across this article on Texas crude estimates from 2015, although the piece is 8 years old, the situation for Texas data is much the same today.
https://www.eia.gov/todayinenergy/detail.php?id=22012
New US Production record
There is nothing stopping US Production Growth.
Full report late late Wednesday.🤞🤞
Of course, some things are going to stop US production growth : the continuous decline of Lower 48 state conventional oil production, the continuous decline of Alaska production and soon (after 2024-2025 according to George Kaplan) the continuous decline of GOM production.
Ovi,
The numbers in your chart makes me really feel sorry. That US oil production surpasses its peak, is really bad news for the planet. I send all of my heartfelt condolences and sympathy to the wild nature, to the wild animals, insects, seas and forests, those who really keep this planet going, and I apologize for the incredible, unfathomable stupidity and evilness that these numbers reveal about mankind and civilization, that we continue with this oil madness despite the climate becoming increasingly inhospitable to us and life on the planet, and despite Antarctica having lost a staggering amount of sea ice lately, so much and so fast that it is not possible to imagine for a human being.
I feel so sorry. For me its like losing a battle in a great, crucial war. A battle for the planet, against those who want to kill it, or so it seems, at least.
My heart is on the side of the wild nature, there is where I belong, for now and for ever, and for me the collapse of civilization will be a long awaited liberation, despite it probably being the end of my earthly life, it’s not important at all.
Maybe my calculations pertaining to oil are wishful thinking, but I have to put my hope somewhere, otherwise I’m not a human, but like a cold robot. And how could I put my hopes in the continuation of this oil madness? It’s impossible, utterly impossible, for me. I listen to Ron Patterson and Steve St. Angelo (their comments are always the most interesting ones here, they leave room for true hope) and hope in the deepest of my heart that they are right, and that Dennis Coyne is wrong.
Lars,
You are not alone. Even though it probably feels that way at times. I think of all the generations of life that existed up until recent times, absent human interference. And that, once humans have exited, stage left, life will carry on.
GOT2SURF,
Thank you for your kind words.
Lars,
I also hope I am wrong, but despite many thinking the opposite, I am not that much of an optimist.
I simply give the scenarios that seem most plausible, a very fast transition to electric transport (much faster than my best guess) or a breakthrough on self driving cars that might enable BEV robotaxis that meet most land transport needs would lead to a more rapid decline in oil demand, also a severe Worldwide depression in response to future high oil prices as we reach peak supply would also lead to less oil demand. I am just not optimistic that these scenarios have a high likelihood.
Time alone will answer these questions.
Dennis,
I recommend you looking up mining and metallurgy associate professor Simon Michaux’ work (there are a lot of interviews with him on YouTube, the latest is here: https://www.youtube.com/watch?v=R0Zpp50ttyQ). With a massive scientific expertise he punctures the hopes and dreams of the policymakers of the “Green Transition” (a mantra word today). His message is pretty much that the minerals and metals required for a Green Transition simply aren’t there. Not even close. Not even for one generation of vehicles and devices and installations.
“His message is pretty much that the minerals and metals required for a Green Transition simply aren’t there.”
I have read and listened to some of his presentations.
My take on his work and the subject is that there is plenty of minerals available to get a big chunk of energy transition done, but not unlimited.
And the result is that humanity will just have to learn to live with the results we do accomplish.
It will be interesting to watch and see just what particular mineral(s) become a limiting factor, and which trading block of countries comes up short of supplies first. Any shortage will be felt in some places long before others.
I fear geopolitical turmoil, the monstrous nature of the ‘mob’, and biosphere destruction, far more than the actual physical shortage of energy or minerals. Perhaps I’d feel differently about it if I lived in your country rather than the US.
Lars,
Others that have considered this come to different conclusions.
See
https://www.sciencedirect.com/science/article/abs/pii/S2542435123000016?dgcid=coauthor
also
https://www.sciencedirect.com/science/article/pii/S030626192300764X
a critique of a paper citing Michaux’s work below
https://www.mdpi.com/1996-1073/15/3/971
Dennis,
even if there were enough metals and minerals, it’s such a MASSIVE undertaking. It’s impossible to imagine the scope of it. We are too poor and powerless to do it. We will be increasingly poorer, exponentially (i.e. at an accelerated rate). Just look at the debt bubbles in the world, look at the global quadrillion dollar derivative bubble, look at USA:s exponentially increasing national debt. From where will we get the money? We cannot even pay our debts, neither national nor private. We are already bankrupt, and we already live on the edge of the collapse of civilization. If we had done this in the 70:s, maybe there would have been the slightest chance of us succeeding, but not now. We cannot even live in peace with one another. To think that we will succeed, it requires magical thinking and too high thoughts of an utterly fallen being, man. We should not put our hopes in such a wretched being, but in a Higher World.
A last word about oil export calculations. It’s so difficult math that it’s no surprise that Jeffrey J. Brown got it wrong in the beginning (all exponential curves are difficult to calculate, especially when the data we start with is uncertain). We should stick to his latest predictions, if we talk about his things. And I have confirmed them with own calculations, from many angles and with many different parameters and scenarios.
There is such uncertainties in this field (it’s for example very easy to double-count exports, for example US is not an net oil exporting country although it exports a lot of oil), that I cannot trust the data of energy agencies and energy institutes, for the same reason why I don’t trust their global oil reserve numbers, which are always way too optimistic. I have to do my own calculations. Always. I’m like Steve St. Angelo, who could not trust in my calculations in my book but had to do his own calculations, to “get a finger top feeling” (so we say in Swedish) of the subject, I think. This is the right way to go, but it’s not for lazy people. Secondary school math suffices here, though. I have calculated these things in all the ways I can possibly think of, seeking for confirmation of my starting thesis, and/or trying to disprove myself.
“All your Andes are belong to us.”
Estimate for Permian basin tight oil output using latest PSM data for Texas and New Mexico, deducting Eagle Ford output and using trend in conventional oil output in Texas and New Mexico over the June 2020 to July 2022 period and extrapolating to August 2023. Eagle ford and conventional output are subtracted from the sum of Texas and New Mexico C plus C output to arrive at the estimate for the Aug 2022 to Aug 2023 period.
I just emailed the EIA. Here is my inquiry and their response.
Ron Patterson
1:37 PM (1 hour ago)
Has the EIA’s International Data Report been discontinued? If not, when can we expect it to be resumed? Thank you, Ron Patterson
InfoCtr (OC)
2:16 PM (55 minutes ago)
to me
Hello Ron,
Thank you for your inquiry to the U.S. Energy Information Administration (EIA.) We hope to have updates in a couple of weeks.
Hope this information is helpful. Please contact us again for energy statistics or data.
Curley Andrews | Information Dissemination Specialist
Office of Stakeholder Outreach and Communications
U.S. Energy Information Administration
http://www.eia.gov
Ron,
Ovi has emailed several times and received similar responses along with some server problem or something and that they are working as fast as possible to resolve the issue. It has been over a month.
The one guy that knows how to run the software quit….LOL
Training up a new person….
Ron
There is a high probability it will come out today or tomorrow.
Ovi,
I thought I was the optimist around here. 🙂
I hope you are correct.
Dennis/Ron
EIA has just published its corrected data up to May. The November peak has changed again. June update after Nov 13. Russia is fixed.
I was mistaken. The May 2023 data has changed only a little. But the historical data has changed rather dramatically.
Ovi, the update for June or July did not come out today. But the data for may, and the historical data, is different from what it was yesterday. Not by much, but different.
Ron
As stated above, the June and possibly July updates will be posted shortly after November 13 when the computer systems have been updated.
Energy mix in the UK:
https://grid.iamkate.com/
WP
EV sales were up dramatically YoY so far this year — about 45% according to this source:
https://cleantechnica.com/2023/10/07/world-ev-sales-now-equal-18-of-world-auto-sales/
The worldwide numbers are 13% EVs, 5% plug-in hybrids, and 11% hybrid. So roughly 29% of new cars are somehow electrified, and 18% have electric plugs.
Since the fleet is growing slowly, this means that total demand for liquid fuel from cars has probably peaked. The pure EV numbers alone are enough for that. That doesn’t even include all light vehicles, just cars, but it still seems like a milestone.
That’s great but…EV market is slowing down, apparently.
https://www.wardsauto.com/industry-news/auto-industry-warns-roadblocks-ev-growth
https://www.ft.com/content/80d79220-612f-4c01-93b7-1d1a846e4b6d
4 billion people looking to get reliable transportation, mostly which can’t afford EVs. EVs will remain a luxury item for the people in China, Europe, and North America. May see economic versions in other places like India, South America, and the like.
Kengeo,
Cars have become quite expensive in the US. According to Kelley Blue Book the average cost of a new vehicle was 48k as of March 2023. The cost of an entry level Model 3 without rebate is about 40k, for those who qualify for a rebate the price is reduced to $32500 (range for this model is 272 miles), the longer range model (333 mile range) is 46k, about 39.5k after rebate, rebate gets cut in half on Dec 31, 2023.
The lease price for the M3 entry level is 329 per month.
Your link mostly about America, which is a big market, but not the world, especially in EVs.
Slowing down from 45% annual growth is inevitable, but still isn’t anything like slow growth.
But anyway, even if growth stops current sales levels are high enough to stop the growth in demand for liquid fuel, which is the reason I posted the numbers here.
Charles-
This car is a big seller in China. Might want to update your concept a bit. GM is a part owner.
https://insideevs.com/news/580615/china-wuling-hongguang-ev-sales-2022q1/
A new thread updating US August oil production has been posted.
https://peakoilbarrel.com/us-august-oil-production-at-record-high/
A new open thread Non-Petroleum has been posted.
https://peakoilbarrel.com/open-thread-non-petroleum-november-2-2023/