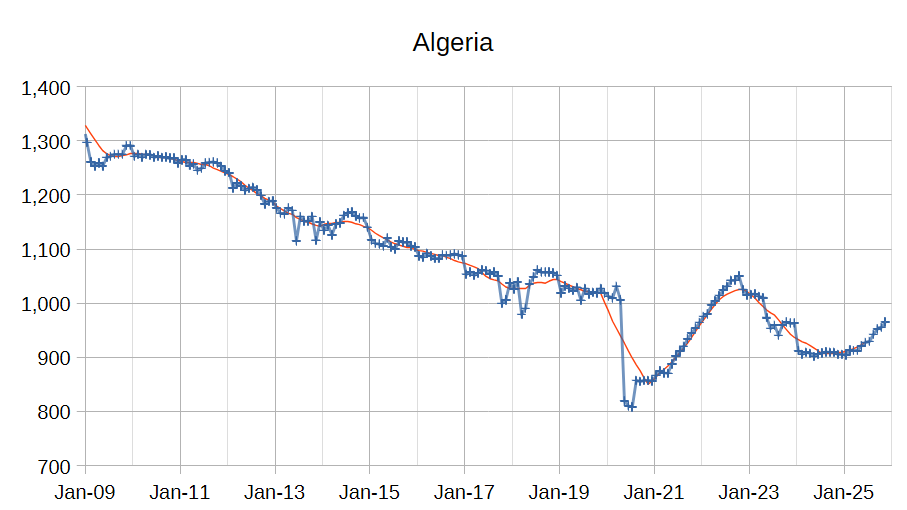
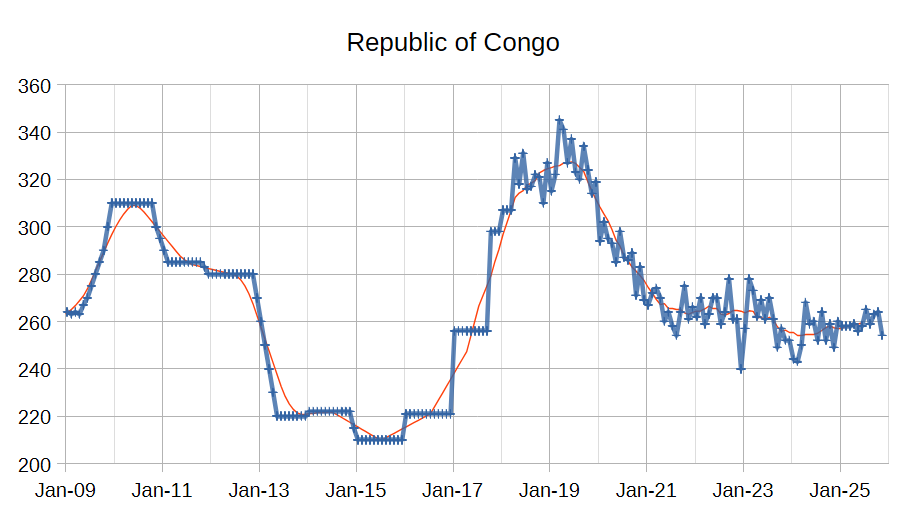
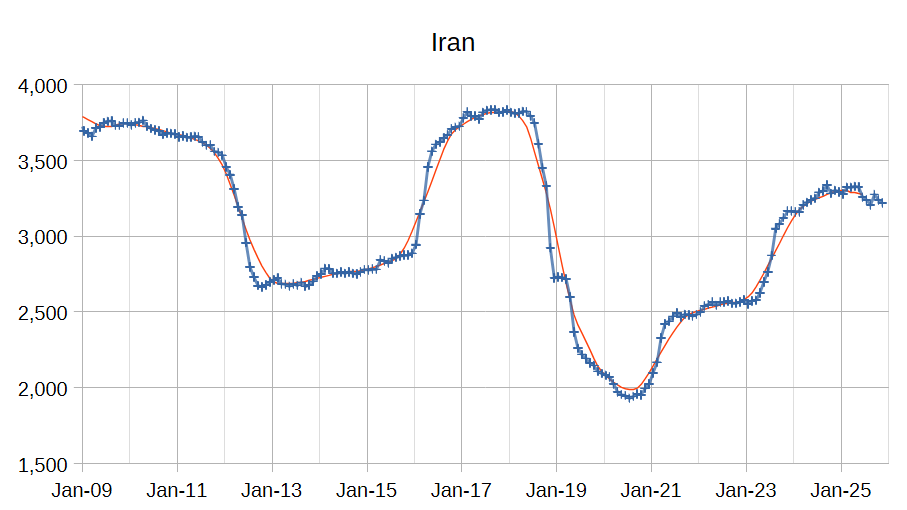
The OPEC Monthly Oil Market Report (MOMR) for December 2025 was published recently. The last month reported in most of the OPEC charts that follow is November 2025 and output reported for OPEC nations is crude oil output in thousands of barrels per day (kb/d). In the OPEC charts below the blue line with markers is monthly output and the thin red line is the centered twelve month average (CTMA) output.
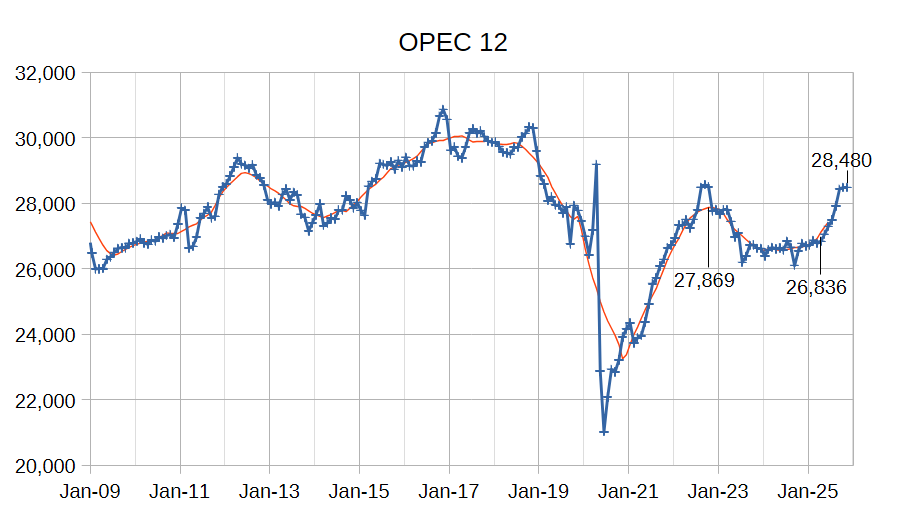
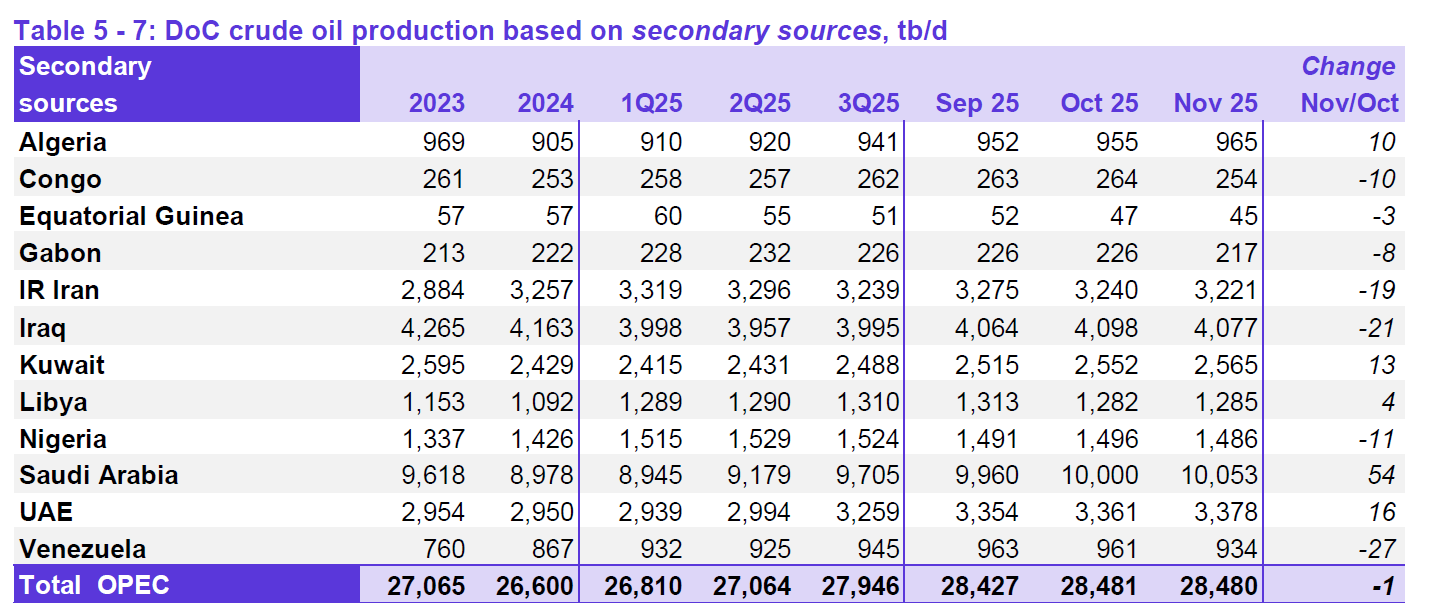
OPEC 12 output for September 2025 was not revised and October 2025 output was revised higher by 21 kb/d compared to last month’s report. OPEC 12 output decreased by 1 kb/d with the largest increases from Saudi Arabia (54 kb/d), UAE (16 kb/d), and Kuwait (13 kb/d). Venezuela (-27 kb/d), Iraq (-21 kb/d), and Iran (-19 kb/d) saw decreased crude output. All other OPEC members had small increases or decreases of 11 kb/d or less.
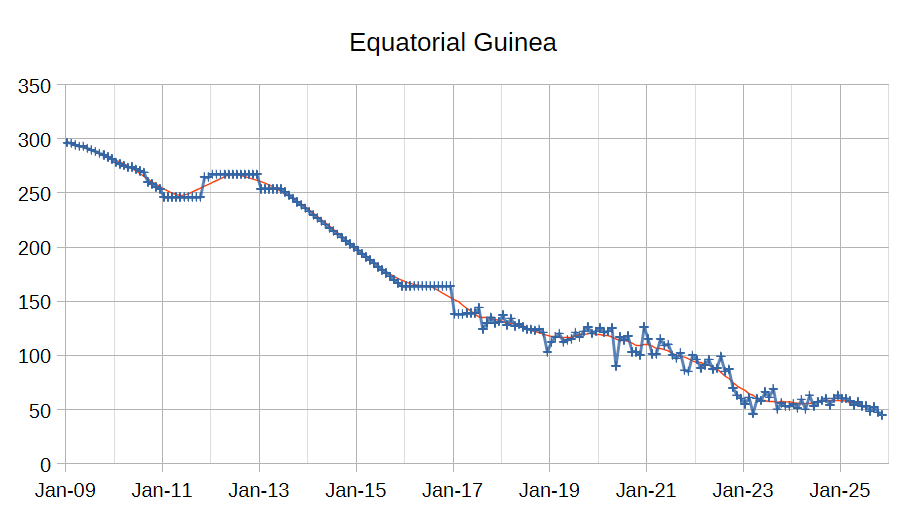

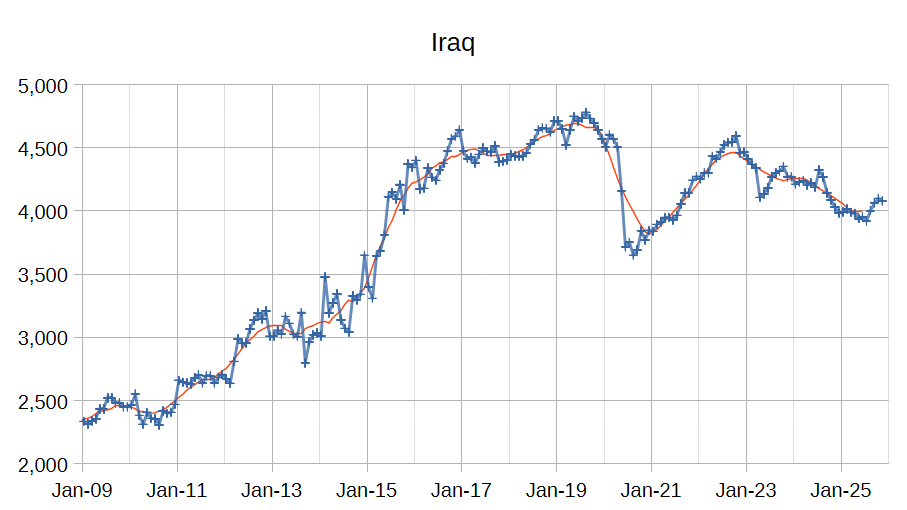
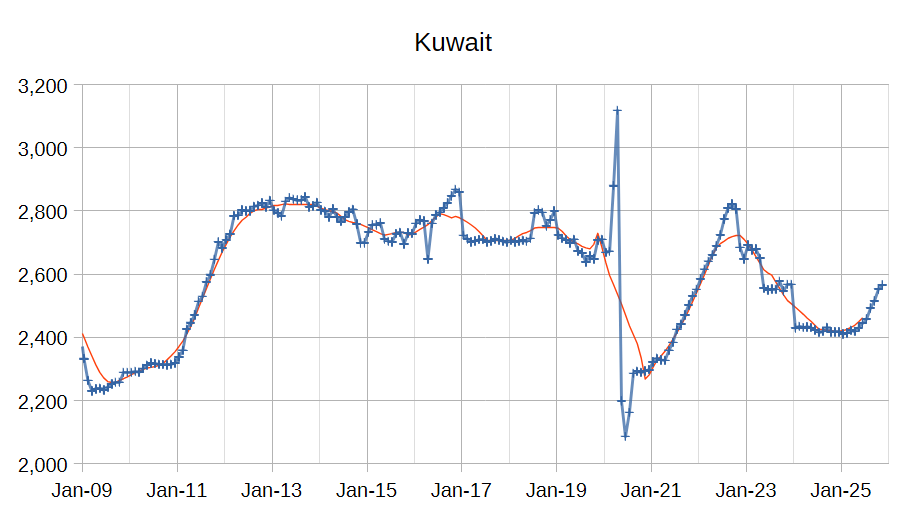


The chart above shows output from the Big 4 OPEC producers that are subject to output quotas and where most of OPEC spare capacity currently exists (Saudi Arabia, UAE, Iraq, and Kuwait.) After the pandemic, Big 4 average output peaked in 2022 at a centered 12 month average (CTMA) of 20849 kb/d, crude output has been cut by 766 kb/d relative to the 2022 CTMA peak to 20073 kb/d in November 2025. The Big 4 may have about 766 kb/d of spare capacity when World demand calls for an increase in output. Since April 2025 the OPEC Big 4 have increased output from 18346 kb/d to 20073 kb/d, an increase of 1727 kb/d in just 7 months (an average monthly increase of 247 kb/d.) The rate of increase in Big 4 output seems to be reaching a plateau. Note that some spare capacity remains if increased output is needed and also that UAE has surpassed the 2022 CTMA peak by some 250 kb/d, if this recent level of output can be maintained for 12 months or more then the spare capacity of OPEC would be 250 kb/d higher than the 766 kb/d indicated on the chart above, we will have to see what happens over the next 12 months.


No change in World demand from last month’s MOMR, Non DOC liquids and DOC NGLs have been revised higher in 2025 by 100 kb/d.

Refinery crude throughput is a measure of World demand for C+C (though imperfect because some crude is burned directly in power plants in the Middle East.) OPEC data shows the previous peak was 81.68 Mb/d in 2018. For the most recent 4 quarters (ending 2025Q3) the average World refinery throughput was 81.84 Mb/d, a new annual average peak which is revised higher than last month’s report by 70 kb/d.

From the December MOMR:
Preliminary October 2025 data shows that OECD commercial inventories fell by 32.0 Mb, m-o-m, to stand at 2,833 Mb. At this level, OECD commercial stocks were 62.7 Mb higher than at the same time last year, but 12.4 Mb lower than the latest five-year average, and 112.7 Mb below the 2015–2019 average.

OPEC expects only a 50 kb/d increase in annual average 2025 tight oil output in 2025 and an annual average decrease of 100 kb/d for US tight oil output in 2026.
76 responses to “OPEC Monthly Oil Market Report, December 2025”
Meh.
These posts are less interesting since it is mostly just a story about the latest data point in the series. After all, any trend/analysis can’t change radically. So the “story”, the “so what” ends up being same as month before.
You should go back to doing special topic post on specific plays or issues or analyses. Not ONLY the “one more month in a time series”. Where people mostly just complain about Trump, versus discussing the topic.
“ people mostly just complain about Trump”
Or people complain about other people objecting to Trump.
Although, really, let’s be clear: It’s not really Trump that is the problem, it’s his destructive policies. It’s true that he’s incompetent and his management style is harmful, but his policies are the primary problem. And his policies are very relevant to energy.
I’m still gonna need to see those Epstein Files.
Nony,
There has been a significant change in OPEC output from April 2025 to October 2025, then a significant change in the rate of increase in November 2025 relative to the previous 6 months.
As OPEC regulates its output and produces a significant portion of World crude oil (35% of World crude output) this may be of some significance. OPEC spare capacity is also likely important in the peak oil story.
If we look at Big 4 output in the past and sustained output for 12 to 24 months, the sustainable crude output capacity for Saudia Arabia, UAE, Iraq, and Kuwait may be only 20300 kb/d which would put spare capacity (assuming no sanctions relief for Iran and/or Venezuela in near term) at very low levels (227 kb/d). This assumes KSA=10000 kb/d, Iraq=4500 kb/d, UAE=3100 kb/d and Kuwait=2700 kb/d for sustainable capacity.
Nony
“These posts are less interesting since it is mostly just a story about the latest data point in the series. After all, any trend/analysis can’t change radically. So the “story”, the “so what” ends up being same as month before.”
Just visit once every six months
“Where people mostly just complain about Trump, versus discussing the topic.”
The fact that Trump claims all the Venezuelan oil belongs to the USA, having been stolen from them, is a topic that puts any discussion about oil on another level of absurdity.
https://www.msn.com/en-us/money/news/contextualizing-trump-post-about-venezuela-stealing-oil-land-and-other-assets-from-the-us/ar-AA1SxYvJ
global oil conglomerates making deals /= USA
Dennis,
Even that story gets lost in seeing one more extremely similar, monthly data series post. How about a head post on that new phenomenon?
I’m probably not the only person missing that new story. Nobody is discussing it. Just more Orange Man bad. And I’m not even defending the guy…just like to also have some oil analysis.
Honest, that stuff gets lost.
No y
It’s not just the repetition, Dennis does not even understand his own graphs. Earlier this year I said with non OPEC increase and with OPEC reversing cuts we would see a new global high. Dennis comes back with some rubbish about increases over the previous two years. So a new high will not happen for 3 years 🤔
He has zero ability to see potential changes from previous trends.
Then last month he declared a new global high as if he has discovered something no one else has seen.
This is what happens to a website when a narcissist runs it. No real research on his part just opinions that he thinks should be taken as from on high.
Including his non factual OPEC spare capacity, he hasn’t got a clue what is is.
Iver said:
“This is what happens to a website when a narcissist runs it. “
You apparently don’t know what a narcissist is. As an example, Trump is a narcissist who can never admit that he is wrong. In contrast, Dennis expresses limitations in his analysis regularly.
And since this is all archived in Dennis’s writings, we can actually find where he says that he could be wrong and doesn’t have all the answers.
https://chatgpt.com/share/6947cace-030c-8006-b6fd-ea5ae4dd49f7
You are barking up the wrong tree. We don’t have to do much work to show this, given AI search tools.
Anon —
This is why you shouldn’t watch “Business News” on your TV. Millions of Americans are fed a constant diet of miniscule twitches in the stock market most can’t afford to invest in. A random 0.01% move up is marked with huge green arrow going up, and a 0.01% move down gets a huge red arrow going down. What follows is the traditional reading of tea leaves.
It’s kind of pissy of you to whine though, considering it is a free service. You’re like a teenager complaining about his mom’s cooking but not brave enough to go it alone. Complaining about forecast accuracy seems particularly dumb, since the methods are open and are based on limited data. Considering how much energy you spend complaining here, you might consider doing it better on your own site.
Anyway here’s something longer term gristle for your mill: India’s (and Pakistan’s) vast Thar desert is rapidly turning green. Photosynthesis is up by a third since 2000. It’s probably anthropogenic, being driven by burning fossil fuel.
https://www.sciencedirect.com/science/article/pii/S2949790625000606
https://www.tandfonline.com/doi/full/10.1080/15481603.2025.2483458
Paul
Maybe it’s you that does not know what a narcissist is?
https://movingforwardafterabuse.com/false-humility/
The real test of a narcissist is when you challenge them directly. That is when they show their real character.
There have been some very intelligent and insightful posts here. Never once have I seen Dennis say. “I have never thought of that or can you explain this further.
It must be really boring knowing everything
Alim- thanks for sharing that science piece on the greening up of the Thar desert over the last 20 years
https://www.sciencedirect.com/science/article/pii/S2949790625000606
That area has experienced a “A significant rise (64%) in precipitation occurred over the Thar during 2001–2023”. We shouldn’t be surprised since the warmer atmosphere holds much more water vapor than it did previously. Good news for some areas, if you live well above the old floodplains.
Conversely, other areas have become much dryer, and others much more variable as we should expect.
Iver,
Funny how its only accusations, as no reliable evidence from PeakOilBarrel.com in Dennis’s own words that demonstrate narcissism in him — at least not in the sense of direct self-description, self-praise, grandiosity about his own importance, or psychological narcissism. There’s nothing in his own blog posts or comments that would qualify as diagnostic of narcissistic personality traits. Criticism from other commenters alleging arrogance or ego do not constitute evidence of narcissism as a personal trait. They show how some community members perceive his tone or debate presence, not what Dennis says about himself, which is typically technical and analytical, not self-referential or grandiose.
To demonstrate narcissism in someone’s writing, you’d look for him making statements like:
“I am the best at X”
“No one understands this subject as well as I do”
i.e. Repeated grandiose self-praise
AI search and in my own recollection there are no such statements in his published posts or comments to be found. Dennis is more the exact opposite — dare I say humble to a fault.
give it a try, ask chatgpt
Iver
Dennis being a narcissist? I have no idea as how to describe him like that, and I struggle to imagine that without knowing him in person. Dennis protects his point of view like most of us and otherwise use hard facts and points to them frequently. If his opponents tries to belittle, I wonder what their real motives are.
https://www.youtube.com/watch?v=TqjLiubJf48
10 Minutes
USA oil companies don’t want Venezuelan oil?
Rig Report for the Week Ending December 19
The rig count drop that started in early April 2025 when 450 rigs were operating dropped to its previous low this week. Drilling continues at unabated rates with WTI below $60/b.
– US Hz oil rigs dropped by 6 to 362, down 88 since April 2025 when it was 450. It also returned to the low of 362 rigs first reached in the week ending August 1. The rig count is down 20% since April.
– New Mexico Permian dropped by 2 to 94. Lea dropped 3 to 61 while Eddy added 1 to 33.
– Texas dropped 3 to 167. Texas Permian dropped 1 to 132. Midland was unchanged at 24 and Martin dropped 1 to 26. Loving dropped 2 to 14 while Karnes added 3 to 8 two weeks ago.
– Eagle Ford was unchanged at 27.
– NG Hz rigs added 1 to 111.
A Rig
Frac Spread Report for the Week Ending December 19
The frac spread count dropped by 8 to 160, a new low. From one year ago, it is down by 50 spreads and down by 55 since March 28. December is the beginning of the yearly spread count drop associated with Xmas.
A Frac
Thanks for keeping track of the global refinery throughput. I presume that data is more reliable than global well production. Anyone think that presumption is incorrect?
The percent of global oil that does not go through the refining process is said to be negligible (less than 1%).
Interesting question.
AI summary:
“Saudi Arabia burns significant amounts of unrefined crude oil for power, averaging around 0.4 million barrels per day (bpd) in recent years, but this figure fluctuates, spiking to over 0.9 to 1.4 million bpd in hot summers (like 2015) and decreasing when gas or renewables are used, with some recent data showing efforts to reduce it below 1 million bpd annually as part of Vision 2030 goals.”
Seems expensive.
It is one of the microeconomic indicator arguing against the Matt Simmons style worries about Saudi oil reserves. It is a good in excess, within The Kingdom. Yes, they constrain external supply (to prop up prices). But within the country, it can be wasted (burned, rather than refined). This is classic cartel/monopolist style behavior.
“ This is classic cartel/monopolist style behavior.”
Yes, indeed. The line between the royal family and Aramco is very thin, so it’s extreme crony capitalism and Aramco has very little pressure to be efficient. That means that people within it can pursue their own interests rather than the interests of the company or the country, which in this case is protecting the oil focus of the company rather than allowing new energy sources to develop.
KSA has known that it needs to develop solar for domestic power to replace crude, for a very long time, and has published endless proposals to pursue it, but it has taken forever to happen. It’s starting to happen now, finally.
The same thing has been happening in the major car companies – internal power struggles to protect careers based on ICEs have crippled their ability to pursue EVs. That’s why it took a new company dedicated to EVs alone (Tesla) to kickstart EVs.
Hickory,
I do not know if the data is more accurate or reliable. I think of refinery throughput as an indication of Global demand for C+C, whereas global production of C+C would be the supply of C+C, any difference (minus crude burned directly in power plants, mostly in the Middle East) would either add or subtract from global crude oil stocks (we do not have very good data on global crude oil stocks so determining the accuracy of either supply or demand is difficult at best.
DC. On accuracy of the data- many people have presumed that their own country/company data was accurate in most ways, and perhaps that our adversaries or those with brown skin or a different religion had suspect data.
That is of course flawed thinking.
But what incentive is there for accurate data on oil production by any entity?
In fact I think there may be market or strategic incentives to falsify published information.
Unfortunately.
Nonetheless, thank you guys for doing your best with data is available.
I think we can be confident that for this year and perhaps next there are adequate, if not plentiful, supplies of oil globally.
Enjoy the moment while it lasts. ‘Enjoy’ means make use of this grace period to get ready for the likely time when oil is not plentiful or so readily available.
Guyana seems to be on the path to making good use of their oil revenue-
“Guyana is reinvesting oil revenues into solar, hydro, and other renewables as part of a strategy to reach 80 percent renewable electricity by 2040.
A good path:
“ On World Electric Vehicle Day 2025, Guyana reflected on its fast-growing electric mobility sector and its role in building a modern low carbon future. Over the past five years, the government has stepped up investments to expand the use of electric vehicles, strengthen charging infrastructure, and develop local skills. These efforts are fully aligned with the Low Carbon Development Strategy 2030.”
https://www.jointsdgfund.org/article/guyana-accelerates-electric-mobility-world-electric-vehicle-day
Hickory,
There are many different entities that gather World data on output of C+C, the free data is available from the US EIA and the Energy Institute.
Chart below compares EIA and Energy Institute World C+C data from 2000-2024, on average over this 25 year period the Energy Institute estimate is about 1000 kb/d higher than the EIA estimate.
world cc2512
Rystad discussion of the “Waynesville” (Western Haynesville):
https://www.youtube.com/watch?v=p6HjLXzMRt4
My observations/comments/questions:
1. In general, the discussion is a little handwavey. No charts are presented (and minimal numbers). Perhaps the former is because of the “podcast” format (audio). But it is a shame as the presenter is an expert and could be more numerically analytical.
2. The play name is unfortunate (I agree) since it is really not an extension of the commonly driller Haynesville/Bosier. E.g. the counties are not part of the classic map on Enno’s H summaries (or anyones). It’s like skipping a couple hundred miles, rather than just moving to the fringe.
3. Wells have been collosal (20+ MMcfd IPs). Here I would have appreciated a chart comparing the typical Wayne well (perhaps length normalized) to the typical Haynesville, Marcellus, and Deep Utica well. The impression I get is sort of “Deep Utica”, but not clear really how they compare. Just looking at headline wells is not sufficient.
4. Major issue is cost. 2 mile laterals are pushing $40 MM. This requires $5 gas to be competitive, even with massive productivity. The hope is to get these prices reduced. But we heard that story with the DU as well. It’s not exactly the same thing (e.g. closer to HH), but think a comparison of the Waynesville to DU would shed light on each.
5. Expert mentioned that wells are maintaining high production more than anticipated. I would love some numbers here and some comparison to other plays, H, M and DU. I suspect part of the reason is choking because of infrastructure constraints (and the huge potential IPs). Still, it is a promising sign. But would like more analysis.
6. Vertical depth is in the 19,000 ft range. That is deeper than the H or the DU. Again would like some chart with comparison.
7. Wells have very high reservoir pressures, somewhat of a technical (i.e. cost) challenge. Think it is higher than the H or the DU (which are similar). Would like a numerical comparison of classic (sweet spot) wells. Also comparison to GOM gas wells, which can be very high pressure also.
8. There’s an open question of how far the play extends. There’s sort of the classic central area that Comstock and Jerry Jones (yes that one) are going after. But other companies are trying to step out. In general, whether the play is restricted to Comstock core or to further out, it will still be smaller in area than the H.
9. Even with the Comstock first mover advantage (relatively, there has been vertical drilling going back decades, and even some hzes), this is a play that does not require M&A. Possible for other players to lease land and build up their own positions organically.
10. Infrastructure is a challenge, overwhelmed local capacity early in Comstock exploration. It is close to GOM markets though and within TX (so more regulatory friendly). So, just kinda one of those things that would be needed to get the play going, but not a NE liberal blocker type thing. A cost/time issue.
11. He sees production growing to 2+ BCF/d, from 0.5 right now, with an 8-rig program in the play (currently is at 6). So…needle moving, but not another Marcellsus or the like.
12. Some discussion of macro and of whether LNG demand (and implicitly higher prices) will drive demand/development of the WH (or of other “new” gas plays). I agree with his economic view, that shale oil and gas have very different demand drivers. Shale oil responds to a world price (and implicitly OPEC) and is the marginal barrel. Shale gas on the other hand is mostly going into a trapped geographic market. It will respond as needed if price increases (and lately the issue has been more the opposite, that there was too much of it and it crashed HH).
He does see it as open question where the added volume for increase volume demand (LNG and domestic growth). But it is not at all clear that it will come from the WH or comparable “exploration”. He makes the point (which I have also) that the Permian is getting near zero gas prices. And if connectivity is provided such that HH is available, then gas driven development of the Permian can occur (“in deeper formations”, i.e. THE BARNETT…and yes, in the Permian Dennis, not the one you are thinking of). Also that gas driven development of other oil plays can occur (i.e. Powder/Nio/Anadarko/EF) where there are gassy parts of the play. $5 makes a huge difference versus $3 for marginal gas condensate wells.
Probably another question, that won’t get answered soon, is the “downspace-ability” of the play. E.g. if IPs are huge and duration long because they are more efficiently draining the reservoir (perhaps the layer is more permeable or the pressure pushes more stuff out from the well boundary), that is great from a financial standpoint (less capital for same production), but is a negative in terms of total resource. I just don’t expect that question to get pushed now, while they are trying to get a handle on the play geographic extent and on technical cost reduction.
the depth of this Western Haynesville is well over 15k ft, and up to 19Kft, compared to Utica deep dry gas at 12~13K ft much like Eastern Haynesville.
Both Utica and Haynesville have quite some thickness over 150ft or dual stacked pay, Haynesville and Bossier, Utica and PP.
The porosity for Eastern Haynesville is probably the largest reported from Shale oil and gas basins, most are over 10%! So, I would guess that the current limit on EUR in Haynesville is the fast decline caused by fast closure of fractures, and not draining more/less volume.
I did a comparison of major shale gas basins here,
https://www.linkedin.com/pulse/comparing-vaca-muerta-shale-oil-gas-best-us-patches-production-wu-tw42c
Xie xie.
I wonder how the reservoir pressure compares to DU. I was under the impression that DU had higher pressure than the H, but perhaps that was just hype.
Nony,
There were 3 Deep Utica wells that had initial pressures of about 10,000 psi with depths – IIRC – in the 12,000/13,000 foot range.
However, the formation goes deeper (with, presumably, higher pressure) as one travels easterly for several miles … acreage that has yet to be drilled.
For (some) contrast, Seneca’s 5 well Utica Taft pad in Tioga county is at 11,000/11,200 foot depth and flowing on restricted choke at ~28,000 Mcfd for almost 11 months now for 4 wells. The fifth is at ~23,000 Mcfd on restricted choke.
The parameters of Waynesville are on a whole ‘nother level.
The hardware from recent offshore development (20,000 psi capable) should come in handy here.
One possible ripple effect, should oil prices rise, is that the re-entering of the Tuscaloosa might become viable as that challenging rock was/is producing (minimally) oil at 16,000+ feet.
Coffeeguyzz,
Thanks for the note on ultra-high pressures in Waynesville, and update on the Seneca Utica pad, and the Tuscaloosa oil at 16K+ feet.
I want to correlate Tuscaloosa oil possibility at 16K+ feet with the ever-more oil in GOM/A and Haynesville that Nony brought up here.
The very early starting model for oil and gas generation kinetics is by Tissot, and his model basically says that by ~4km (13K+ft, 120C) with normal temperature gradient, all will be cooked to gas due to mainly the higher temperature, or indicated by maturity index Ro (vitrinite reflection%) higher than 1.6.
https://petroleumsystem.blogspot.com/2021/02/where-did-all-gas-go.html
But, in 1990s the maturity index reading pretty much failed because the measurement tool became pyrolysis instead of Vitrinite Reflections, then in 1995 came the BP’s Pepper & Corvi model (PC 95), claiming that unless temperature is over 200C, otherwise the oil generated will stay as oil and not converting to gas.
https://petroleumsystem.blogspot.com/2021/02/where-did-all-gas-go.html
Haynesville has higher temperature gradient, and so the East Haynesville at 12~14K feet has temperature around 170C to 190C, should still have all the oil generated (80% from TOC kerogen cooking) somewhere and in 2012, a paper using the PC95 model, claiming gas to oil ratio at 1:4.
https://gcags.org/Journal/2012.GCAGS.Journal/GCAGS.Journal.2012.vol1.p81-96.Nunn.pdf
But, Haynessville drilling confirmed that the early Tissot model was correct. At 4km things will start to become all gas with normal temperature gradient, and with higher temperature gradient as east Haynesville is, the cooking is more complete, without any wet C3+ left, only a trace amount of C2 ethane, same is true for Eagle Ford in Webb county at 14K ft, and Utica at >~12K feet.
So shale and deep drilling results in the past 25 years confirmed than just at temperature of ~ 150C, all will become gas given over 20million years of cooking for marine sourced fluids. So, Tissot model is much closer to reality.
However, the deep drilling results in China’s Bohai bay and deep water in Brazil presalt shows that Saline lacustrine sourced oil could stay at much higher temperature than marine sourced fluids, and more oil, the GOR before oil cracking into gas is much lower by a factor of 10, and API density is also lower by ~7~10. So for GOM/A at >25~30K+ feet the oil is still plenty heavy oil with lower temperature gradient, and temperature at >350F or >180C. In Bohai bay, at 200C, the GOR is still about 1:1.
Have to hand it to Trump. No President has had a closer relationship with KSA, UAE and Kuwait than him. He’s even closer to than the Bush family.
Getting this group to boost production around 1.7 million BOPD has been a real coup, maybe one of the only things that will be helpful in the 2026 midterms.
Looks like the Trump family is going to let go of the reigns in 2028? Setting up to be JD Vance v the far left?
Any predictions on 2029-33 oil prices if:
A. JD Vance is President?
B. AOC of some other Democratic Socialist is President?
Our oil production misses George W. Bush. 1999-2014 was a great ride, and was mostly due to Bush Administration policies.
Unfortunately a lot of US service persons were killed or injured as a result.
I’m just trying to stir you guys up. I’d gladly take something stable. I used to say $65 WTI, now I think $80 given the crazy inflation we continue to deal with. Electricity rates will be going much higher it appears.
Any predictions on 2029-33 oil prices if:
Yeah, I have a prediction. That right-wing conspiracist theorist J. D. Vance got crushed by a Democratic moderate. The right-wing MAGAs get crushed in the midterms. The Democrats flip 50 seats in the House.
Shallow Sand,
I doubt who is elected President will affect oil or natural gas prices very much. My guess is oil prices in the $60 to $75/b range and natural gas in the $3 to $4/MCF range in 2025 US$ from 2026 to 2030. After that it will depend on the policies of the US Government where both who is elected to POTUS and Congress will matter. If we have more of short term thinking of Trump, prices might rise due to too much dependency on fossil fuel, though also possible the US fall so far behind the rest of the World on new technology due to protectionism and reliance on 20th centuru energy and demand for energy is low due to very poor economic performance relative to the rest of the World.
The US is falling behind and may never catch up, in terms of the technology of the 21st Century.
I think the effect of the specific president will be small. Democrats like to talk energy transition when they are with their base, in the primaries. But in the general election they scurry like cockroaches at the prospect of being tied to higher gasoline prices.
It’s probably a small uplift factor for price to have a left wing administration (president and/or Congress). Maybe a handful of dollars. On average and with all kinds of other gyrations from OPEC, demand., etc. having larger discernable impacts.
Agreed on the inflation, wrt observing oil prices. $60 is $44 from a decade ago. Who’d a thunk the USA would be kissing 14 MM bopd at under $45 real price. It’s almost like Maugeri was right.
The issue with baseline projections from EIA and the like was not that they were too high, but too low. In other words the doomers here should have been warning on the high end, not the low end, when they wanted to talk truth to power at the DOE. Or at least they should have had serious floor to ceiling uncertainty bars…I warned them as much. I was even fine with the negative peaker view, even if they favored it. But they also needed to have something like the “high resource and technology” case from the AEOs. Just to bracket uncertainty, about a new phenomenon.
I’d say the same about electric cars from ten years ago. It’s fine to have (or have had) a negative forecast, to be anti-hype. But your uncertainty should have included a “faster than the hype” model as well. But then this is from a market analysis standpoint, not a preaching to the choir standpoint (which is what this blog mostly, but thankfully not completely, is).
I think HH natty low prices are here to stay. On average, not the seasonal and yearly gyrations from colder/warmer than expected winters. $4.00 in 2025 is the equivalent of $2.93, ten years ago. I have to keep reminding myself of how much inflation we had recently!
Nony,
Maugeri’s prediction for US tight oil was very good, he predicted unrestricted output (optimistic case) of about 8.4 Mb/d in 2020, the centered 12 month average(CTMA) for November 2019 was 7.9 Mb/d and of course we had the pandemic dropping output after March 2020, output reached 8.4 Mb/d by May 2023 for CTMA. The paper was published in June 2012 and looked out only as far as 2020. Note that his adjusted output (taking into account factors that might not allow the maximum to be reached) was about 6 Mb/d for 2020 which proved to be 1.9 Mb/d too low.
A very good guess for 8 years in the future.
Didn’t notice this posted before (mea culpa, if it was).
ND Director’s Cut was dropped a few days ago:
https://www.dmr.nd.gov/dmr/oilgas/directorscut
I get the impression they stopped using the old pdf Word document and are doing slides now. Like it slightly better. Watched the call (after) also, at 2x speed.
1. Production for OCT was flat (up less than 500 bopd).
2. Gas was flat (very slightly down). Not sure why. The trend has been gas going up while oil flatlines. Might just be a this month variation. No reason was noted.
3. Interesting chart, looking at quarterly production by state (EIA data). Kind of averages out some of the monthly chatter. ND is nearly flat for last 5 years. NM and TX up about equal amounts. I was surprised the seasonal variation was not more noticeable, but it kinda disappears on a true zero chart.
4. Differentials are $6-7 worse for ND crude (versus WTI) because of transport challenges. This means at mid 50s, the operators are getting high 40s. This is starting to make some give verbal comments about cutting back (not seen in the data yet).
5. Frac crews down dramatically, but that is normal for the holidays. Wonder if they go back to work in the new year or not.
6. Nice chart and discussion on lateral length. The average new well is not 12,000 ft. Was 10,000 ft for over a decade. This shows the 3 milers actually starting to be a more significant behavior.
7. One nice chart on time savings per well. Time to drill has gone down dramatically. And time to stimulate has stayed stable, but this is despite the lateral length increasing. So…yes, they are still getting more efficient.
8. Gas takeaway is still a challenge and produces negative diffs. Gas processing (NGL stripping) is good, until c. 2029, at which point more will still need to be added. (Gas is going up despite oil flatlining.)
Nony,
Don’t know how much that 12,000 foot average is from the 3 milers (a few 4 milers are/were being drilled under the river, also), but a few Nodak operators are now also drilling U shaped laterals where it makes sense … primarily on 640 square acre leases.
The ‘turn’ is fairly broad and would, therefore, add considerable length to the lateral.
Bruce Oksol has been describing these innovations over the past several months on his site.
These U shaped wells might have an outsized impact on the App Basin as there are no uniformly geometric leaseholds there.
Gulfport just announced a significant increase in their economically viable inventory by using this method as a single vertical with different ‘leg lengths’ can now maximize more formation access with reduced cost.
Using NDIC Data from
https://www.dmr.nd.gov/oilgas/stats/statisticsvw.asp
Chart below has North Dakota’s natural gas production, pretty flat since the start of 2024, the centered 12 month average(CTMA) was 3.45 BCF/d in August 2024 and 3.46 BCF/d in May 2025. A fairly small increase in output at best. Blue line is CTMA on chart linked below.
Over the past 1.5 years GOR has been increasing at about 0.09 MCF/b per year. Longer term (June 2021 to May 2025 using CTMA for oil and gas) the annual rate of increase in GOR is about 0.07 MCF/b, but the higher rate of increase is more likely with low oil prices and low completion rates in my opinion.
You should check back on those charts on drilling and completion. The downtrend line was from spud to final stimulation (end of fracking), the level line was from after last frack to first flow (flowback and other processes to get well up and running, I am not familiar with the details of all the steps needed.) Bottom line much of the drilling and completion processes are included in the downtrending line, it is not drilling only afaik.
ND gas output
Bakken lateral lengths YTD 2025 average is 11605 feet, see chart linked below for 2020-2024 estimates.
Also see link below for cumulative well profiles from 2020-2023 for ND Bakken/Three Forks from Novi
https://public.tableau.com/shared/285B36H4F?:toolbar=n&:display_count=n&:origin=viz_share_link&:embed=y
Note that longer laterals resulted in lower EUR from 2020-2023, so longer laterals might reduce cost, but we also see lower output per foot of lateral completed at least up to 2023.
Bakken lateral length
Dennis:
Good catch. The 12,000 feet was the 2025Q3 average, not 2025 overall, which the director’s cut said also was 11,600. See slide 14:
https://www.dmr.nd.gov/dmr/sites/www/files/documents/Directors_Cut/2025/Directors_Cut_2025-12-19.pdf
Dangers of (my) skimming PPT and speedwatching the video. 🙂
Coffee, see page 15 of the PPT (from previous links).
The change is almost all a 3 versus 2 phenomenon. 4milers remain an oddity. There is a definite trend (with some gyrations) of 3 displacing 2.
I’m not sure how much U-ing (or J-ing) is going on. I’ve seen it written about a lot, and in the context of the Permian. But these are big boys and will take something that works somewhere and use it wherever their calculations say is best option. I think I remember seeing a note about some of it going on in the Bakken also, on a recent Director’s Cut.
To me, it’s just a 2 mile lateral (if you U inside 1 mile spacing). Could be basically dictated (if surrounding units already developed). In other cases, maybe it is a tradeoff (hassle factor) versus doing acreage swaps or JVs with the neighbors. (I am curious about how the Chevron “checkerboard” is being developed, in the Permian.)
Maybe we will get some serpentine pattern? Or people drilling mazes? Pornographic stick figures? 😉
Dennis,
Agreed that EUR/ft gets worse with longer laterals. (I’m not making a corny assertion the contrary. I already agreed, in a recent discussion!)
For all I know 2 versus 1 mile laterals can also lead to some small degradation. There are comments about worse stimulation at the “far” end of the well.
This is not the only phenomenon behind EUR trends. Could also be some “using up the good stuff”, irrespective of lateral length. Also superimposed on that are possibly small improvements in design (but washed out in the net).
Also, to the extent that longer laterals enable some “fringe” acreage to get pulled in, that also is a negative factor (as that’s rock that would be undevelopable otherwise). In addition to the worse stimulation itself.
It’s mostly a phenomenon of fringe acreage and of low oil prices. The two are linked of course as the “fringe” in $100 oil is different than that of $50 oil. If you have a prolific resource and high oil prices, you might not even want to do 2 mile laterals. As the cost savings is not worth the loss in production. This was EOG’s argument about how they developed the Parshall/Sanish sweet spot of Mountrail County.
At the most extreme (in terms of high production/price), you might even opt to do verticals only. Because cost becomes a minor part of the equation and getting more oil becomes more important.
You can see this extreme in gold mining, for instance, which I’ve done, briefly, and at a commercial scale. At high gold prices (I can remember when $2000 was high), a mine becomes laser focused on throughput and yield (getting more gold out) and cost reduction becomes very unimportant. The converse happens when price crashes of course.
I would say right now, at under $40 (2015 real, with diff), the Bakken is in the “gold price crash” regime, not the “boom” regime. Of course, it is always a tradeoff (what you spend for what you get) at any price, but the dynamic is really different in practice, for the companies in high price versus low price regimes. I mean…if you have a zero cost way to increase production (just some technical change of practice) that will always be favored, even in low price regime. But fancy bells and whistles (e.g. ceramic proppant) only make sense in the high price and high resource regime.
Dennis,
Thanks for the gas chart. I’d say it’s “flattish up” for gas and “flattish down” for oil.
Not a disagreement, I hope. And yes, your chart was good, showed the picture well.
Probably a lot more dramatic if you go back to 2015?
Yeah, I took another look at slide 12. Not sure why they measure it like that (perhaps that is the data they have). I would like to see spud to start of stimulation. And then start of stimulation to POP. But that appears not to be their graph.
In any case, they are getting overall faster at the day rate usage. Which is impressive because the average well is longer!
Of course even that interpretation may be wrong. E.g. if there is “idle time” between completion of drilling and start of fracking, it’s possible just that is being cut.
Really…what I’d like to see is days of drilling and days of fracking. To see if day rate usage (i.e. supply company days paid) is going down. But…they didn’t graph that. So…I can’t be 100% sure what story slide 12 shows!
Nony,
I wonder if that slide 12 will be revised in the future. The sharp change in trend starting in 2025 compared to the 2022 to 2024 rate of decrease looks like it could be bad data. We will see if this changes in the future. Also possible that fewer rigs and frack crews might lead to an A-team effect where the best crews are most efficient.
Note that for the past 4 quarters the average lateral length is 11469 feet(2024Q4 to 2025Q3).
Yeah, could be high grading of crews. Or even projects, like the “easy to get to” ones.
Nony,
I agree, low prices tend to have this effect as you pointed out in an earlier comment. I expect if prices remain this low we will see continued decline in Bakken/Three Forks output.
I think you meant change in GOR going back to 2015? You are correct from 2013 to 2025 the annual rate of increase is 0.17 MCF/b per year (using OLS trend). The past 48 months the rate of increase in GOR (using OLS trend) has been less steep at 0.084 MCF/b per year. Future trend is of course unknown. Note that I use 12 month increments to try to filter seasonality in the data. It looks like the trend changes in late 2021/early 2022, the 48 month period is the closest 12 month interval to this statistical break.
I hoped, briefly, that this was all humor. But no – it appears that it’s easy to buy influence with this president.
I said recently that bad policy was more important than bad personality, but I’m wondering if that’s still true. This president’s personality flaws go way beyond philandering: it is so bad that it affects policy. Someone so corrupt, so eager to embrace blatant conflicts of interest, is a danger to his country.
Trump, Trump, Trumpitty Trump-Trump.
Dallas Fed Energy Survey is out for 2025Q4, lots of information, comments are interesting.
https://www.dallasfed.org/research/surveys/des/2025/2504#tab-report
also see chart linked below from that survey
dallas fed energy survey
Note to All (Definitely oil/energy related) …
As the mighty algorithm marches on, one can get ‘bombarded’ with topics fed constantly the more one reads/watches on said matters.
This is playing out in Coffeeguyzz’ world relating to Small Nuclear Reactors, specifically the Molten Salt Reactor hardware just shipped out of Austin manufacturing plants up to Idaho for assembly/testing/expected licensing process (3 to 4 years’ long according to my new chatbot buddy).
If/when approved, the commercial rollout is apt to be exceptionally rapid as a great deal of the hardware is ‘off the shelf’, high nickel alloy components already used in various (primarily chemical) applications.
Bottom line … while I am still woefully uninformed in these nuke matters, the tea leaves strongly suggest a paradigm shattering confluence of events manifesting in about 6/7 years time that portend to a new reality of low cost, near ubiquitous energy abundance (at least in North America).
This abundance will be made possible by the current circumstances of undeniable liquid hydrocarbon (over) availability, massive supplies (and growing) of ultra cheap natgas, the absolutely mind blowing demand for data center-driven electricity NOW (!!!), all to be joined by the introduction of widely dispersed, rapidly deployed, moderately priced SMRs.
The above scenario may well have a ‘lead time’ (starting in ~3/4 years’ time) in which forward lookers might ‘see’ which ways the wind be a blowin’.
Words to the wise …
Coffeeguyzz,
Low cost nuclear power has been right around the corner for about 70 years, one can believe the hype or remain skeptical. Will these “low cost nukes” be able to compete with solar, wind, battery storage, natural gas, and coal power? Perhaps or perhaps not. Seems a coin flip from my perspective.
It’s not as batshit hopium as the fusion scientists (who are really just running a jobs program for Ph.D.s). But I agree with Dennis. A lot of these ideas for better reactors were being touted by Jerry Pournelle in the 70s. And they didn’t happen (even in other countries).
And going back, I see a lot of the sexy nuclear ideas were being pushed in the 50s! Rickover said about sodium, “if the world had sodium oceans, some damn fool would want to build a water reactor!” And he actually (had) built two at scale operating naval reactors, using sodium. So…did more than the hypesters.
A lot of the cost/benefit for nuclear plants hinge on scale. For power plants in general, really. But especially for nuclear given the more extreme design requirements and tighter regulatory and operator training costs and the like.
Coffeeguyzz,
Nuclear went in the 70s for big installations to save money, but it didn’t really work. Going small probably won’t either, not least because each plant needs a security perimeter. This is the classic consultant trick of recommending decentralization of centralized structures and centralization of decentral structures and collecting fees for both recommendations.
The other problem is that nuclear only produces hard radiation and heat, the two least useful forms of energy. To get electricity, you need steam turbines, the bigger the better. This is a strong argument in favor of big reactors.
Steam turbines as a method of generating electricity have sharply declined in recent years. New thermal plants are often combined cycle gas, where the steam turbine is only used to mop up waste heat from the main cycle. Fluctuating renewable output is killing the economics of good old fashioned inflexible baseload 24/7 power plants.
This leads to the problem with nuclear that you can’t reduce costs by cutting output. There have been some progress in increasing flexibility, but the cost of running a plant not producing anything useful stay about the same.
And as a last remark, there are no designs for small nuclear reactors that have been completely approved in America. You may hear other claims on line, but the devil is in the details.
As Anom said “A lot of the cost/benefit for nuclear plants hinge on scale.”
That is a big point.
So far the projections for cost per kwh on SMR’s is penciling out much higher than for full size reactors.
Full size standard design is where the sweet spot on cost is, as other countries have been showing.
And also I’d point out that some of these designs are really not modular.
DC, Nony, Alim, Hick …
While I thank you gentlemen for offering qualified rebuttals to my observation that widespread SMR adoption looms just over the horizon, the past several hours of my researching – largely (not exclusively) via ol’ chatbot – has MUCH further reinforced my original view that we are on the cusp of vast, economic electricity availability (and, by extension, other forms of energy).
Probably by the Year Anno Domini 2032, or thereabouts, although the trend should become much clearer long before that.
I specifically addressed each of your above concerns to ol’ chatbot and the avalanche of info (all verified by my additional checking) emphatically displays (to me, at least) that virtually every one of your stated ‘shortfalls’ is/has been or is on track to be minimalized or eliminated.
Along this brief info-gathering journey, I learned of TRISO fuel, HA/LA EU, FOAK/NOAK production, the particulars of the US government testing/approval process, and – somewhat eye opening to moi in an area where I feel some degree of expertise – the LCOE comparison of Kairos’ Molten Salt Reactor to offshore wind (spoiler alert, OS wind gets its butt kicked).
So, again, I claim no comfortable degree of knowledge in this realm of SMRs.
As such, I will refrain from engaging in further debate on this topic.
That said, as anyone following this site well knows, I am a stout, long running unabashed booster of all things hydrocarbon … production and consumption.
However, it is readily apparent that small scale nuclear is on track to disrupt the entire current energy ‘universe’ paradigm in the coming years.
The strong support of the US government will accelerate this transition.
Addendum …
For those of you interested, post this query to your favorite chatbot …
“What is some constructive criticism to early SMR bashers?”
If one includes comparisons to offshore wind generation, the results are downright hilarious.
CG,
I’m baffled that you’re more enthusiastic about nuclear than solar and wind. I get the feeling that FF advocates are often enthusiastic about nuclear because it’s…so far away, and not a realistic threat any time soon. In other words, like hydrogen passenger vehicles, it’s a distraction, a red herring intended to slow down the primary realistic alternative to FF.
Solar and wind with storage are generally cheaper than projected SMR costs, and renewables & storage will continue to reduce costs while all recent experience with nuclear tells us that SMR costs are likely to be higher than projected (e.g., projected capacity factors are unrealistically high). Renewables are here now – they’re much faster, cheaper, cleaner, simpler, and don’t need fuel imports, waste disposal or unusual decommissioning. IOW, they’re much less risky.
The key question is: which thing is sensible to plan for? Should grid/ISO planners rely in some way on SMRs, or simply proceed with renewables? Should consumers expect SMRs to affect the availability or pricing of electricity anytime soon? The answers to both are obvious.
From a public policy point of view, there’s a fundamental question: what about weapons proliferation risks? So far, the world’s nuclear powers have been criminally negligent in preventing proliferation, and there’s no sign that humans will get better any time soon at managing the existential risks of nuclear weapons. Do we really want SMRs to spread around the world??
Coffeeguyz,
I think you’re asking your chat buddy the wrong question. You should ask “what are the disadvantages to small modular reactors”, and your buddy will tell you about the higher cost of energy, the reduced fuel efficiency, the increased levels of nuclear waste over standard reactors, the safety concerns, etc.
Look at ‘red-flags’ through rose-colored glasses and you only see ‘flags’.
The history of SMR’s so far shows that much of the hype is getting scaled back.
Coffee. You might want to extend your research a little to include the company Fervo.
On the cusp of what will become a big industry, perhaps challenging nuclear on a cost of electricity basis.
Nick G
About spreading SMRs all around the world:
Proponents of nuclear power argue that nuclear is safe, and point to its history. They usually count fatalities, but the 400 nuclear plants of the current fleet have produced a big insanely expensive accident every 15 year or so.
The big idea is to vastly increase the number of plants, up to 10 000 worldwide. If they are as safe as the plants have been historically, we should expect a fiftyfold increase in accidents, or about three major accidents a year. That doesn’t sound politically feasible to me.
On a related note, the only country keeping nuclear energy from declining now is China, which is building enough to roughly maintain the current fleet size. Nearly all of these are in densely populated Eastern China. I wonder what would happen if there was a big accident there.
Alimbiquated,
I agree – even if nuclear accident risk was reasonable on paper, the general public isn’t really good at understanding or handling risk – we’ve seen that with air travel.
There’s something worth mentioning about Fukushima: when the area was evacuated families weren’t allowed to take their pets with them. They just had to abandon them. About 100,000 pets, probably mostly beloved family members, died terrible deaths. There may not have been human deaths, but there were deaths.
Now, nuclear advocates might argue that this was simply mismanagement by the Japanese government, and I would agree. But it doesn’t provide any reassurance that humanity is ready to properly manage nuclear risks.
The thing I’m most worried about is weapons proliferation – as I understand it SMRs need more highly enriched fuel, which creates more weapons risk. I can’t believe nobody is talking about this risk. It’s much, much worse than the risk of nuclear accidents.
60 minutes piece on torture of Venezuelans by US (via El Salvador) at link below
https://drive.google.com/file/d/1dMvfzADptlpIk9qPLLzNVc2wCPOtwBwt/view?fbclid=IwY2xjawO3yAVleHRuA2FlbQIxMABicmlkETFRZmdqbjA1cEVpSWhsdWg5c3J0YwZhcHBfaWQQMjIyMDM5MTc4ODIwMDg5MgABHrtF9NUiIDD3LxfwUEEF1VaRYmoUrgJhjHEeYQ6mit-o9-PMXeIABCJYrSur_aem_xVvfUprCTRXMD_PPfhqZrQ
Mr Shellman provides some history of the Venezuelan Oil industry in post linked below
https://www.oilystuff.com/single-post/la-apertura-1
Two things that nuclear, nat gas, and geothermal electricity generation have in common need for-
Turbines.
And Copper….who doesn’t need copper?
Hickory,
Aluminum does pretty well: you can make electric motors, generators, etc with aluminum. It’s not the first choice because it’s not quite as convenient, as it’s volumetric power density is a bit lower and it’s not as flexible (aka ductile), but it’s cheaper, lighter, equally recyclable and has no practical resource limits.
Aluminium was a precious metal until fairly recently, so it’s not as familiar. Now the cost of change is a barrier: learning new systems, developing new products with slightly different characteristics, etc. But, aluminium is there, if needed.
This might be the one to watch on mobile energy storage-
Factorial Energy- USA
https://electrek.co/2025/12/23/solid-state-ev-battery-maker-going-public-after-745-mile-test/
America’s Biggest Oil Field Is Turning Into a Pressure Cooker
Drillers’ injection of wastewater is creating mayhem across the Permian Basin, raising concern about the future of fossil-fuel production there
https://www.wsj.com/business/energy-oil/americas-biggest-oil-field-is-turning-into-a-pressure-cooker-8a1bfe4e?reflink=desktopwebshare_permalink
non-paywalled version … https://archive.ph/jjtMz
https://www.youtube.com/watch?v=FwU4cGWDAAA
5 minutes
The end of Venezuela is here.
80% of food in Venezuela is bought from oil export revenue; Trump and Hegseth just cut that off
Oil has been a curse for Venezuela.
“ the poster boy for a phenomenon known as Dutch Disease, the Paradox of Plenty, or, most widely among academic circles, the Resource Curse. By any name, the phenomenon is simple and demonstrable. The discovery of oil, you’d think, would be a Beverly Hillbillies–style windfall for any country. Next thing you know, Old Jed’s a millionaire—swimming pools, movie stars, the whole thing. But what actually happens is that many if not most countries that discover oil end up poorer and in worse shape specifically because they’ve found themselves in possession of that remarkably remunerative tradable commodity. Here’s how it reads in academia: “Proponents of oil-led development believe that countries lucky enough to have ‘black gold’ can base their development on this resource….To the contrary…countries dependent on oil as their major resource for development are characterized by exceptionally poor governance and high corruption…often devastating economic, health and environmental consequences at the local level, and high incidences of conflict and war. In sum, countries that depend on oil for their livelihood eventually become among the most economically troubled, the most authoritarian, and the most conflict-ridden in the world.”
“The basic problem is that oil doesn’t happily coexist with other industries upon which you might build a reasonably stable national economy. That’s true in the third world, the first world, and even in the world in between, e.g. Russia. It creates such large, up-front, sweat-free gains for connected elites that no one wants to do anything else but chase the oil jackpot. And as oil crowds out other industries, the profits don’t ever seem to end up redounding to the nation at large….
…the founder of OPEC, a man named Juan Pablo Pérez Alfonzo, and I asked him some questions about the founding of OPEC…. “And he said to me, ‘Teresita, you know, you’re such a bright young person. Why are you studying OPEC? Why don’t you see what oil is doing to us, the oil exporters?’ “And I said, ‘What do you mean?’ “And he said, ‘Oil is the excrement of the devil.’ ”
“The words of a former minister of oil for Saudi Arabia, a country that had, on paper, financially benefited from its vast oil reserves more than any other on the globe: “All in all,” said Sheikh Ahmed Zaki Yamani, whose position made him one of the most powerful men on earth, “I wish we’d discovered water.”
A new post is up, enjoy.
https://peakoilbarrel.com/permian-basin-shale-gas-and-tight-oil-and-shale-gas-from-us-tight-oil-plays/
GOM again nearing 2 MM bopd.
https://rbnenergy.com/daily-posts/blog/gulf-mexico-oil-production-nears-new-high-will-growth-continue
Unfortunately article will soon go behind a pay wall. Been Xmasing.
Mostly a bizarrd of project names as all these articles are.
FWIW, I remember the main GOM expert here scoffing at c. 2017 predictions that GOM would go to 2.0. He predicted decline to 1.5 instead. In fact 2.0 did happen in 2019. And he took 3 years of avoiding commentary. Never facing up to his failed peaker call. It wasn’t just a bad call…but that he scoffed at EIA and said they had no clue…but they were right and he was wrong.
Just goes to show the failure of the bottom up method, like the megaproject effort by Stuart Staniford, rest in peace.
this is due to the ultra-deep Miocene/Paleogene reservoirs have saline lacustrine sourced oil, these heavy low GOR oil could produce with foamy oil at astonishing rate and EUR recovery.
In fact, this is reflected in BOEM GOM/A oil forecast has a steeper decline than actual.
I just looked into the similar saline lacustrine Eocene reservoirs in Bohai bay, China, it shocks me that
1. they have a GOR of 1:15, and over 70% oil are heavy oil.
2. Heavy oil could still have quite low asphaltene level of under 5%, instead major Persian marine sourced oil have much higher asphaltene levels over 10%.
There is the PL19-3 giant field in Bohai discovered by joint venture operated by COP, and it is the most profitable block in COP’ global operations. There is also a large heavy oil field discovered by JP operated by Chevron, and deemed too heavy to produce and abandoned by Chevron, but later turned out to be quite profitable. This is probably a result of overestimating the viscosity associated with heavy oil based on Gulf/North America countries which usually have much higher asphaltene.
3. The shale oil could also fall into heavy oil region and still be super productive like what happened in Vaca muerta. As the picture shows here —
https://www.linkedin.com/pulse/new-record-low-gorapi-shale-oil-sheng-wu-gx2hc
at the wellhead, the oil on top of the oil tank could be peeled off layer by layer, and rolled up like polystyrene sheets rolled up into a roll. I have a dramatic picture attached. Yet, when you heat it to 60C, it flows as fast as water, i.e. low asphaltene level.
Rig Report for the Week Ending December 23
The rig count drop that started in early April 2025 when 450 rigs were operating rose this week. Drilling continues at unabated rates with WTI below $60/b.
– US Hz oil rigs rose by 1 to 363, down 87 since April 2025 when it was 450. It was also up by 1 from the low of 362 first reached in the week ending August 1. The rig count is down 19% since April.
– New Mexico Permian dropped by 2 to 92. Lea dropped 1 to 60 while Eddy dropped 1 to 32.
– Texas rose by 2 to 169. Texas Permian rose by 1 to 132. Midland was unchanged at 24 and Martin was unchanged at 26.
– Eagle Ford added 1 rig to 28.
– NG Hz rigs were unchanged at 111.
A Rig
Frac Spread Report for the Week Ending December 23
The frac spread count dropped by 6 to 154, a new low. From one year ago, it is down by 47 spreads and down by 61 since March 28. December is the beginning of the yearly spread count drop associated with Xmas.
This is the last Rig and Frac report for 2025.
All of the best for 2026 to all of our participants and viewers.
A Frac