Comments not directly related to oil and natural gas production should be in this thread. Thank you.
Category: Uncategorized
US GoM 2019 Summary: Part I – Exploration, Drilling and Discoveries
A Guest Post by George Kaplan
Introduction
In many ways the US side of the Gulf of Mexico shows signs of a production basin at the end of life. Most of the sort historic of charts that would normally plotted – discoveries, drilling, active wells, active leases, leasing activity, natural gas production – show classic bell shapes, with current conditions on the tail; and yet oil production is still just about increasing, and the fall in remaining reserves has been reversed in recent years. Examples for some parameters are shown in the chart, and others in subsequent sections. (Note the units used for production, it was the only way to get everything on the same axis.)

Open Thread Non-Petroleum.
Comments not related to oil or natural gas production in this thread, please. Thank you.
Open Thread Non-Petroleum.
Comments not related to oil or natural gas production in this thread, please. Thank you.
OPEC January Production Data
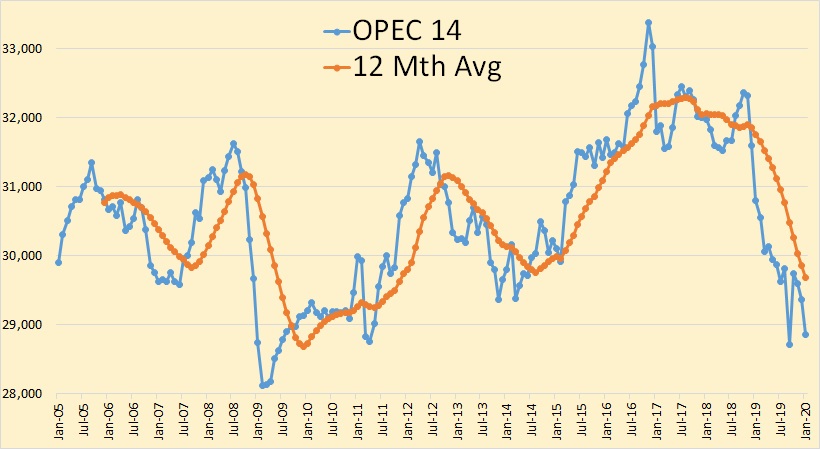
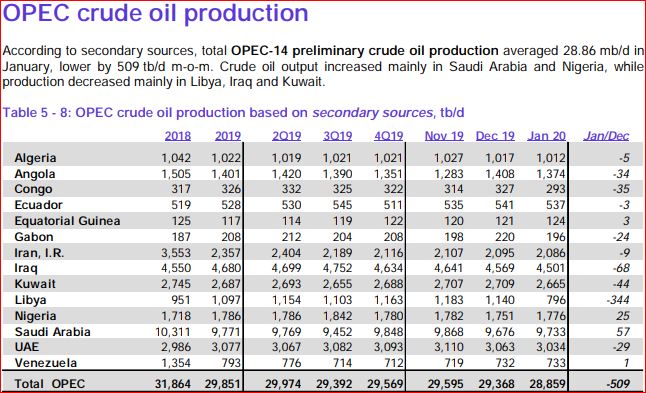
All OPEC data below is from the February edition of the OPEC Monthly Oil Market Report. The data thousand barrels per day and is through January 2020. OPEC Monthly Oil Marker Report
OPEC 14 crude oil production was down 509,000 barrels per day in January. And that was after December production was revised down 86,000 barrels per day.
OPEC announced a couple of months ago that Ecuador was leaving the cartel. However they were still included in January’s data. I have no idea what’s going on.
Read More
