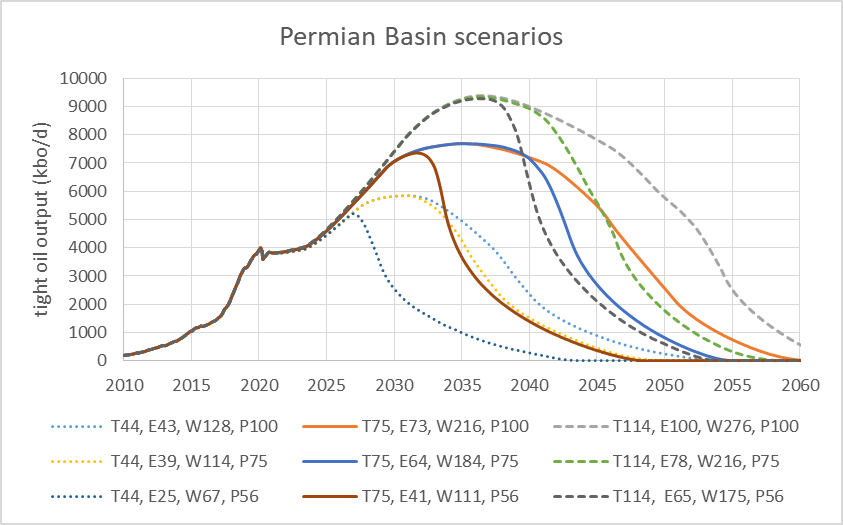
The future of tight oil output in the US will depend in large part on future development of Permian Basin resources in Texas and New Mexico. I have developed nine scenarios for future Permian basin tight oil output based on 3 levels of technically recoverable resources (TRR) and 3 different future oil price scenarios. These are summarized in the chart below.
Read MoreCategory: Oil Production
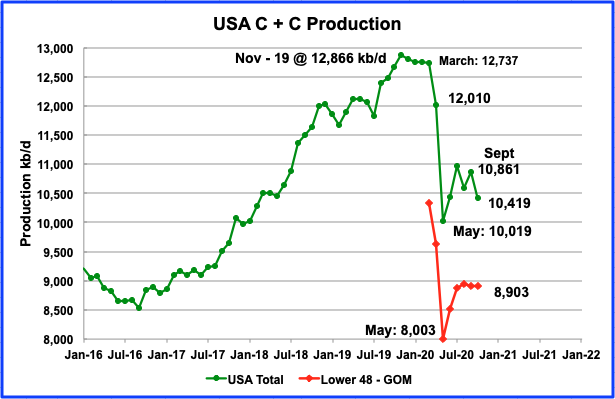
US October Oil Production Declines
A post by Ovi at peakoilbarrel
To all of our participants, I wish you a Happy, Healthy and Prosperous New Year.
All of the oil (C + C) production data for the US state charts comes from the EIAʼs Petroleum Supply monthly PSM. After the production charts, an analysis of three EIA monthly reports that project future US production is provided. The charts below are updated to October 2020 for the 10 largest US oil producing states.
Read MoreUK North Sea Summary Part I: Licensing, Drilling, Discoveries and Development
A Guest Post by George Kaplan
Discoveries and Development
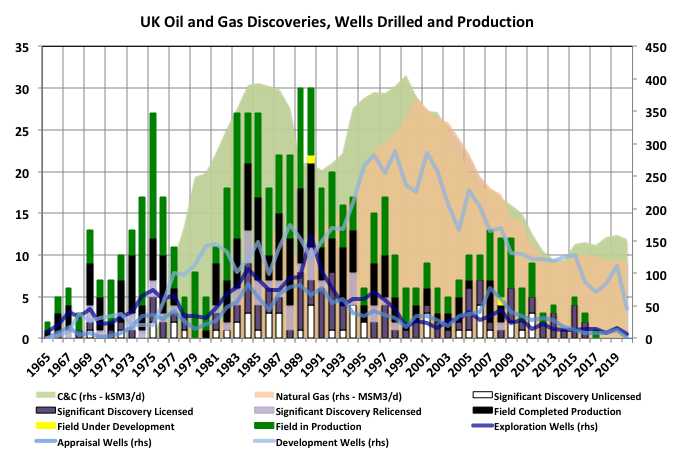
The global peak in oil and gas production for UK occurred in 1999 and 2000, probably delayed by four or five years by the Piper Alpha tragedy, and will not be approached, far less exceeded, again. There have been two other local peaks, each one preceded by about ten to twelve years by a local peak in the number of discoveries. The UK Oil and Gas Authority does not publish individual field resources, but it’s a fair bet that the large fields were discovered early on and most of the recent discoveries are small, near field tie-ins.
Read MoreAugust Non-OPEC Production Rises
A post by Ovi at peakoilbarrel.
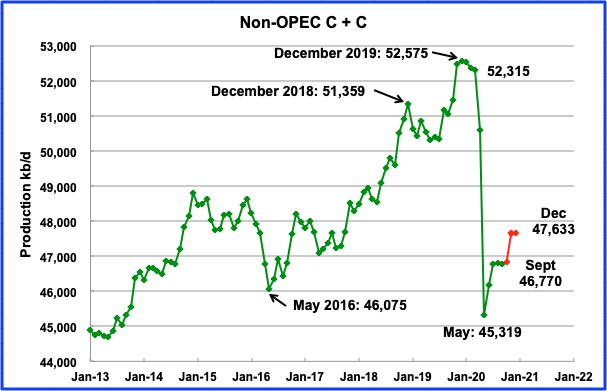
Below are a number of oil (C + C ) production charts for Non-OPEC countries created from data provided by the EIAʼs International Energy Statistics and updated to August 2020. Information from other sources such as OPEC, the STEO and country specific sites such as Russia and Norway is used to provide a short term outlook for future output and direction for a few countries. Typically I collect updated country info after the 20th of the month for September and October. Since this is an early post, those have not changed from last month.
Read MoreUS September Oil production
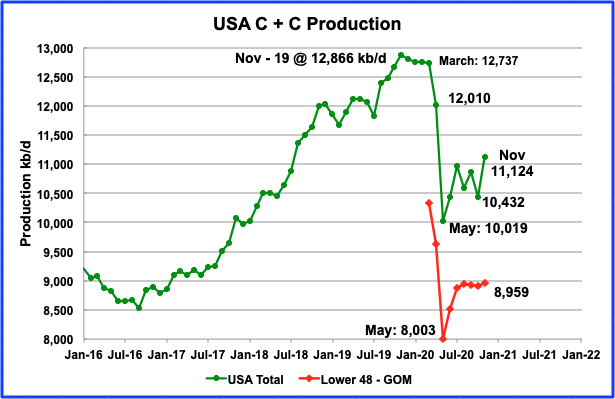
A post by Ovi at peakoilbarrel
All of the oil (C + C) production data for the US state charts comes from the EIAʼs Petroleum Supply monthly PSM. After the production charts, an analysis of three EIA monthly reports that project future production is provided. The charts below are updated to September 2020 for the 10 largest US oil producing states.
Read More