Comments not related to oil and natural gas in this thread please. Thanks.
Read MoreAuthor: Ovi
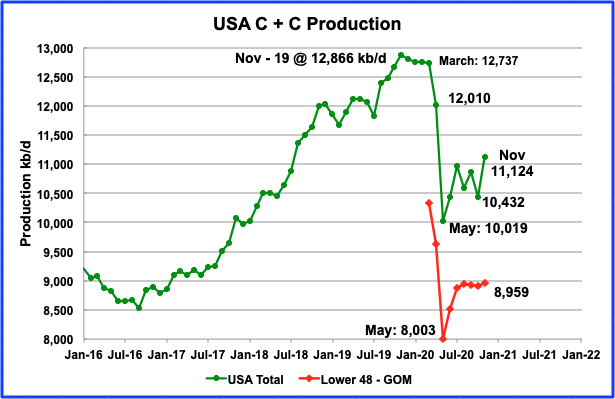
US November Production Rebounds After Hurricane
A post by Ovi at Peakoilbarrel
All of the oil (C + C) production data for the US state charts comes from the EIAʼs Petroleum Supply monthly PSM. After the production charts, an analysis of three EIA monthly reports that project future US production is provided. The charts below are updated to November 2020 for the 10 largest US oil producing states.
Open Thread Non-Petroleum, January 30, 2020
Comments not related to oil and natural gas in this thread please. Thanks.
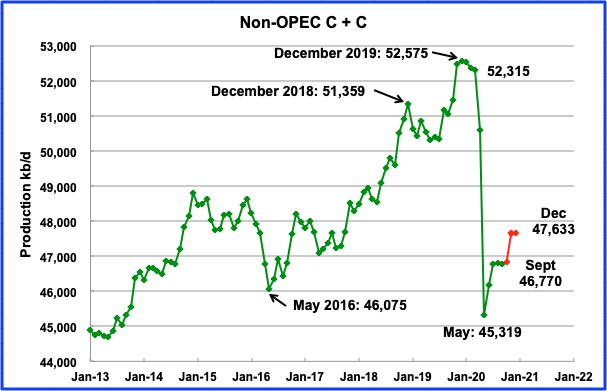
Read MoreNon-OPEC September Oil Production Flat
A post by Ovi at peakoilbarrel
Below are a number of oil (C + C ) production charts for Non-OPEC countries created from data provided by the EIAʼs International Energy Statistics and updated to September 2020. Information from other sources such as OPEC, the STEO and country specific sites such as Russia and Norway is used to provide a short term outlook for future output and direction for a few countries.
Open Thread Non-Petroleum, January 22, 2020
Comments not related to oil and natural gas in this thread please. Thanks.
Read More