Comments not related to oil or natural gas production in this thread please. Thanks.
Read MoreAuthor: Ovi
Small Drop in US February Oil Production
A guest post by Ovi
All of the Crude plus Condensate (C + C) production data for the US state charts comes from the EIAʼs Petroleum Supply monthly PSM which provides updated information up to February 2023.
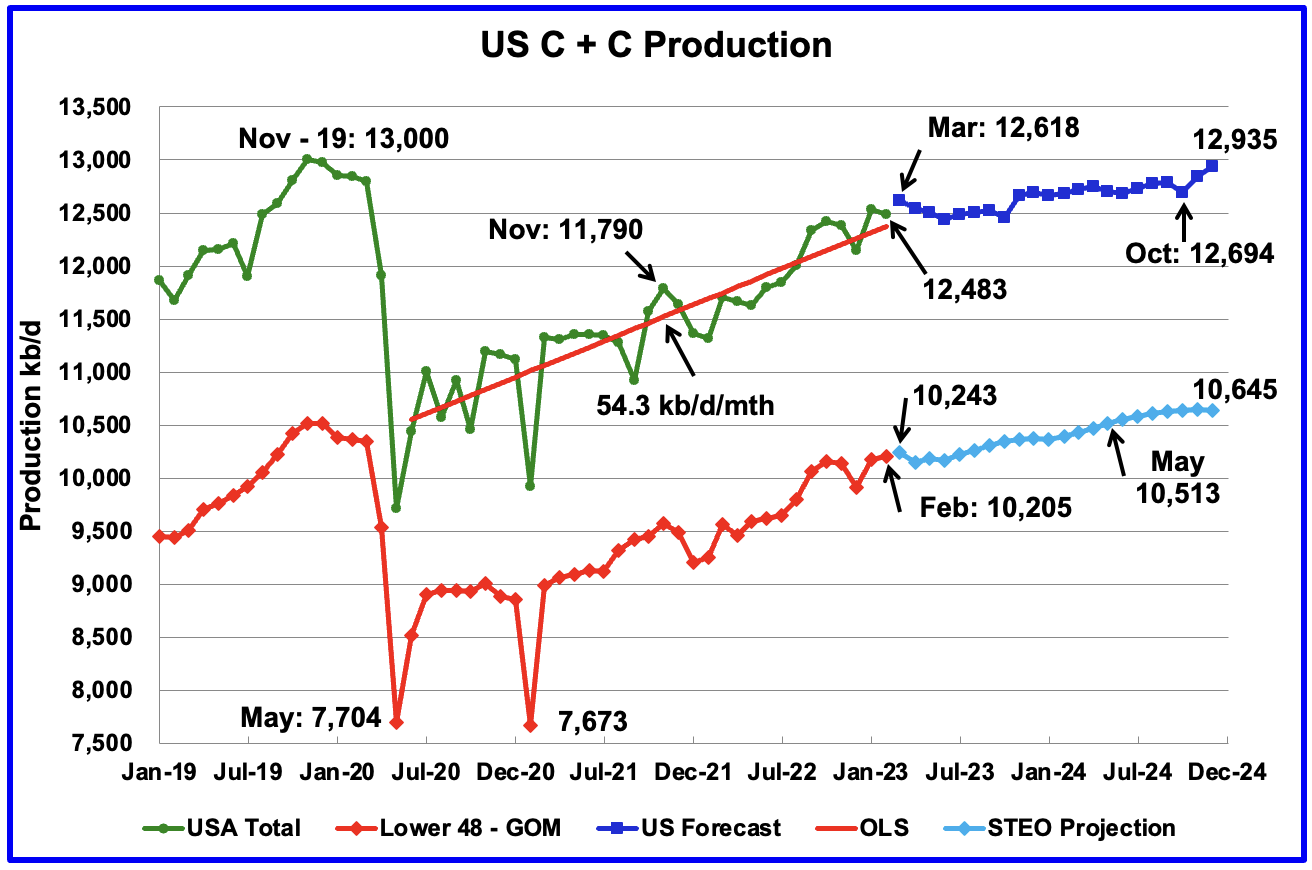
U.S. February oil production decreased by 53 kb/d to 12,483 kb/d. Of the 53 kb/d drop, part of it is due to the upward revision of January production from 12,462 kb/d to 12,536 kb/d, an increase of 74 kb/d.
Most of the states had a small drop except North Dakota which increased production by 77 kb/d.
Read MoreOpen Thread Non-Petroleum May 4, 2023
Comments not related to oil or natural gas production in this thread please. Thanks.
Non-OPEC’s December Oil Production Drops
A guest post by Ovi
Below are a number of Crude plus Condensate (C + C) production charts, usually shortened to “oil”, for Non-OPEC countries. The charts are created from data provided by the EIA’s International Energy Statistics and are updated to December 2022. This is the latest and most detailed world oil production information available. Information from other sources such as OPEC, the STEO and country specific sites such as Russia, Brazil, Norway and China is used to provide a short term outlook for future output and direction for a few of these countries and the world. The US report has an expanded view beyond production by adding rig and frac spread charts.
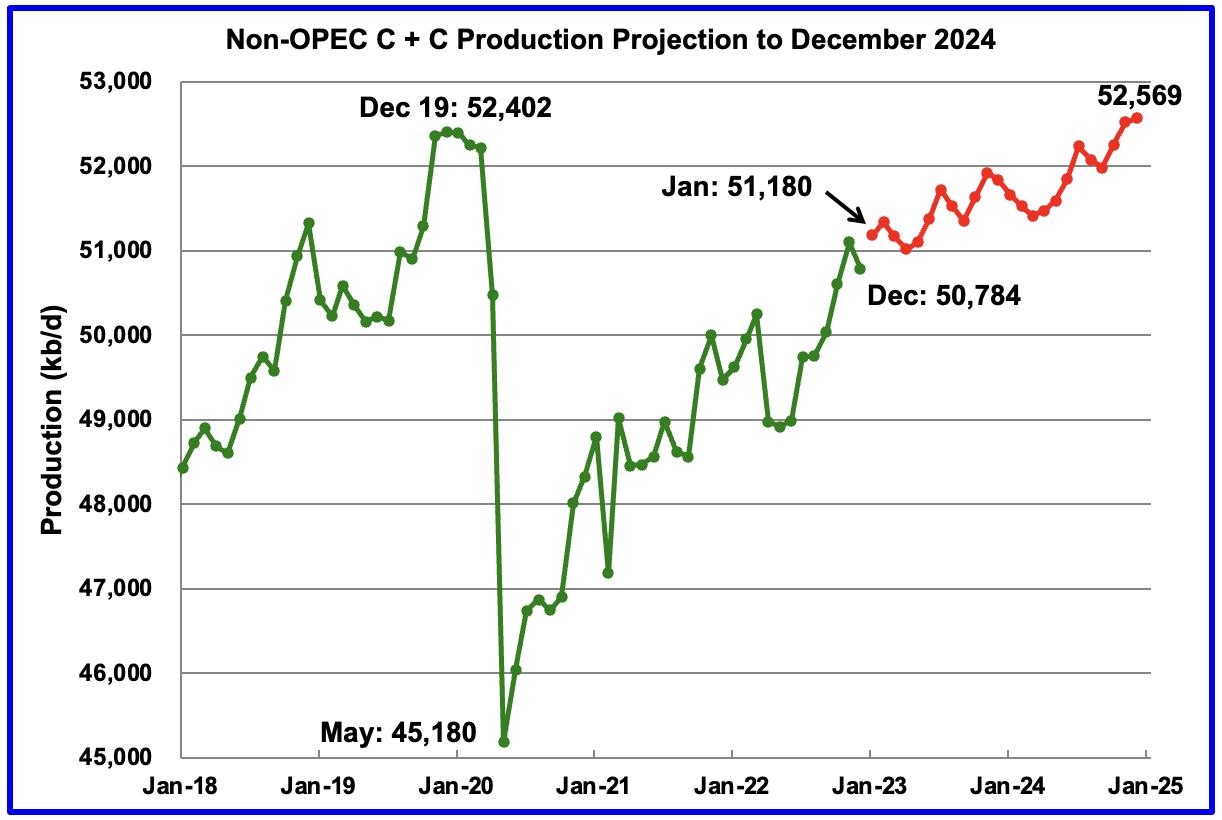
December Non-OPEC oil production decreased by 317 kb/d to 50,784 kb/d. The largest decrease came from the US, 276 kb/d.
Read MoreOpen Thread Non-Petroleum April 11, 2023
Comments not related to oil or natural gas production in this thread please. Thanks.
Read More