US GoM 2019 Summary: Part III – Production

A Guest Post by George Kaplan

Overall Annual Production

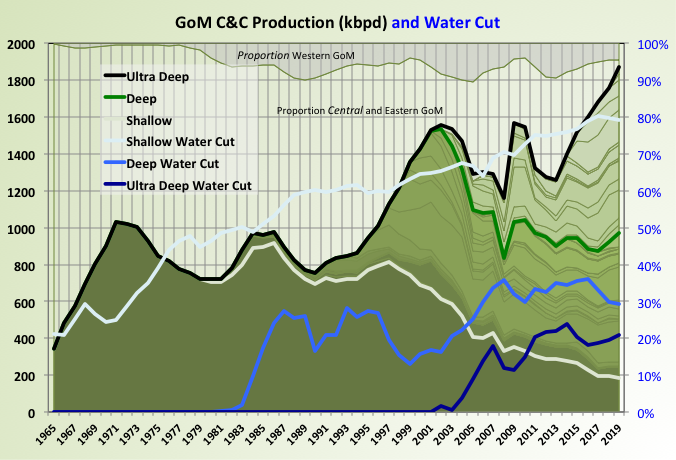
US Gulf of Mexico C&C production has had a series of peaks; firstly two from shallow oil, the middle acceleration probably caused by the mid seventies oil shock; followed by deep oil development and finally by ultra deep oil, with a dip in the middle from the Deep Horizon drilling hiatus. Most production has come from eastern and central (i.e. mainly Louisiana) with some, and falling, from the western section (Texas).

Read More

Norway Summary

A Guest Post by George Kaplan

Exploration, Discoveries and Development

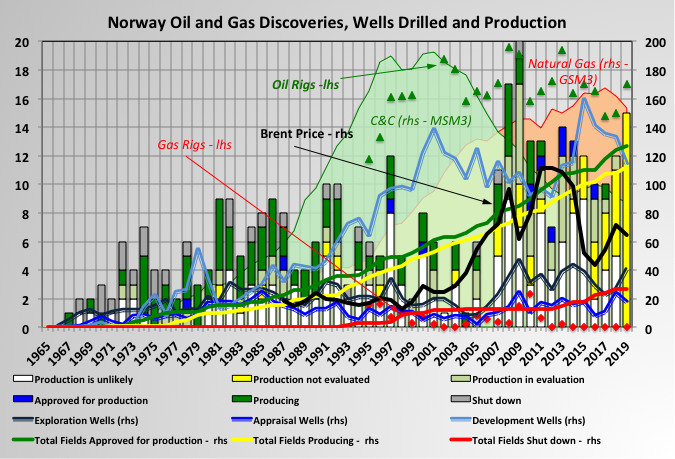
Drilling and development activity off shore Norway has been fairly steady through the life of the basin. This has been partly from government policy, through tax relief or direct action, but also through opening up of new areas as technology becomes available. It has moved from mainly producing oil to now being dominated by gas, although there is little direct gas exploration now (note that converting gas to o.e. is simple in S.I. units and is just a factor of 1000).

Drilling activity has been high in the 2000’s for development wells (including a lot of in fill drilling and some major redevelopments) and exploration (I think there is very favourable tax arrangements that encourage drilling in even fairly low prospective areas). Appraisal drilling has been more flat and there has been some reports that some discoveries have proved disappointing after start up, possibly because of insufficient drilling before development was approved.

There are twelve projects “approved for production” (i.e. in development) with average reserves of 26.5 MSm3 and average discovery year 2001; nineteen projects “production in clarification phase” (i.e. in FEED or pre-FEED) with average resources of 25 MSm3 and average discovery year also 2001; twenty nine projects “production likely but unclarified” (i.e. in conceptual design) with average resources of 10 MSm3 and average discovery year also 2003; and twenty eight projects “production not evaluated” with resources of 8.5 MSm3 and average discovery year also 2010.

The number of “hydrocarbon shows” has been large recently but they have mostly been small with “production unlikely” or “not yet evaluated” (and present prices mean most of these are likely to be deferred at best).

The number of development projects per year has, if anything, been increasing slightly, although the size has been generally decreasing. The number of shut down fields is increasing slowly but the have been a number that have had their life times extended beyond their original shut-down date (through improved reservoir performance and/or major redevelopments).

The oil price may have influenced activity but I can’t really see it much, maybe the effect of the current crash will be more obvious.

Read More

US GoM 2019 Summary: Part II – Reserves

A Guest Post by George Kaplan

Introduction

BOEM produces an estimate of GoM reserves every year. This year’s covers estimates for then end of 2017. Nominally The figures given are 2P estimates but previous analysis has shown them to be extremely conservative, and they strictly follows SEC rules concerning reserves being bookable only if clear development plans are in place.

Backdated Reserves

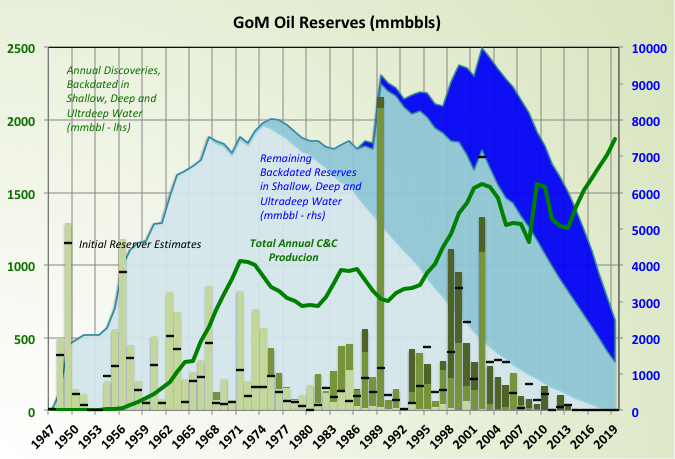
These charts show reserve additions from discoveries by depth (all backdated to the original discovery year so that all adjustments due to improved extraction methods and better understanding of the reservoir etc. are included in the shoen reserve estimate), production and remaining reserves also by water depth.

The black dashes against each discovery show the original estimates of reserves. The shallow water estimates were very low and had significant upgrades, deep water not so much, and ultra-deep hardly at all. The reason for this is mainly the date of the discoveries: nominally it should be easier to apply seismic and drilling analysis from shallow water but the ultra-deep finds were made later and therefore have had better technology and seismic available when the original estimates were made; more on this later.

That said I do not know what method BOEM uses to make the estimates, it cannot be the ultra high fidelity models that the E&P companies use as they do not have the computer power, human resources or time to cover every field in the GoM.

Read More

US GoM 2019 Summary: Part I – Exploration, Drilling and Discoveries

A Guest Post by George Kaplan

Introduction

In many ways the US side of the Gulf of Mexico shows signs of a production basin at the end of life. Most of the sort historic of charts that would normally plotted – discoveries, drilling, active wells, active leases, leasing activity, natural gas production – show classic bell shapes, with current conditions on the tail; and yet oil production is still just about increasing, and the fall in remaining reserves has been reversed in recent years.  Examples for some parameters are shown in the chart, and others in subsequent sections. (Note the units used for production, it was the only way to get everything on the same axis.)

Read More

Brazil Reserves and Production Update, 1H2018

A Guest Post by George Kaplan

Brazil C&C Production

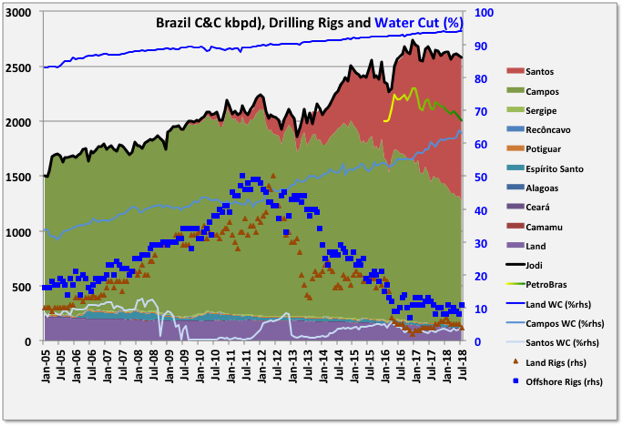
Brazil and Petrobras show something in common with US LTO: even with a lot of debt and desire, and a strong resource base it is difficult to raise production in the face of high decline rates. It may also be a lesson for the world as oil prices rise and activity picks up; it is by far the most active conventional oil region with many major projects at various stages of completion, but facing delays and schedule crowding so oil production has continued a slow decline, contrary to expectations from last year. In July new production again did not quite match overall decline, mostly because of delays in start-ups of FPSOs planned for this year, and at 2575 kbpd was down 14 kbpd or 0.5% m-o-m and 48 kbpd or 1.8% y-o-y (data from ANP).
chart/

Two FPSOs were started in 2017: Lula Sul (P-66) at 150 kbpd nameplate and Pioneiro de Libra, an extended well test project on the Mero field, at 50 kbpd. Both are now about at design throughput. Two other FPSOs completed ramp up in 2017. In 2018 three FPSOs have started up: Atlanta a small early production system at 20 kbpd, Bezios-1 (P-74) in the Santos basin at 150 kbpd and FPSO Cidade de Campos dos Goytacazes on the Tartaruga Verde field in Campos, also at 150 kbpd. There were three other FPSOs due for the Buzios field (P-75, 76 and 77) but at least one is delayed till next year. There are now four planned FPSOs remaining to be started up this year, all in the fourth quarter: P-75 and P-76 plus P-67 (Lula Norte) and P-69 (Lula Extremo Sul) in the Lula field (each 150 kbpd nameplate). Even for a company the size of Petrobras that seems a very tight schedule for commissioning large, complex plant, so one or two may slip to next year and all may be so late as to make little difference to this year’s numbers. See Reuters for more details.

Into next year there may be problems with shortage of deep water drilling rigs, Petrobras cancelled some following the price crash and there have been reports of them looking for available rigs now: no rig, no well, no oil no matter what the available surface processing capacity. Offshore rig numbers, by Baker Hughes, have averaged around ten over the last couple of years, unless they add numbers then the overall ramp-up will remain as it has been and production will stay about flat.

FPSOs P-68 (Berbigao & Sururu) and P-70 (Atapu) are due next year, together with any delayed from this, but the ramp-up from this year’s FPSOs is likely to dominate production growth. There are none due for 2020. Note Petrobras projects have a hull name (P-), a vessel name (often named after a city), a field name (sometimes two or three) plus, often, a separate name (e.g. MV-) from the leasing company, and they often change these during development by reassigning hulls to different destinations, so my apologies if I’ve got some of the above wrong.

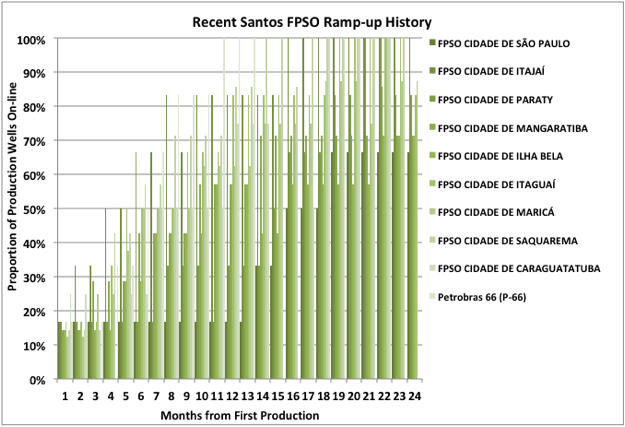
There’s been a lot of activity since 2016 despite the price crash and Petrobras debt and corruption problems, and yet production has slightly declined. Typically the large FPSOs at around 150 kbpd take 14 to 22 months to ramp up (see below), adding 8 or so production wells and 4 to 6 injection wells, but two are needed per year to overcome decline rates, and that may be increasing with higher overall production and some of the newer Santos vessels reaching end of plateau. It’s also noteworthy that the mature Campos fields have been showing accelerated decline and a marked jump in water cut recently, although the overall basin decline will be ameliorated by the start-up of the latest FPSO.

Petrobras production is falling faster than overall production, partly from sales of older fields but also because it has a lower ownership ratio of the new (growing) fields than of the mature (declining) ones.
chart/

The chart above shows how recent production wells have been added. I haven’t found any data for injection wells.
Read More