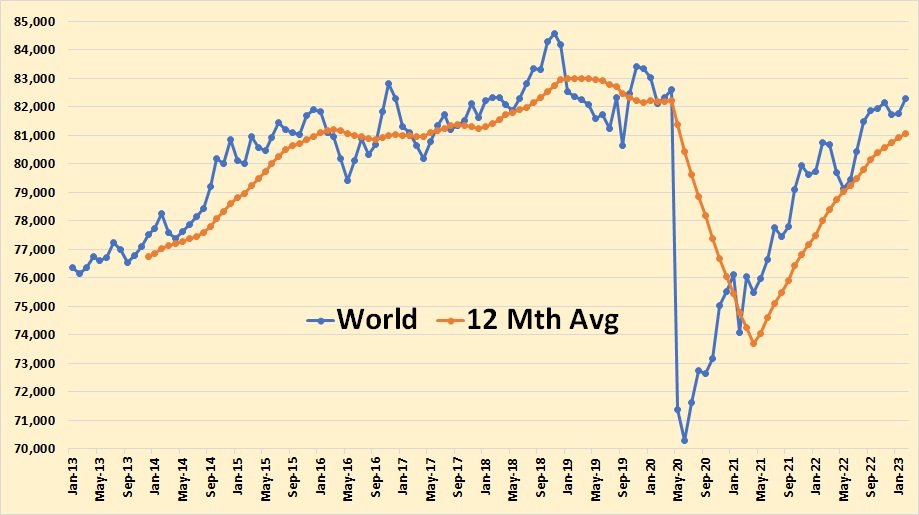
World C+C production increased by 524,000 barrels per day in February to a post-pandemic high.
Read More
World C+C production increased by 524,000 barrels per day in February to a post-pandemic high.
Read MoreComments not related to oil or natural gas production in this thread please. Thanks.
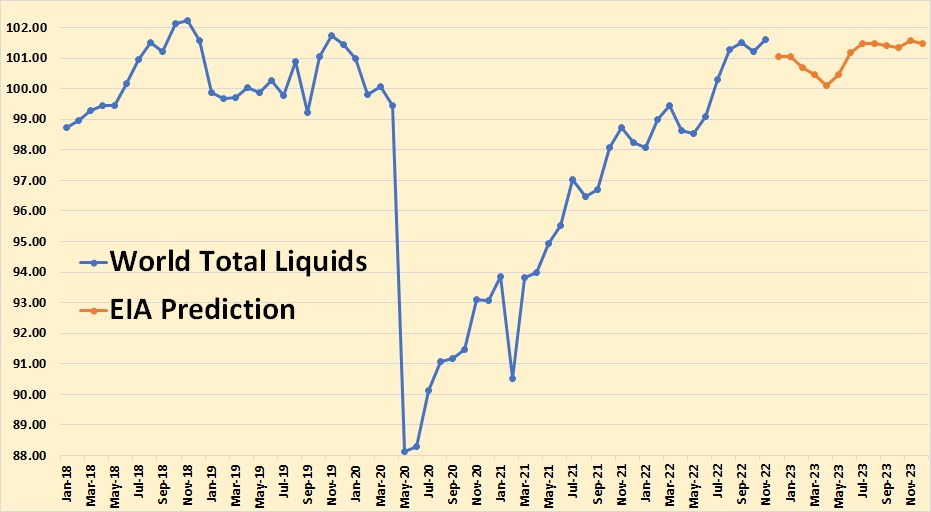
Read more: Open Thread Non-Petroleum June 10 2023The EIA’s Short-Term Energy Outlook gives the USA data as C+C as well as all liquids, OPEC as crude only, but the rest of the world is Total Liquids only. All STEO charts below are million barrels per day. Other charts, not part of the STEO, are in thousand barrels per day. Also note that the EIA post known data in bold and future predictions in a lighter font. They post known data through November 2022.

Obviously all production is not known through November, but I have not tried to guess what they do know but posted the data as they posted it, known through November. But understand the November data, as well as October data, will almost certainly be revised later.

The EIA sees World Total Liquids declining early in 2023 with no gain for the total year.
Comments not related to oil or natural gas production in this thread please.
Thanks
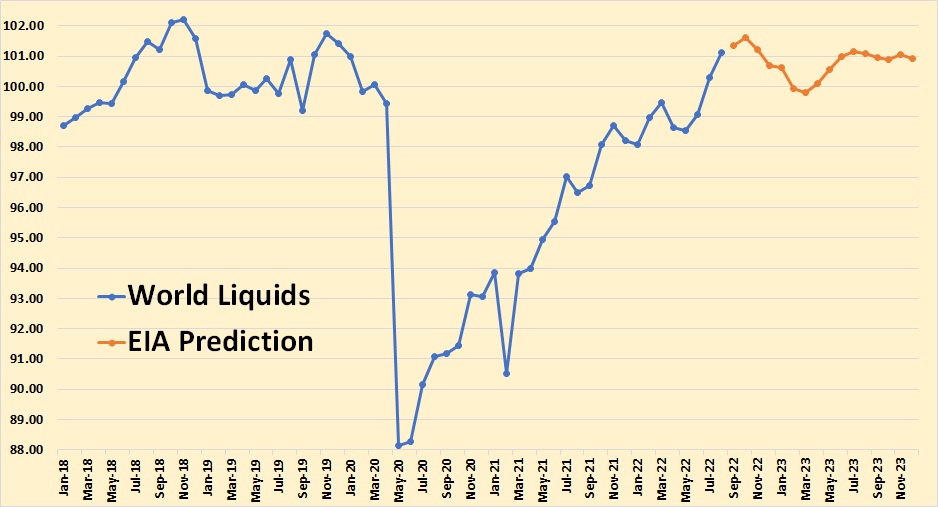
The EIA’s Short-Term Energy Outlook gives the USA data as C+C as well as total liquids, OPEC as crude only, but the rest of the world is Total Liquids only. All data in the charts below are million barrels per day.

The known data is through August 2022, the rest, in red, in million bp/d, is the EIA’s estimate. However, this is Total Liquids, not C+C. And Total Liquids is not a good indicator of oil production as the below table shows.
Read More