A guest post by George Kaplan
EIA Liquids Reserve Estimates
This follows on from Part I, which looked at EIA reserves and revision estimates for US as a whole and the GoM, and concentrates on the on-shore tight oil and (below)gas producing regions.
The EIA issues revision data by whole states or state districts rather than by basin, so some of the reserves and production, but a small proportion, will be from conventional reservoirs. It does give total reserves for each shale basin but not the changes, and I didn’t go to the trouble of pro-rating everything against that. Its data only goes through 2019; the 2020 update will be out in December or January.
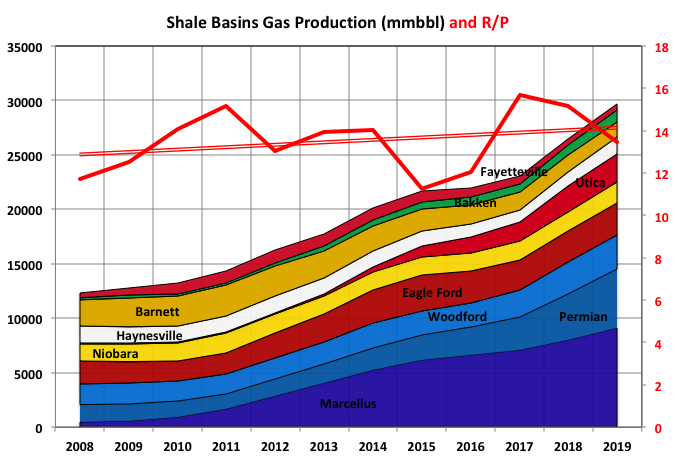
The regions for each basins used are Permian – Texas Districts 7C, 8 and 8A and East New Mexico; Bakken – North Dakota and Montana; Eagle Ford – Texas Districts 1, 2, 3 and 4 Onshore; Niobara – Colorado; Marcelus – Pennsylvania and West Virginia; Utica – Ohio; Haynesville – Louisiana South Onshore and Texas District 6; Barnett – Texas Districts 5, 7B and 9; Woodford – Oklahoma ; Fayetteville – Arkansas.
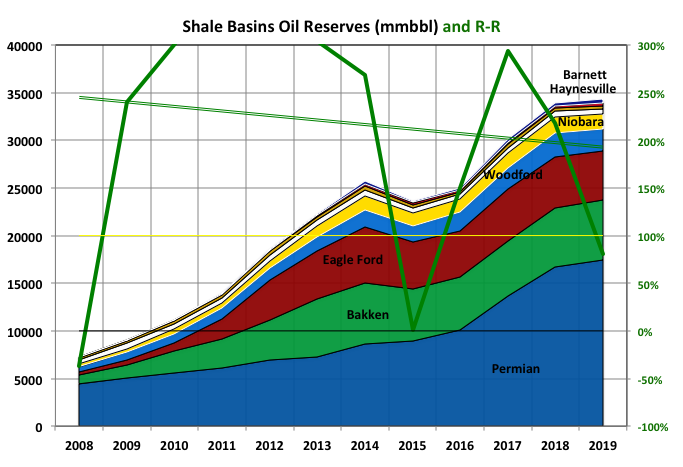
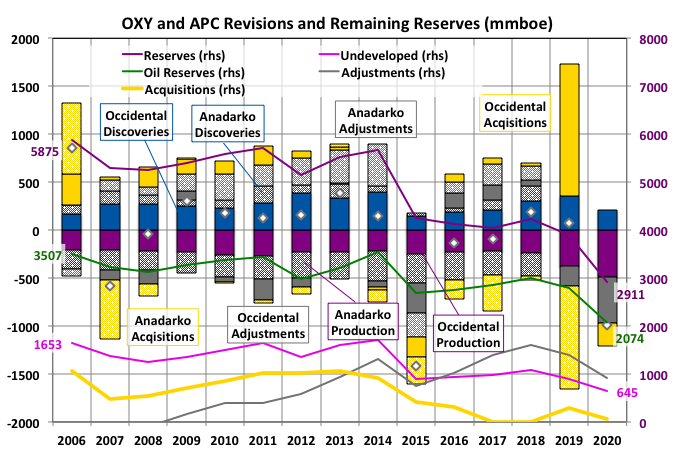
Remaining reserves are for crude, condensate and NGL, which is easier to include here given the way EIA presents its data. Totalled for all the basins these may have peaked in 2019, they were levelling off from 2018 and will certainly fall significantly in 2020.
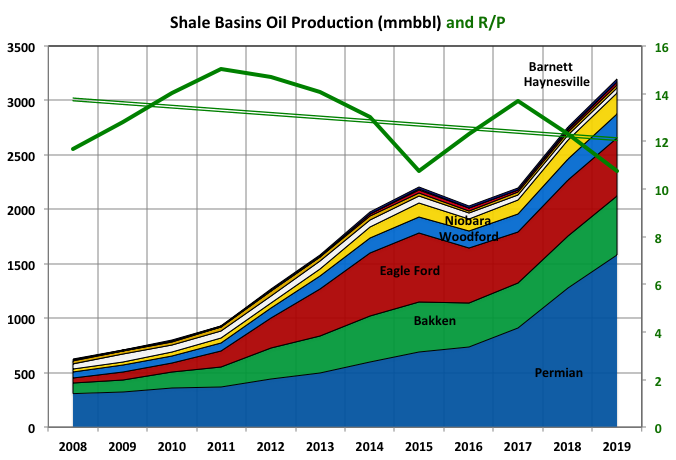
Production was aggressively increasing in 2019, coming mainly from the Permian, but will fall in 2020, and given shale dynamics, a concurrent peak with reserves is not unlikely.
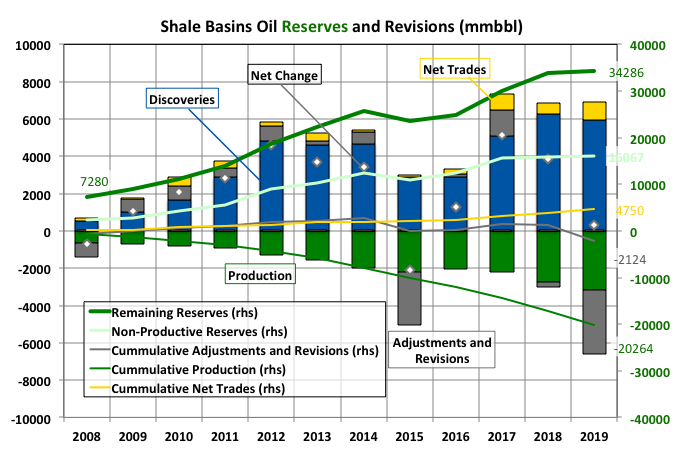
Cumulative adjustments and revisions turned negative in 2019 and I expect will show a major decline for 2020, which may well not be fully recovered even if prices rise significantly. To me this indicates that estimates for recovery factors were over-estimated originally and are gradually being corrected. There are very few successful wild cats now so the discoveries are all extensions of fields or accounting features in which they are booked as FIDs are made (EIA does not backdate to the original field discovery date). Thus the healthy reserve replacement ratio (R-R), of above 200%, is probably an artefact of past discoveries from the early days of a particular basin and will look far worse against backdated reserve numbers.
I don’t understand how there can be overall gains through net purchases versus sales but it is probably something to do with how EIA collects the data and reflecting overall sales from small and private companies to the larger players.
The non-producing reserves, mostly undeveloped areas, have been constant since 2017 so their ratio of the total has been falling, which implies that companies are now having to draw from net inventory of new locations rather than finding attractive new sites.
EIA Natural Gas Reserve Revisions
The natural gas shale dynamics seems to precede liquid basins by one or two years, so there’s more likelihood that we are past a global peak there.
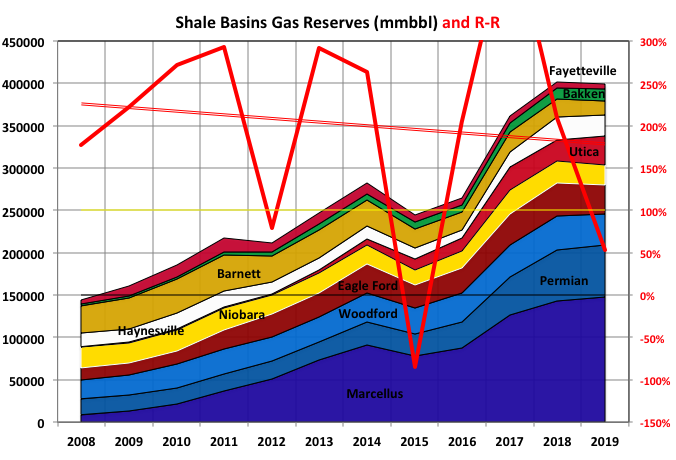
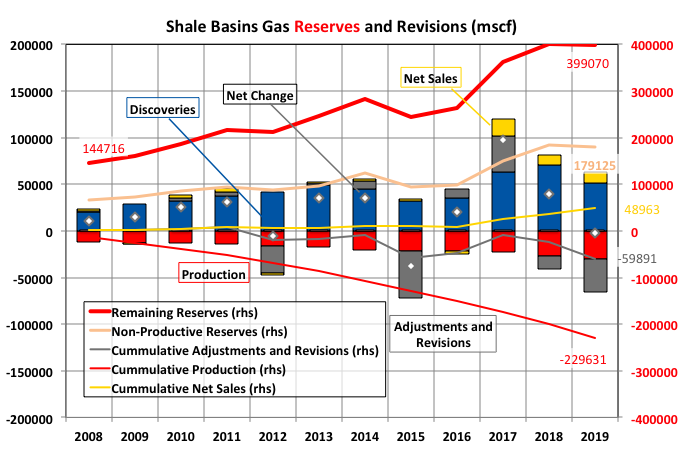
The negative cumulative revisions and adjustments started earlier and are so far more pronounced for natural gas than for liquids. Undeveloped reserves seem to have started declining rather than just plateauing.
EIA Combined Reserves
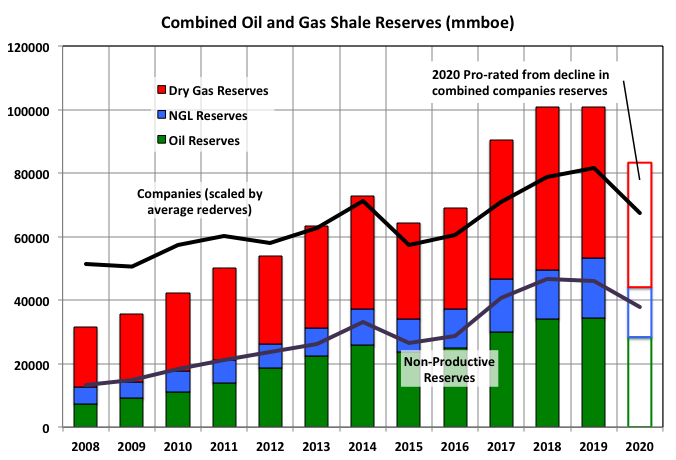
A significant and growing proportion of the production is NGLs. It will be interesting to see how this proceeds as decline and depletion sets in. In conventional fields gas gets progressively heavier (i.e. containing more NGLs) as pressures fall below bubble point or a gas cap is blown down, similarly from the start for gas-condensate fields. I’d imagine there are similar effects in shale fields, maybe more so given that pressures decline from the start of production, that the pore restrictions allow gas flow in preference to the oil and that it now appears that wells can significantly effect the pressures in neighbouring drainage zones.
The 2020 column is an estimate of the coming EIA data based on pro-rationing the numbers from companies that have the largest proportions of their reserves and production from shale basins as described in the following section.
Shale Company Reserve Revisions
The companies chosen as represented are those with large shale reserves and production, but also a majority of their holdings as shale (all a bit subjective but it does exclude the majors and super-majors and includes most of the familiar shale cheerleaders).
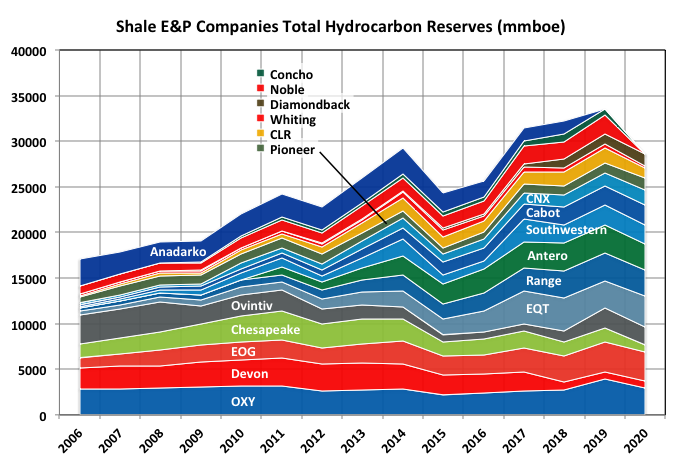
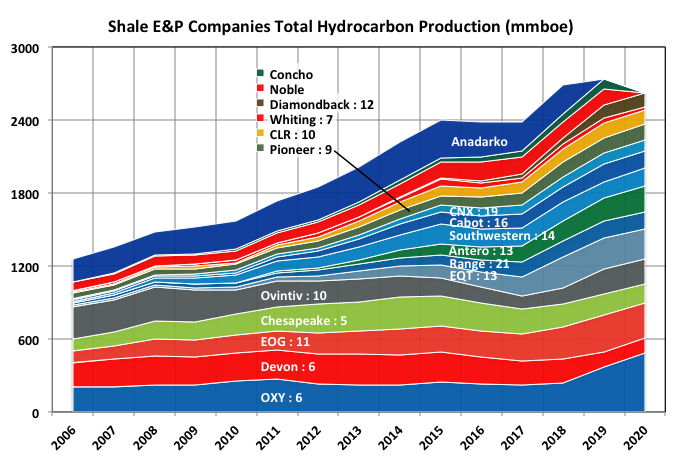
These companies only represent about a quarter to a third of total reserves and production, and they have been closer to plateauing rather than the rapid expansion shown by the overall shale basins, which would suggest that the majors and larger independents have been particularly aggressive.
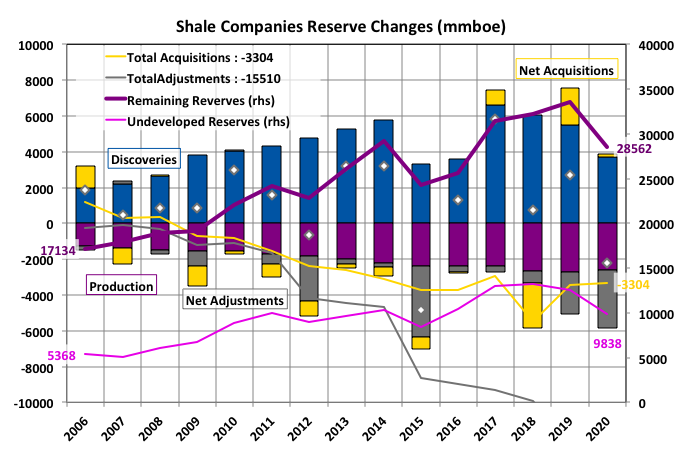
This group of companies has been selling off some assetts overall but the most noticeable change is how the revisions and adjustments has been consistently negative, even in years with large oil price increases. From 2006 these adjustments have been about 25% of discoveries in the same period, suggesting that the original estimates for recovery factors were too optimistic, and there is no reason to think they are not still.
The net revisions and adjustments have been growing negatively since production really took off around 2010/2011, some of the big drop last year will be recovered as prices rise but I doubt all and the companies could well use the opportunity to paper over their previous sins of overestimation. I don’t think it surprising that the corrections are so much more for these companies than for all the shale producers including the large IOCs that tend to have a bit more of spotlight on them.
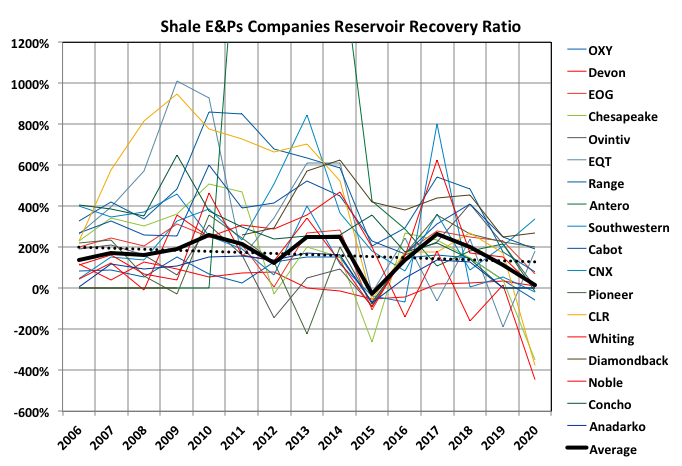
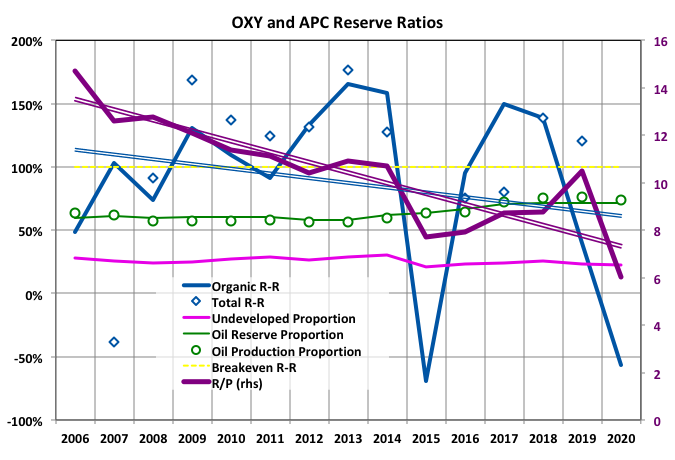
The organic replacement ratio has trended down to about breakeven and the spread among companies has narrowed – something can probably be read into that.
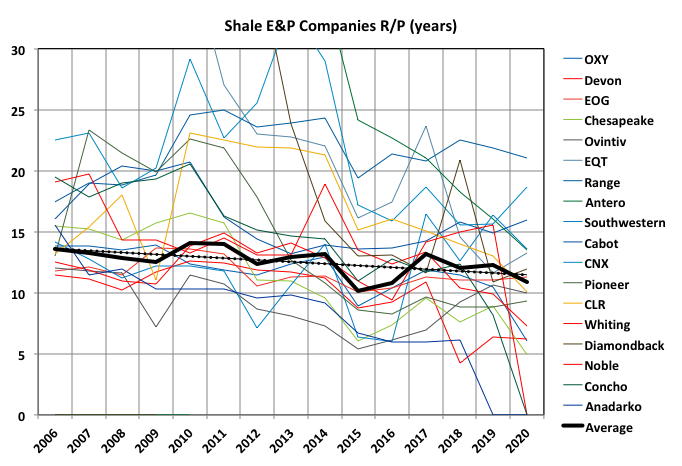
The average R/P ratio has been steadily dropping, all companies have seen similar falls but the spread among for actual values has not seen much compression, which probably reflects the individual company’s philosophy or strategy..
Occidental and Anadarko
These are (or were before then purchase/merger) two of the largest of the shale players. The figures below just seem to reinforce what a disastrous trade this was for Occcidental, I think it is probably on its last legs, and knows it. R/P ratios at six years and continuously declining, a replacement ratio consistently below 100%, steadily declining remaining reserves and net acquisitions moving negative to try and repay debt all point in one direction only.
Off Topic Finish: Waiting for the Great Leap Forward
I have been reading ‘A More Contested World: Global Trends 2040’ by The National Intelligence Council; slowly as there’s a lot in it but also a lot missing. No mention of specific resource limits, no discussion of GM just general ‘technology’ concerns concentrating on AI and of course, god forbid any mention of overpopulation. It is very US-centric – in the good scenarios the world gets to a better place only through US leadership – and humanist focused with no consideration of the rights of the earth in general, only the perpetuation of our civilisation and to that end all future scenarios are some variant of technology led, growth obsessed, centralised BAU (maybe not with full globalism but still based around hegemonic power structures at some level). It’s a view from mainstream economists and politicians carrying all the normal drawbacks that those words imply: i.e. bad things happen when the world doesn’t do as it’s told to do by us, and if you don’t agree with us about what constitutes ‘bad’ then you’re wrong about that too.
I think similar studies from more global or European NGOs and governmental departments (both from individual countries or the EU) tend to be more objective and those from the militaries (from anywhere in the west) tend to be more honestly subjective. See for example: The Adaptation Committee’s Independent Assessment of UK Climate Risk, Decoupling debunked – Evidence and arguments against green growth as a sole strategy for sustainability; Reinforcing Environmental Dimensions of European Foreign and Security Policy; Arctic Climate Change Update 2021: Key Trends And Impacts; Our Future on Earth; and The State of the Global Climate 2020 or, for military sources: Implications of Climate Change for the U.S. Army; NATO is responding to new challenges posed by climate change; Ministry of Defence Climate Change and Sustainability Strategic Approach; and Armed Forces, Capabilities and Technologies in the 21st Century Environmental Dimensions of Security.
The rising wealth gap and other inequality issues are a common theme in these global risk studies. However, theories in some recent studies have proposed that it is not inequality itself that is the problem so much as a prolonged sense of precarity (a new word to me and, apparently, to MS spellchecker, but it is essentially identical to precariousness) of the non-elites that accompanies it.
This makes sense from an evolutionary standpoint, as parents desire a stable and resource abundant household in which their children can be expected to reach a reproductive age. This might be expected to come more from the female side, as they are tied to their offspring more than males, who are free to spread their sperm and move on. I have read reorts, possibly anecdotal only, that it will invariably be the woman that will be the party insisting on buying the largest house that can be attained, whether affordable or not. I’m all for gender equality and women’s rights but some things are innate and equal-rights do not mean equal hormones, ambitions, impulses and behaviours. From this viewpoint therefore, solving the wealth inequality issue is actually anathema to population reduction. For example the already low birth rate in Italy had a further step down caused by the increased precarity due to the economic impact of Covid-19, the government has responded by offering direct incentives for havving children. The apparent short term aims are in direct opposition to the what is best long term, this is called a dilemma rather than a problem.
The US seems to be especially vulnerable to issues caused by lack of precarity as it has such a poor welfare system, previously relying on infinite growth to smooth things over or a, now failing, religious faith to keep things in order; prolonged economic and political success that has led to a sense of entitlement and self-belief in the American way, a history of putting personal liberty above all else, which embraces competition rather than co-operation; and a world beating phobia of death well beyond when reproductive age has passed.
The neologism for the growing proportion of people affected by precarity is the precariat. The always readable Tim Watkins has a new post that touches on some of theses issues, with a particular eye on the possibility (or not) of significant inflationary issues (The Everything Death Spiral).
The gig economy, middle class collapse, MAGA, BLM (and the police actions that prompted its rise), cancel culture, (un)reality TV’s attraction, FOMO, the increase in low level strife, self-harming, on-line pornography addiction, the Oxycodone/Fentanyl epidemic etc. are all manifestations and/or causes of that precarity. Civil wars and major revolts (and almost any that succeed in their aims) tend to happen only when there is intra elite infighting rather than uprisings from below. The most likely catalyst for that at the moment is Trump, which may be a good sign given his ineffectualness, ineptitude and general repulsive lack of charisma; anyone even a bit more like a real human being could cause serious ructions.
207 responses to “Annual Reserve Revisions Part IV: Shale Producers”
Great post George thank you. It is quite evident for the astute observer that western democracy has over the years turned more and more into an amalgam of kleptocracy, oligarchy and plutocracy.
How many countries have colonial Europe and U.S foreign policy destroyed in the name of “democracy” and “freedom” ?
I’ve lost count.
Plato famously is said to have said:
“If you do not take an interest in the affairs of your government, then you are doomed to live under the rule of fools.”
In Platos book the republic, Socrates despises democracy as one of the worst forms of government. His criticism those many years ago still resonates till this day (in my opinion).
WIthout invoking logic, I feel the world is in uncharted waters and heading towards a precipice which no one will see coming.
You have a typo, I believe you mean oxycontin (oxycodone) epidemic.
Thanks – fixed now. I guess we may all be addicted to oxytocin in some way and it’s a good thing (until someone invents an artificial form anyway), very much unlike oxycodone.
Mr Kaplan , tks for your post . Just confirms what many have been postulating from some time . EUR estimates in shale plays are a fraud and this is a Ponzi .
George or other petroleum engineering professionals. Would one of you explain this slide in a
Petroleum Engineering Course at Penn State.
https://www.e-education.psu.edu/png301/node/829
It shows a pressure – temperature diagram for oil and its dissolved gases. I am not very familiar with
liquid mixtures and dissolved gases in them, but for gases Dalton’s model says that the partial pressures add to the mixture pressure. In real situations one speaks of the component pressures which are not additive in the same way as partial pressures are.
If the diagram above represents methane dissolved in oil, then the ordinate is the component pressure of methane. Here is the problem. Pressure and temperature are not independent in the two-phase region. In my view, rather than temperature on the abscissa, it should be replaced by enthalpy for this diagram to make sense. Thanks.
Regarding the off-topic finish, I don’t think most people realize how fragile is the glue holding the US together.
Fragmentation along tribal lines is the biggest theme in American culture.
If a minority collection of tribes succeeds in the attempts to reverse election results, even more than the Electoral College already does, the country will undergo a major restructuring (polite description) with no guarantees on a recognizable outcome.
Hicks , not being based in USA ,my view maybe incorrect . The US is undergoing an identity crisis . Where in the world did we have this gender crisis , male – female heck can’t people see between their thighs ? Red-Blue . White Supremacy vs BLM . North vs South . Growing up in the 70’s US entrepreneurship was my inspiration . My hero’s were Ford, Sloan , Edison etc and what do we have today, Musk ? What changed that a society where work was an ethic has transformed into a system where everyone is looking for an opportunity to suck at the teat of the government . Amazing transformation for someone who has a reference point . Now I am going into the stupid zone . What changed was the net surplus energy available per capita to the US citizen . Once that flipped it was downhill all the way . I reserve the right to be incorrect in my assessment .
I haven’t paid attention for awhile, but I think OXY was the number one producer of CO2 flood oil in the lower 48.
Anadarko also owned a lot of lower 48 secondary and tertiary production, as I recall.
These big, public US operators have a lot more in common with us stripper well folks than they care to admit.
Old freakin fields discovered over a century ago is where they operate.
Don’t worry shallow the Paradox basin will save the day. (Sarc)
https://www.zephyrplc.com/
🙂
Shallow Sand,
You are damned right about that!
On Fri the July futures contact for WTI closed at 74/bo and on June 21, 2021 (last data points at EIA) the spot price for WTI was $73.64/bo and Brent spot price was $74.49/bo, so a spread of under a dollar, quite unusual in the past 5 years or so when typical spread has been roughly $5/bo between WTI and Brent (Brent usually has been higher).
Pardon my naivety on this- why is the price of oil generally so similar in various world markets?
In the USA the vast majority of oil is internally produced and consumed, and not part of the European or Asia markets. The abundance or shortage of USA supply does not seem to be directly correlated to the situation on other continents, until the USA returns to being a large buyer on the world market.
On the other hand, nat gas prices vary widely between countries, as one would expect.
Hickory,
Mostly because oil is cheaper to transport relative to natural gas worldwide.
So oil produced in the US competes at the refinery gate with oil imported from around the World. This keeps prices in a narrow band with the spread largely determined by differential transport cost from wellhead to refinery gate.
Note also that US produces about 11 Mbpd, but refinery input of crude oil was about 16.5 Mbpd in 2019, the US has not been self sufficient in crude oil over the 1973 to 2020 period, I don’t have refinery and blender crude input data before 1973, my guess would be 1965. Others might know.
Bottom line the US imports crude and that means the oil produced in the US is competing against oil produced around the World.
Refineries will buy the cheapest oil delivered that meets their input needs for API gravity, sulfur and other measures I am not familiar with.
Thanks Dennis and Ovi.
I would add that every product that can be transported is set by global price, not just FF energy. I live in Canadian lumber country and the high price I have to pay is determined by the US domestic market. same for fish, meat, vegetables, fruit, etc. The only time this changes is when our supply management systems kick in which usually means even higher prices. 🙂 However, and this is a big big however, our electricity rates and policy are set here and God help any Govt that changes that. They would be voted out next election.
The US has been a net importer of petroleum products since 1949 at least, according to the EIA.
https://science.time.com/2012/03/08/0-44-million-barrels-per-day/
Hickory,
Keep in mind grades of oil too. Most oil fracked in the US is actually exported as it is quite light (API>50). Meanwhile, the majority of US refineries are designed to API 30-40 . . . yet one more reason the prices between WTI and Brent stay fairly tight.
Steven , a good issue to point out . This was(is ) getting side lined and will hit us shortly . Analogy would be the GOR and WOR issues in shale . Everyone ignored them until they hit home .
Dennis
This is where I get the latest price for WTI and Brent. The data is 10 minutes delayed. The market opens at 6:00 PM Est today. I think that the Brent WTI spread has flipped. My recollection is that WTi was $2 more than Brent in the early 2000s. Not sure why it flipped.
https://futures.tradingcharts.com/marketquotes/CL_.html
Ovi, I was going to ask the question as to why the spread between WTI and Brent had decreased but you have answered it , not only has it flipped it has gone into reverse and you don’t know the answer . Anyone like to explain . ? My POV is that the traders have got the message that ” peak oil” is now in the rear view mirror and ” oil is oil ” screw WTI or Brent . If you gotta have it then you gotta have it . From now on it is going to get interesting . I am looking for the 1st July when the CCP celebrates the 100 th year of the Communist Party and what vision does Xi postulate . More important than the 4th July fireworks . Funny ,all the fireworks are imported from China .
Hole in Head
Thought I should ask Dr Google.
Many reasons have been given for this divergence ranging from regional demand variations, to the depletion of the North Sea oil fields.
The US Energy Information Administration attributes the price spread between WTI and Brent to an oversupply of crude oil in the interior of North America (WTI price is set at Cushing, Oklahoma) caused by rapidly increasing oil production from Canadian oil sands and tight oil formations such as the Bakken Formation, Niobrara Formation, and Eagle Ford Formation. Oil production in the interior of North America has exceeded the capacity of pipelines to carry it to markets on the Gulf Coast and east coast of North America; as a result, the oil price on the US and Canadian east coast and parts of the US Gulf Coast since 2011 has been set by the price of Brent Crude, while markets in the interior still follow the WTI price. Much US and Canadian crude oil from the interior is now shipped to the coast by railroad, which is much more expensive than pipeline.[10]
I guess it is as good an explanation as any.
Ovi , not satisfied with the explanation . The traders use horoscopes , astrology to birth charts to make decisions . If it was logic we would never have minus $37 price . It is a tragedy that the guys in Texas who produce the stuff have little say what NYMEX decides thousands of miles away . The same goes for agro and farm produce . My sympathies are with SS , Mike S , LTOS etc and with OFM who have to bear the pain for this anomaly . I think my explanation maybe not correct but better illuminates the situation .
Hole in Head
I’ll even buy that explanation.
I heard that that Italians were able to switch T votes to B votes from satellites. Who knows, they may be even manipulating WTI and Brent?
Hole In Head
The negative pricing of the May ’20 contract upon expiration actually made a lot of sense. If you’re holding the contract once the contract expires, you must take delivery. But taking delivery implies having someplace to put it. At the time, given the unprecedented drop in demand, Cushing was very close to capacity. While I think there were only 13-16 million barrels net outstanding among the open May contracts, that isn’t always clear at the time. And the numbers at Cushing are only any estimate anyway . . .
Plus, with the cancellation of Keystone XL, and the continuing construction of the Trans Mountain pipeline to tidewater at Vancouver, the domestic oil prices in US will more reflect World prices going forward. Just my opinion.
My question is about electricity. So, when the FF ICE vehicles are all converted to battery packs, as well as fast charging stations built everywhere, where is the electricity coming from, methane leaking NG wells…that have inadequate pipeline infrastructure due to being short lived shale plays?
“where is the electricity coming from”
For the next 20 years it will be a combination of coal, hydro. nuclear, nat gas, wind and solar. All in big amounts and varying depending on where you are.
Will it be enough? Yes, it will have to be.
Will be enough to keep doing everything we might wish for? Doubtful, or worse.
Will it be enough to be functional?- yes, in many regions.
Will there be enough batteries? Doubtful.
How long will take for ICE’s (and oil) to decline? A long time.
Will it be much hotter? Yes.
[All time heat records for Portland and Eugene this very day, and just saw Port Alberni at 109 on the map!]
Steven, “The negative pricing of the May ’20 contract upon expiration actually made a lot of sense ” > Of course it does ,it is called a “stop loss” . The point is not that . The point is who entered the contract at the earlier date, after all this was a futures contract . These guys are supposed to be professionals with sophisticated software , models and a MBA to boot . Might as well get a monkey to throw darts . Definitely someone was asleep at the wheel . Covid was already known in end of Jan 2020 just before the Chinese New Year and this event was May 2020 . Anyway now all markets have become manipulated and the real purpose which is ” price discovery ” exists no more .
Ovi , “I guess it is as good an explanation as any. ”
Agree .
Hole In Head,
All those sophisticated algorithms and MBA training courses sometimes play second fiddle to the reptilian brain sitting in front of the screen with the buy and sell buttons. Personally, I blame the CFTC. They should have intervened.
Steven , agree with the reptilian part of your comment .
CFTC, SEC , FINRA = The Fox guarding the hen house . They are like cops in the movies , last to arrive at the crime scene .
World Oil Situation 2021
https://www.youtube.com/watch?v=EaXoAfa1tAw
This is an in-depth video of World production and consumption.
Blackouts Loom in California as Electricity Prices Are ‘Absolutely Exploding’
https://www.realclearenergy.org/articles/2021/06/24/blackouts_loom_in_california_as_electricity_prices_are_absolutely_exploding_782903.html
Adnoc imposes deeper cuts to September crude exports
“Abu Dhabi’s state-owned Adnoc has informed customers that it will implement cuts of around 15pc to client nominations of all its crude exports loading in September, even as the Opec+ coalition considers further relaxing production quotas.
It was unclear why Adnoc is deepening reductions for its September-loading term crude exports, with the decision coming ahead of the next meeting of Opec+ ministers scheduled for 1 July when the group is expected to decide on its production strategy for at least one month”
Russia plans to cut oil exports from its Western ports by 22% in July vs June – schedule
“On a daily basis, loadings will decline by 22% in July compared to the current month, Reuters calculations showed.”
Russia struggles to raise oil output despite price rally -sources
“Russian oil production has declined so far in June from average levels in May despite a price rally in oil market and OPEC+ output cuts easing, two sources familiar with the data told Reuters on Monday.
Russia’s compliance with the OPEC+ oil output deal was at close to 100% in May, which means the state is about to exceed its target in June.
Two industry sources said that lower output levels may be due to technical issues some Russian oil producers are experiencing with output at older oilfields.”
Yes, they are definitely experiencing issues with their older oilfields, it’s called depletion. But that decline is only 33,000 bpd or .3%. But your post above that one says exports in the third quarter will decline by 22%. What gives there?
Their decline in May was 23,000 bpd.
Ron
I just checked the Russia site and they have revised up their original May estimate. It is one week later than the original. Production is now down 9,000 b/d.
Yeah, they revised it up by 14,000 pbd. A pittance. Now they are down only 9,000 bpd instead of 23,000. Nothing to get excited about. Basically, they were flat in May.
”Russia plans to decrease oil loadings from its Western ports to 6.22 million tonnes for July compared to 7.75 million tonnes planned for loading in June, the preliminary schedule showed.” 7,75 x 10^6 – 6,62 x 10^6 = 1130000 t. 1130000×7,3/30 = 274966 b/d. Therefore, these decrease of oil export suggests a decrease of production of 274966 b/d. Precedently, it was announced that oil exports of Russia would decrease of 7,2 % for the period July-September or a decrease of 308222 b/d. Therefore, it’s coherent. https://www.zawya.com/mena/en/markets/story/Russias_quarterly_crude_oil_exports_to_drop_72_schedule-TR20210617nL5N2NY2IQX8/?fbclid=IwAR0ZjvwzjVS427CbUAzTL1vJfqog7R8CDwaJAvI3uUdaw_0z5S5l_57SGFY I notice that it concerns the ”Western ports”, therefore the exports toward EU and USA. Well, EU is also the main customer of Russia with 59% of the oil exports of Russia.
Western Russia is where all the very old supergiant fields are. They produce 60% of Russian crude oil. Or at least they used to.
Ron
If one of the West Siberian giants is rolling over in the same way as Daquing did, things could get very interesting very quickly.
Four of Russia’s five giant fields are in Western Siberia. The fifth is in the Urals, on the European side. All five have been creamed with infill horizontal drilling for almost 20 years. All five are on the verge of a steep decline. Obviously, one and possibly more have already hit that point.
This linked article below is 18 months old but there is a chart here that shows where Russia’s oil is coming from. Notice only a tiny part is coming from Eastern Siberia, the hope for Russia’s oil future. Those hopes are fading fast.
The Worrying Truth About Russia’s Oil Industry
As I have written a few months ago: When you reduce output voluntarily for a longer time, all the nickel nursers from accounting and controlling will cut you any investing in over capacity you can’t use at the moment. That works like this in any industry.
So you have to drill these additional infills and extensions after the cut is liftet. And this will take time, while fighting against the ever lasting decline.
Chad’s ExxonMobil Workers Strike, Reducing Crude Output
“Local media reported that Chad’s daily production of 120,000 barrels of oil will be reduced by a third by the protests.”
Here’s a fun one: https://youtu.be/dw1fiXc6Qs0
I stumbled on this Peak Oil documentary on YouTube a few days back. I didn’t expect much, but was pleasantly surprised to learn a lot about the extreme lengths that the world’s oil companies are now taking in order to drive production. From ultra-deep wells, to custom polymers with the density of oil to replace water during injection, to massive undersea networks of cables and pipes connecting wells hundreds of kilometers apart, and new techniques for boiling tar sands deep beneath the ground in order to release light oil without the need for processing all that sand… I thought I’d discovered a pretty fun look at the current state of the oil industry…
So imagine my surprise when the last 10 minutes of the documentary was about abiotic oil! And took it seriously as a means of avoiding the peak! Now I have to unlearn everything in the doc, since I have no way of knowing what was accurate and what was bullshit.
Niko
I find it strange how people can believe long chain hydrocarbons chains can form via a natural process without biota, it is a very strange belief indeed.
They always seem to bring up Titan. But they always fail to mention that there is no evidence of complex long chain hydrocarbon pools on that planet.
Ahead of talks, OPEC forecasts point to oil supply deficit in August
“The Organization of the Petroleum Exporting Countries and allies, known as OPEC plus, is returning 2.1 million barrels per day (bpd), about 2% of world output, to the market from May through July as part of a plan to ease last year’s record output curbs.
OPEC’s latest forecast of the demand for its crude suggests, if output levels stay the same, OPEC supply will fall short of expected demand by 1.5 million bpd in August. The shortfall widens to 2.2 million bpd in the fourth quarter.”
I am still far from sure OPEC plus will return 2.1 million barrels per day from May through July.
I get a lot of lease auction stuff emailed to me.
I don’t see much conventional lower 48 onshore oil production for sale right now. Not sure if there is a mismatch on price between buyers and sellers?
Seems like a lot of lousy shale projects for sale. Tons of deals where there is maybe less than 100 BOPD gross coming from 3-10 wells, with several locations left to drill. Sometimes a DUC or two.
I guess everyone is trying to unload the Tier 3 junk.
Some conventional gas for sale, but not a lot of conventional oil deals. Chevron sold some earlier this year in the Permian, but nothing recently.
I know replying to my post is in bad taste, but I might add that it is apparent that at least some petroleum will be needed for at least 30 years, if not more.
We continue to fret not only about the oil price and lack of labor, but much more about government intervention.
Is the general consensus here that if the Feds just say too bad, you must shut down, that we should bear 100% of P & A for that? That is the debate we are having.
Yes, if oil prices drop below production costs for too long, that’s too bad for us. We have always accepted this.
But what if oil is $70 and we are making $30-35 net per barrel, and the Feds order us to shut in. Is that a taking? Is it just too bad for us?
See why there isn’t going to be enough oil for the Western countries given this situation? They are providing operators zero clarity.
Shallow sand,
Has the Federal government ordered wells to be shut in on private land that are meeting all environmental regulations?
Even on Federal land and water, so far the Federal governmnet has simply stopped issuing new permits. The Biden team let it be known that they were planning to suspend new deilling permits on Federal land and water so companies loaded up on permits before Jan 20, 2021. My understanding is that the permits are good for 4 years.
See
https://www.nasdaq.com/articles/big-u.s.-oil-drillers-have-federal-permits-to-mute-effect-of-any-biden-ban-2021-01-21-0
Have there been a bunch of new regulations that have been approved recently?
Not sure where the concern is, at some point there might be a lack of demand which might bring oil prices to lower levels, but this seems unlikely before 2035 or so.
Maybe sell your oil investments when WTI reaches $110/bo in 2025 to 2030.
Guess it’s more.
Replacing everything with a post – oil – vehicle will take time. And there is the good samaritan paradox. When all the Bidens and Merkels and Greens of the west get holier than holy and reduce oil usage hard and fast – even for the price of a depression, oil will get cheap (not much oil in the direct western soil). And then Asia and South America will have no incentive to switch away from oil (lot’s of cheap used vehicle on the market), and use it up. Big trouble – but not a litre of oil not consumed.
Change away from oil will come with higher prices and better technology – not green paroles and self flagellation.
The West can’t stop production of any drop of OPEC, African, South American, Russian … oil – so a intra-USA-oil ban would only just be stupid.
Talking about stupid – this year there are elections in Germany. When we get a green successor of Merkel, we can talk again about stupid ideas and shooting in the own foot.
Sorry for the rant 🙂
Talking of post-oil-vehicles, my friend’s Kona EV has used 600kWh in the last 15 months. His PV panels have produced 3200kWh in the same time-frame. Kona does 4.8 miles/kWh. Running on sunshine. Can we transition fast enough?
Eulen , waiting to see what happens in the upcoming elections . Greens seem to be loosing ground , is it because the public suddenly realizes that ” green ” means no goodies ? Well as they say ” Everyone wants to go to heaven but nobody wants to die .” 🙂
My impression of Germany is that interest in renewable energy and electric vehicles has gone way up in the past year.
Nearly five GW of solar were installed in 2020, the most since 2012. Sales of EVs tripled in 2020 and look like they will grow by 50% this year. Last year they were 14% of the new car market.
You see a lot of EVs on the road these days, and quite a few charging in people’s front yards. More and more delivery vehicles are going electric as well. There is a clear increase in the last year. And of course electric bikes are everywhere. It’s also noticeable that electric lawn mowers and hedge clippers are taking over. Sadly, not the leaf blowers yet.
On the other hand installations of wind turbines is much lower than in 2018.
All in all, it sort of looks like the much ballyhooed technology change is actually starting. Coal looks like it’s getting hit hard, but it’s early for the oil industry to get worried. There’s no real sign of change in oil consumption.
“and the Feds order us to shut in”
I can find no news about the Federal government ordering oil producers to shut down.
Perhaps I don’t have access to the correct media?
Dennis and Hickory,
I have addressed this issue on several occasions, the last of which was the previous petroleum thread here. To be honest I do not understand the dismissal of my direct experience and the evidence that industries can be destroyed without a law being passed. Perhaps the owners of the Keystone XL pipeline should’ve waited for Congress to pass a law making the pipeline illegal. Oops, that happened by executive action alone. So far only Shallow Sand has repeatedly had my back but then he is only one of three in the same boat here as owner/operators with common experiences and lighter wallets.
When Executive Branch agencies, whether federal or state, are free to promulgate rules and regulations that materially and sometimes existentially effect business, you are seeing de facto executive orders. The legislative rule stops at the point of creating the agency and it’s vague, open ended mission.
One point of my previous comment if not clearly stated was that regulations can become so expensive or burdensome that some businesses cannot survive. To suggest that such is Darwinian and just ok is ignorant. The issues is not the viability of the company but the viability of the producing asset. You would be surprised to know what the ratio of produced water to produced oil is in this county. In the Permian it is 5-8 to 1. Many old, virtually zero decline rate water drive fields are 95 to 1 or higher. Faced with even conversation or proposition about new overarching rules or laws is threatening and treated seriously on this end. All too often the speculation ends in regulation.
This site is interesting and educational as I am not a statistical analyst or successful financial prognosticator so I get a chance to see how people think in areas beyond my field of experience. That is not to say that some of the basic data used is beyond my ability to question based on what I see and hear firsthand. This pushback of yours comes from what appears to be positions of zero experience yet with some attitude. Normally I let this type of thing slide a bit but the societal and governmental attitudes about oil and gas operations are overwhelmingly damming and work out as psyops to me and many like me. Just wait until you get a first notice letter from the government with the paragraph that states that failure to comply in such a time may result in….staggering maximum fines. Those things, in the aggregate, ruin your day, your outlook and sometimes your marriage. Perhaps a little deference to those that have been there is in order.
And FYI, I can’t sell or give away my properties in CO. If you think that I’m exaggerating, then you replace my surety there and I’ll set you up as an operator and you try it. I could use the 85K. But first I would check with a few of the other 75 or so operators in the state that are likewise screwed.
Sorry Rasputin,
I understand rules have changed in Colorado. Was thta due to the Federal government, I thought it was state regulations.
I believe shallow sand lives in a different state, it is not clear what he is talking about, perhaps you know, he does not live in your state.
Thanks Dennis.
Yes SS lives in another state, a very old producer like Illinois. I am so thankful that he relates to my comments and stepped up the other day.
He also spoke to radical access to their facilities. As an aside, if some dip of an inspector opened or closed some valve and created a big mess, loss or environmental liability it would be hell to pay for the state or the inspector. You would faint if I recounted stories of brain damaged ignorance of or by inspectors even with industry experience. I swear, those guys must take an oath no to ask a question first and accept the answer as the basis for finding the truth before proceeding.
He was also addressing the situation in CO that I’ve often described as an example of rapid political shift. However, he did not address the mechanism only that it would not have seemed likely to happen considering the historical operating environment there.
The fuse that lit this debate was a proposed federal law. While it probably won’t come to pass by way of legislation it can come by way of regulation. Many executive branch environmentalist employees probably never heard of the distinction between solid waste (flowback and produced waters) and more highly regulated hazardous waste. They have now. I repeat, planting bad seed in fertile soil is never good. In the end it matters not what the source of the regulatory catastrophe is; only that it is.
I seldom comment here and that is when I can provide insight, knowledge or experiences related to the mission of the site. Yes my views are sometimes presented too emotionally but they are often wise and almost never offered by others even though they are variables in equations and projections. If you don’t believe me go to Marketed Crude Oil Production at the EIA site and plot the historical curve for CO. Let’s just say that it stands out in the crowd.
Thank you again for the opportunity to address this forum.
Dennis.
My family has operated wells since the 1970s. We have learned over this long time to try to anticipate, not just sit back and wait for things to happen.
Almost all of the regulatory people in our state with any experience have retired. We have people with the authority to fine us who don’t know a producing well from an injection well. We know that because we have had them cite us for not complying with injection well requirements on a producing well and vise versa.
We have to have a well identification sign on every well. We have been cited for not having signs even though they are there. Just figure an inspector needing to fill a quota. I could go on forever about this, but I won’t.
We also get the letters which threaten to fine us $1,000 per day. We T/A a well in the presence of an inspector. Less than 6 months later, another inspector wandered on the lease and cited us for improperly T/A the well. (He didn’t like the way the well head was configured. We just changed it to what he wanted). That resulted in one of those letters that threatens $1,000 per day in fines.
The people in the state office thought we were being too dramatic when we were upset that another inspector wrote us for what an inspector had approved 6 months prior. They actually said, “You should know we won’t fine you for this.”
How the heck would we know that?
Haven’t you heard of the “keep it in the ground” movement? They have been successful in New York. They have been successful in California.
I think it is a legitimate question to ask. All it would take is a one size fits all methane rule or some impossible water disposal rule and we are sunk. Why do you dismiss that? The US EPA is working on the methane rules as we speak and a congressman from New Jersey is proposing to treat produced water as hazardous waste. That is really happening.
We are very familiar with regulators who have little industry experience. I’ll leave you with this.
The sand we primarily produce from was discovered in 1905 by Mike Benedum and Joe Trees. Mike Benedum was one of the greatest wildcatters in the history of the United States. Google him.
This sand was named in 1906 and was first mentioned by name in a state geological survey publication in 1909.
Two years ago, a nice man with a non-oil background got a job with our state regulatory agency. He decided that the name of our sand is incorrect. If anyone files a report with our state and mentions that sand, it gets sent back with a letter that the sand “does not exist.”
Most of our field has depth restrictions to the base of that sand. Now the state says it does not exist. What do you think about that?
I am thankful Mike and Rasputin are here some. Otherwise you’d all think I’m wrong. But I am not. Our biggest fear is regulatory changes that will force is to shut in. The second is lack of labor. Third is oil price.
Keep in mind we survived $8 oil in 1998-99, $100 crash in four months in 2008, $25 oil in 2016 and negative oil in 2020. But we can’t survive the other two fears.
@Shallow
That sounds realistic.
As I have written a few days ago – you can sink any mining / drilling company by just shuffling around with enviromental regulations.
And the greens are near or at the government now. They are kind of maoistic – normal people should not be allowed to drive a car, only bus and trains. Here the greens already think of climate lockdowns after the corona lockdows – just jail the people at home for a few months, promote veganism for all. It’s still only a wing in the party, but they gain influence and have much positive news coverage.
Here most people are brainwashed enough to elect these parties – it’s in TV and all big news sites. We don’t even have a “fox news” here – even the most conservative news sites are 60% “in line”.
I don’t know the situation in the USA – are all the conservative countries now receiving green changes and critical race theory in schools?
PS: I had access to a journalism university here. If you aren’t hard left / green, you won’t finish your study. Oil business is pure evil, it’s capitalism and anti enviroment satanism. At least they think.
Eulenspiegel.
I don’t want to make it too political because here in the USA that just devolves to a screaming match. If you want to go further into politics we can on the non-oil side.
Access to fuel, electricity and food is taken for granted in the USA, and I hope it always will be able to be. A large segment wants to eliminate the fuel part. I include both oil and natural gas in “fuel.” Coal obviously is there too.
What is concerning is those with the power to shut down the fuel maybe don’t know just what will happen and have little expertise in these areas. I’m astonished, for example, that there is no plan on where to locate solar. Prime tillable farmland is being gobbled up merely because it is close to transmission lines.
Shallow sand,
Sorry if I seemed dismissive. It is clearer now that you are very worried about changes in regulations, I jsut had not heard anything specific that had occurred. I agree both the regulators and regulations should be better, it is not clear what could be done about it. Has there been a big shift lately where you live perhaps because of a new governor or something or because of the change in administration. I would think local EPA workers are career people that would not change much with the administration though top down orders would be different. Is the problem more with local and state officials or is it Federal inspectors?
I do not know who enforces existing regulations, (in other words who pays these inspectors, local, state, or federal government?)
Rasputin,
Thanks for your comments, adds to the understanding.
Curious if there is an oil price that will work for you to overcome the stupid regulations.
Dennis.
States most directly regulate upstream oil and gas. However, State regulations derive many times from federal laws.
For example, with regard to injection and disposal of produced water, the US EPA has many stringent regulations. The States are required to have a regulatory framework that complies with US EPA regs. The US EPA monitors the States’ regulation, and has the authority to take over the monitoring from a State if the State regulation is deemed inadequate.
Of course, operators have to comply with all Federal and State regulations. The States generally have a specific agency (not State EPA) that directly regulates oil and gas operations. Inspectors of this agency are the direct contact with operators and the leases/wells/facilities. The inspectors have free rein 24/7/365. They prepare and file reports electronically. Depending on what the report is about, the operator then deals with the persons in the regional or state office who are over that area.
Most state agencies have as one of the first pieces of website information a citizen complaint form. So sometimes matters are initiated that way. However, 99+% are initiated by inspectors.
Of course, the State EPA becomes involved anytime there is a complaint made by a citizen. Same w US EPA. Those complaints typically involve leaking flow or injection lines. Likewise, the state regulatory agency has the authority to contact the state and/or US EPA as well.
Again, there are people in high positions in the Federal government who would like to 100% end both methane emissions from upstream oil and gas and would like to end injection/disposal of produced water. Understandable maybe, but complete end would completely end US upstream oil and gas.
So, then the question becomes where will the Feds draw the lines on these things.
Or, in cases like CO, when something won’t pass the US Senate, the State might just decide to pass the same thing at the state level. As I recall, CO has even had voters vote on upstream oil and gas matters. And as I also recall, when the vote came out favorable to oil and gas, the legislature went ahead and passed the things that had been voted down.
If oil and gas can be phased out with something better, great. But that hasn’t even been proven, has it? Do we know that we can power all transport with wind, solar and hydro in the USA? Do we know that we can heat and electrify all structures in the USA with wind, solar and hydro? Do we know that we can replace all uses of petroleum for plastics etc with some other material?
If we do know these things, how long will it take, and what is the best way to wind down oil, gas and coal? I don’t hear policy makers stating facts such as these, do you?
Shallow sand,
I agree the energy policy in this nation is a mess. I believe most of the people in the center politically, think we should properly regulate industry (not onerous regulations, just plugging leaking wells properly, shutting down wells with excessive methane leaks (and I do not have the knowledge to determine what would be deemed excessive) and gradually transition to alternatives to fossil fuel.
To me the best approach is a market based solution that charges a fee for carbon emitting products at the mine or well head based on carbon emitted by that product when it is used. The fee and dividend approach would refund these fees to citizens in a fee and dividend type system. The carbon price would gradually rise over 10 years from say $30/metric tonne to $100/ metric tonne over a 14 year period with a $5/ metric tonne increase each year.
This way people could plan, in fact perhaps simply a $5/metric tonne increase (in constant 2021$) for 50 years would allow a longer horizon for planning. The risng price of fossil fuel would be an incentive to gradually switch to other sources of power.
At some point the switch will need to be made as all fossil fuel will peak and decline.
Picked this from Peak oil.com . Shale is over .
https://i.ibb.co/HrnVgJj/DE4-A4267-6077-4-BB4-9-A4-C-95-C7-B647665-D.jpg
https://i.ibb.co/sV6msYY/31-AED132-2659-489-B-9-B20-B2528-D59-EC90.jpg
Hole in head,
There is a person over at peakoil.com that knows even less than me that makes silly projections based on Hubbert curves. It is way too early to use Hubbert linearization to make any predictions and in any case Hubbert Linearization doesn’t work vey well. See the well known post by Robert Rapier below.
http://theoildrum.com/node/2357
See also
https://www.rrapier.com/2007/03/peak-oil-and-lunatic-fringe/
In my view, what Mr. Rapier wrote in 2007 remains true today.
Alternative Permian scenario below, output about 4000 kb/d in June 2021, 7000 kb.d in Jan 2025 and a peak in 2033/2034 at 7600 kb/d, URR=60 Gb, all debt paid back by 2031, production ends in 2049 as oil prices fall to a level that make tight oil no longer profitable. Oil price maximum assumed at $78/bo (2021 US$) for WTI, if the WTI/ Brent spread remains $2/bo (Brent at $80/bo max in 2021 US$). Oil prices are assumed to start decreasing in 2033 as transition to EVs removes demand from oil market faster than demand growth from air and water transport, and other uses for crude oil (farming, home heating etc).
The red data is from shale profile through Dec 2020 and EIA data from Jan to May 2021. The shale profile data is for tight oil from horizontal wells only, EIA data is for horizontal and vertical tight oil wells. The model is for horizontal wells only. Note that for most of the period from 2010 to 2021, the model is an underestimate of actual tight oil output in the Permian basin as my well profiles may be a bit too conservative or the well count data might be in error (I use data from shale profile for 2010 to 2019 and estimates based on output data and model output based on estimated well profiles (Using DCA on shaleprofile well quality data) for 2020 to 2021.
There is a person over at peakoil.com that knows even less than me that makes silly projections…
Wow! That guy just doesn’t know shit, does he? 😉 Seriously Dennis, on your chart, draw a line straight down, from the last red plus sign on your chart. Then compare the area under the production line to the left of that line to the area under the production line on the right of that line. Just look at those two areas and ask yourself: “Do I seriously believe that shit?” And there would be even more if you extended your line out to 2050. The area on the right would be about ten times the area on the left.
Dennis, many Permian drillers are already drilling child wells because they have run out of other places to profitably drill. Dennis, your chart cannot possibly be anywhere close to being correct.
Ron,
Based on the data at shaleprofile.com and LTO survivor’s observation that child wells produce roughly 60% of the parent wells, I doubt many child wells are being completed.
Yes I believe this will be a reasonable estimate of future Pemian basin output for the prices assumed in my scenario. I assume the USGS mean TRR estimate of roughly 75 Gb for the Permian basin is correct. The USGS 90% confidence interval is 44 Gb to 114 Gb for Permian basin TRR (technically recoverable resource) with a mean estimate of 75 Gb. My best guess 60 Gb URR estimate is based on this mean estimate which in the case of the North Dakota Bakken/Three Forks mean TRR estimate (11 Gb) leads to a very reasonable URR estimate of about 8.5 Gb (roughly equal to cumulative production plus proved reserves at the end of 2019).
In short, I believe my estimate based on current shale profile data for wells through 2019, output data, completion data and USGS estimates and my estimate for future well cost($10 million in 2021 US$), OPEX (about $13/bo in 2021 US$), and prices (outlined in earlier comment). Any and probably all of these projections and assumptions about the future have a zero probability of being correct, but if all of them were correct, the scenario would also be correct.
Ron,
Well maybe Dennis knows more about Shale oil than Parsley Energy’s CEO who stated the following:
Chief executive of Parsley Energy Matt Gallagher said that the peak production that the United States hit back in March—13.1 million bpd on average—represented shale’s glory days, ne’er to be repeated, according to the Financial Times.
I gather Matt Gallagher just didn’t put enough ZEROs after his well production estimate like Dennis?
steve
Steve,
Dennis is simply calculating different scenarios based on the estimate of TRR the USGS has published. Some people here are arguing these scenarios but not the USGS estimate. Of course not all of the TRR will be produced because some of that oil is too expensive to produce. If you do not agree with Dennis´estimate of URR in the shale patch, what is your estimate and what facts is it based on?
There seems to be a hell of a lot of potential drilling locations in the permian basin and there are no hard arguments against Dennis´scenarios that say that oil production in the permian has the potential to increase for some years.
Best
Toby
there are no hard arguments against Dennis´scenarios that say that oil production in the permian has the potential to increase for some years
Toby, you obviously have not been following this thread very closely, else you would not make such an incorrect statement as that. Mike Shellman, LTO survivor, both oilmen, and many others have produced very hard arguments against Dennis’s overly optimistic estimates. And there were others who have made very sound arguments that the shale patch is in dire trouble. And I myself have posted dozens of articles from the web that tell what a damn mess the shale patch is in:
Is The U.S. Shale Boom Over? Four Major Threats To The Fracking Revolution
I posted a different “shale in deep shit” article this morning. So did Hole in Head, and many such articles have been posted in the last few days and weeks. There are hundreds on them on the net.
And you say there are no hard arguments against shale production increasing for years? What planet are you living on anyway?
Ron,
one statement in the article you linked above says that shale drillers might run out of their most productive acreage within five years. That is far from “the party is over” and far from “there might be 100000 or more locations left in the permian basin”.
I think we have no idea what the URR in the permian basin will be.
A hard argument against Dennis´scenarios would be something like the USGS estimate is too high because
– well results show, that EUR per xy reservoir acres is far less than the USGS estimate or
– the productive area for bench xy is far less than the USGS estimate because well results have disappointed in this and that area.
Dennis´scenarios may turn out to be too optimistic, but he is the only one here who makes predictions on the URR.
Rig count in the permian is rising steadily and at some oil production will go up again. If there is five years of top tier inventory left to drill as stated by Mr. LeBlanc US shale production may exceed the levels reached in late 20219.
I think we have no idea what the URR in the Permian basin will be.
I think you may be on to something there. Now tell Dennis that because all his charts are based on the IEA’s or the USGS’s URR enormous estimates.
Toby, I put great store on what people like Mike Shellman, LTO Survivor, Shallow Sand, and Rasputin say. These guys are actual oil men, they work in the oil patch every day, they know what they are talking about. They all say the shale oil patch is in deep shit yet you, Dennis, and a few others, others who likely have never seen an oil rig, tell these oil guys they are full of shit. Somehow that just doesn’t seem kosher to me.
And I must add, almost every day I read an article by Oilprice.com, or Reuters, or some other oil patch reporting service, telling me basically the same thing that the afore mentioned four oil patch experts are telling me. And I have yet to find even one that tells me the opposite. So you tell me whom I should believe, you, Dennis, and a few other armchair analysts who have never seen an oil rig, or every damn expert in the business?
Ron,
I have never said that anybody is full of shit and I also never said that everything is fine in the shale oil patch. What I am looking for is a reasonable estimate on the future production potential in the permian basin.
When we look at the Bakken, the USGS estimate of TRR is probably not to far off and I think Dennis´estimate of between 28-33000 total drilling locations is also reasonable.
For the permian we have estimates that say the WC is going to crash within two years and others say there are dacades of inventory. Both will be wrong I think.
Without hard data that show where the USGS estimate is either reasonable or far off everything is pure speculation.
I think Parsley Energy’s CEO would know what he is talking about. However, I am a little confused by his numbers. The USA’s peak production, according to the EIA, was back in November 2019 at 12,860,000 barrels per day. But that month does represent shale’s glory days, ne’er to be repeated.
For now shale´s glory days may be over. Many companies are hedged at or below 50$ and that is expensive so a lot of cash flow is lost to hedging. That is going improve if oil prices keep rising.
In the long run the question will be how much of the resource can be extracted at higher oil prices. Matt Gallagher made that statement when WTI was well below 50$.
Toby, every man in the business knows oil prices are volatile. And they all know that oil prices will increase when production starts to decline. Matt Gallagher did not get to be a CEO by being a blooming idiot thinking oil prices would never increase. His estimate was not based on the price of oil at that time.
Steve,
We agree that peak output for the US is likely in the past, I think the decline in conventional (including offshore output) will offset the rise in tight oil output.
Not all oil CEOs may agree that the tight oil peak is behind us.
Dennis , I picked this up from the topic ” New Wolfcamp Data ” posted on peakoil.com . It was posted by “mustang 19 ” who claims it is EIA projection . Several graphs Bakken , Eagle Ford , etc . Suggest you read there . I am not competent enough to analyze the info therein . You know more than me on these issues 24/7 .
Yep, you picked the right thread. Wolfcamp will utterly collapse in 1-2 years.
Made a mistake on my scenario above due to an error in my spreadsheet, revised scenario in chart below, my apologies. Ron was correct the 60 Gb scenario is not realistic for the mean USGS estimate and the oil price scenario with Brent at $80/b in 2021$ maximum.
The revised scenario has a URR of about 46.5 Gb and the peak is about 6600 kb/d in 2030 for Permian basin tight oil.
About 110 thousand wells are assumed to be completed from 2010 to 2037 with about 33 thousand wells completed to date.
No way
Thanks LTO survivor.
We will see. Do you have a URR estimate for the Permian basin? I have a lower estimate that I have done in the past based on the F95 TRR estimate by the USGS of 44 Gb, with ERR of 27 Gb. I asked for comment, but got nothing.
Is the projection at shaleprofile which assumes 270 completions per month from June 2021 to Dec 2029 (27540 wells completed) realistic in your view? Seems higher number of frack spreads operating could lead to a higher number of completions than assumed in Enno’s scenario.
In any case thanks for your comment.
Tight Oil scenario using Permian well profile in 6/29/2021 7:27 am comment, peak is in 2030 at about 9580 kb/d, URR=88 Gb, with about 61 Gb from Permian basin ( difference from earlier 60 Gb URR estimate is that here I use EIA data for Jan 2000 to Feb 2021 and model estimate after February 2021, before it was model only over 2010 to 2048.
Prices similar to what was outlined in comment on Permian scenario.
Really? This data is from Shaleprofile.com? Are you sure? I had no idea Enno Peters made such absurd predictions? I am sorry Dennis, but 88 Gb is a totally absurd prediction. That is nowhere remotely close. I can understand that the EIA might make such an absurd prediction. But I am truly shocked that Enno Petes would concur.
Ron the underlying data for completion rate through the end of 2019, well quality data, and output data comes from shale profile.
The projections for future supply at shale profile assume no change in future rig count from the most recent estimate on June 25, 2021. I do not make the same assumption, my expectation is that rig counts and frac spreads will continue to increase, particularly in the Permian basin which is the source of all of the future increase in tight oil output.
Enno peters asked that I give credit to shaleprofile when I utilize data from his blog.
There is no data from the future (or I don’t have any).
Ron,
EIA AEO estimate to 2050 for tight oil is about 125 Gb, my tight oil estimate is about 70% of the most recent AEO reference case through 2050. My scenario declines sharply around 2039. The EIA has tight oil at 8700 kb/d in 2050, my scenario has US tight oil output at 710 kb/d in 2050 (annual average output).
Note that there are those who would call my estimate absurdly pessimistic and often in the past people have claimed my scenarios were much too optimistic, when in fact the opposite has been true.
Dennis,
your scenario is probably based on the USGS TRR estimate. Their mean estimate for the Wolfcamp in the Midland Basin for example has an average drainage area of 100 acres per well and these wells should make around 167 kbo each.
From shaleprofile we get that the average permian well has an EUR of around 350 kbo and productivity per lateral foot is already in decline.
Do we have good information on the drainage area of these 350 kbo wells? From what I have read here the spacing of those wells is wider and thus the USGS mean estimate for EUR per 100 acres might be too optimistic.
Best
Toby
100 acres per well works out to be 6.4 wells per section. (1 square mile.) I am in communication with one Permian driller who tells me that they are getting about 4 wells per section. So yes, the 100 acres per well is way too optimistic.
Ron,
I think you misunderstand. The average lateral longth is 8500 feet, so it needs more than 5280 feet in length. The driller probably means the section width of one mile and 4 wells per mile of width, so spacing of 1320 feet times 8500 feet for lateral length divided by 43560 sq ft per acre=257.6 acres per well.
I have read that 5 wells per mile is optimal rather than 4.
See
https://jpt.spe.org/how-close-too-close-well-spacing-decisions-come-risks
The problem with 4 wells per mile is you don’t get the most oil out of your leased land. Drilling child wells between wells spaced at 4 per mile is a problem. It may be the way it has been done, but going forward the best companies will use 5 wells per mile to optimize output per acre at the lowest cost.
When the USGS did it’s study, shorter laterals were being used, thus the lower output and smaller number of acres per well.
For my models I take the current optimum well at 8500 feet by 1000 feet (about 200 acres per well) and divide by the 49 million net acres the USGS uses for its mean estimate we get about 245 thousand wells drilled after 2017 (the USGS estimates were produced from 2016 to 2018, I just take 2017 as the average because I don’t have detailed well completion data from each basin).
I base the EUR on decline curve analysis using the well quality data from shaleprofile.com.
In any case, I use their net acre estimate (49 million) and a total of 215 thousand wells drilled in a TRR scenario from Jan 2018 to last well drilled which is about 228 acres per well (a well roughly with 1050 foot spacing, 5 wells per mile, and 9500 foot lateral).
No, I don’t think I misunderstood. But would some oil man correct me if I am mistaken? I am fully aware that the lateral length is more than one mile long. However, this oil man told me that the average was 4 wells per square mile. On 100 square miles, you would have 400 wells.
Hi Ron,
Let’s agree that lateral length is 8500 on average, if spacing was such that we had 4 wells per square mile that indicates a spacing of about 3300 feet between laterals.
According to the research 1000 to 1360 foot spacing is optimal and probably 1000 feet is best.
Perhaps LTO survivor can comment.
Perhaps LTO survivor can comment.
He did.
The models are wrong. 4 wells per mile are optimal. The resource is there but the bottom hole pressures is not !!
LTO survivor,
A mile is 5280 feet so 4 wells per mile implies 1320 foot spacing is optimal, is that correct? Correct spacing in feet would make it crystal clear.
Only 4 wells a section at best. This could go up to 6 if prices were $150 per barrels and CAPEX stays low otherwise the party is over. 🎉
LTO survivor,
So you disagree with the research at JPT suggesting 1000 foot spacing is best? So your wells are spaced at 3300 feet or when you say 4 wells per section do you mean spacing of 5280/4=1320 feet?
I have asked this before, how do you explain the horizontal rig count increasing and the frac spread count increasing?
If the party was indeed over, I would expect the opposite.
1400 feet apart still yield 74% of the parent well.
Lto survivor,
This is confusing, you say 4 wells per mile is optimal (I think that works out to 1320 foot spacing), but 1400 foot spacing gives 75% of parent well. What if wells are drilled and completed as a group and first flow is within weeks for a set of 12 wells on a 3 mile by 2 mile group of leases (6 sections)? I would think that might solve the downhole pressure problem and might maximize output? Expensive though at 120 million.
LTO Survivor,
so the drainage area is 320 acres for wells with a two mile lateral. What is the EUR of those wells compared to the USGS estimate of 167 kbo per 100 acres? I guess that the USGS estimate might be realistic for the top tier areas only.
Toby,
USGS estimates about 70 Gb for 49 million net acres for all of the Permian areas studied (Spraberry, and Wolfcamp formation in Midland and Delaware basins), that is an average of 143 kbo per 100 acres. In my model I assume 9000 foot lateral by 1050 foot spacing or about 220 acres per well, that would suggest an average of 315 kbo if the Permian were fully drilled in a very high oil price scenario (say 200 per barrel). For the revised scenario I presented around 5:30 pm on 6/29/2021, which has 42.7 Gb produced from 121 thousand wells completed after December 2017, average EUR is 353 kbo per well or about 160 kbo per 100 acres.
It’s not a matter of wells per section, it’s a matter of lateral overlap, which completely kills any incremental output. Maybe you could get 4 wells initially but once they start producing there is no gain to adding more than one well in a given area of overlap.
Toby,
I have read that the average lateral length in 2019 for the permian basin was about 8500 feet, I do not have access to this data at shaleprofile.com. I have also read at JPT that optimal spacing for Permian wells is about 1000 feet on average. That would give us a well that is on average about 200 acres. My estimate of average 2019 Permian EUR is about 420 kbo over 221 months at $75/bo for WTI. My model assumes new well EUR starts to decrease starting in Jan 2020 and for a TRR scenario (which either ignores economics completely or assumes very high oil prices through 2050 (say similar to the EIA’s AEO high oil price scenario) we would have the 50 million net acres in the USGS studies (Spraberry, Wolfcamp midland, and Wolfcamp delaware) divided by 200 acres or 50000000/200=250k wells, the scenario for the Permian basin above assumes about 162k wells are completed from Jan 2010 to April 2041, the maximum monthly completion rate is assumed to be 624 new wells completed per month and that rate occurs from June 2026 to November 2033. The maximum completion rate to date was 521 wells per month in April 2019. The recent completion rate has been approximately 350 new wells per month (or that is what I use in my scenario to match model output with the output data).
Note that I do not agree with the 350 kbo EUR estimate. Also the last data I hve on Permian productivity per lateral foot has a peak in 2019. See Permian update published in Dec 2020. Chart at link below
https://shaleprofile.com/wp-content/uploads/2020/12/Productivity.png
post at link below
https://shaleprofile.com/blog/permian/permian-update-through-september-2020/
In every case from 2016 to 2019 my well profiles underestimate cumulative output vs shaleprofile data, for the 2019 well profile cumulative output at 18 months is 189 kbo and at 27 months it is 226 kbo. At shale profile blog the most recent Permian data has cumulative output at 18 months at 199 kbo and at 27 months it is 235 kbo.
Note that my well profiles were estimated over a year ago based on limited data. It is a pain to update so I do it on occasion, but basically my well profiles have been on the low side, which may explain why my models tend to underestimate Permian output from 2010 to 2021. As to future output, we can only estimate/guess based on a number of assumptions. In the past my assumptions about the future have invariably been too conservative, that is I have always tended to underestimate future output.
I do not know if that pattern will continue into the future.
Also in the past Ron Patterson and many others have doubted my future scenarios, always thinking they were absurdly high. They have always missed, but on the low rather than the high side. The exception has been the pandemic, I did not see that coming, but I was not alone.
Wolfcamp wells do 400kb eur spaced 1 mile. A 70gb EUR means extrapolating the current prime acerage to the entire wolfcamp.
USGS never claimed anything like that except to demonstrate and the obvious recovery is going to be like 10gb and production will collapse by 2025.
Mark,
No the USGS has different estimates for different benches of the Permian basin. The 70 Gb undiscovered technically recoverable resource simply ignores the economics. When reasonable economic assumptions are applied to the mean USGS TRR estimate, the URR is approximately 46 Gb with about 120 thousand total horizontal tight oil wells completed from 2010 to 2037. We do not know if the USGS mean TRR estimate is correct, I simply use it as a best guess starting point.
You’re assuming 100% of reserves are recovered which is silly. Permian recovers 30% which is 10% for the shale part.
This is really basic, obvious. If you’re saying 100% of reserves are recovered you’re just proving how easy it is to say dumb things.
Obviously you don’t care but anyone can see how bad every field besides Permian is and shale is over
Mark,
Seems you are basing things on analysis of conventional resources.
The USGS mean estimate for TRR of Permian basin is 75 Gb with a 90% conficence interval of 44 to 114 Gb for studies published in 2016, 2017, and 2018. I base my model on the mean estimate of 75 Gb and get 46 Gb URR for 1000 foot spacing and 40 Gb for 1320 foot well spacing and an average lateral length of 8500 feet (based on 2019 average lateral length).
OOIP for permian tight oil is about 1800 Gb, recovery would be about 2.6%, if it is 46 Gb as in my best guess scenario.
see https://www.beg.utexas.edu/tora/challenges
For Bakken/Three Forks tight oil resource OOIP is about 300 Gb, with my best guess URR of about 8.5 Gb, so about a 2.8% recovery rate, fairly close to the Permian basin.
I see you blocked replies. But in any case your argument is silly enough to speak for itself.
Replies only go a certain number of levels. Reply all you want, use copy and paste.
The trillion barrel numbers are obviously kerogen.
There’s 1 quadrillion barrels of dirt in the Permian.
10% is rock.
10% of that is organic content.
Then 2T of that is soluble bitumen and 5% becomes light tight oil.
Then of that 100B oil 10B is left to extract, which is why rig productivity is falling so hard.
This is just really basic petrophysics, there’s no other way things would work.
TORA stands for Tight Oil Resource Assessment, based at the University of Texas, Bureau of Economic Geology.
The TRR assessment for the Permian is 179 Gb, quite a bit larger than the USGS assessment of 75 Gb, so about 239% larger than the TRR estimate I use in my models.
Screenshot from page linked below
https://www.beg.utexas.edu/tora/challenges
The University of Texas must have hired someone from Saudi Arabia to make that assessment. 😉
Rolling on the floor laughing my ass off.
Dennis,
And where did TORA pull out the 10% recoverable number from? I mean, everything does depend on that one number, doesn’t it and it seems so round and base 10 on top of it.
Did they do detailed analysis to understand it and arrive at an estimate? I mean it could very easily have been 6.325835%, no? But no, it is a round fat 10%. Hard to believe that the 10% is the right number.
I think TORA pulled that tight oil recoverable % estimate from their tight a$$es. That number should be treated like the $hit it is. Don’t build your models based on such a stinking piece of data.
Corrected scenario using corrected Permian scenario from 6/29/2021, 5:32 pm
note that this scenario uses a revised non-Permian tight oil scenario based on a similar oil price scenario as was used in the Permian scenario, the previous scenario used a slightly lower non-Permian tight oil scenario based on lower oil prices.
I’ve worked often with Enno Peters over the years, since the beginning of shaleprofile.com, actually, to help him with TRRC reporting, etc. I am very fond of his work, and of him personally. He came to one of my drilling locations once; how cool is that? From the Netherlands ! He actually knows what a rig looks like and we showed him dozens of stinking shale oil wells, even a frac in process. His software code and algos are way beyond my comprehension but, after using other data services, have learned to trust his, the most.
I am unclear how you are now using shaleprofile.com raw data, provided by Enno (?!) to make your own charts. The chart below is from his Analytics Service and clearly shows at current conditions, including price, a consistent, current rig count, decline, RR factors, terminal decline, etc. he estimates by 2030 the entire Permian tight oil play will be producing < 4.1MM BOPD.
Your chart(s), if I am using the right one ( they change every hour), shows that the Permian will produce something like 9.5MM BOPD. I am unclear, by the way, why the EIA data that tracks your chart, created in 2019, is even relevant. How in the hell did you know about – $36 oil prices, < 135 rig count in the Permian and freezes in Feb. of 2021 in Texas…in January 2019?
5.4MM BOPD is a big difference between you and shaleprofile.com. You are clearly using some of this raw data, and much of your conjectures about prices, remaining drillable locations, etc. to make your model, but appear to be giving shaleprofile.com full credit, I assume to give yourself credibility? Have you cleared all this with Enno? I would think Enno would be upset that you are altering his data, over 7 years of big work, and your work is so different than his. My take on that is it might negatively affect his credibility and the marketing of his various products going forward. I hope that is not the case.
At the risk of offending a member of the community named Greenbub, or something like that, that thinks I am the most "difficult person, ever," I would like to also say that just because you read it on the internet doesn't make it true. Engineers (that serve the shale oil sector) can be dumbasses about lots of things, including spacing, the USGS is a government sponsored entity designed to create abundance security and simply determines the amount of POTENTIAL TRR in various shale oil benches in the Permian per square mile, irrespective of oil prices (you should perhaps read the definitions of TRR), yes, lots of shale oil operators "think" that there is more shale oil than normal people do, it does not mean its right, if you knew who this LTO Survivor person was you'd realize how how much you are embarrassing yourself…and lets see, what else?
Oh yeah, all of us in the actual business of producing oil and gas in America are scared to death about regulations. NO sector of our industry is more terrified of regulatory compliance and their associated costs than shale oil. So when you dismiss people like Shallow Sand, and Rasputin, concerned about how all that might affect America's oil future, you, and the rest of your anti-oil comrades all ask if it has happened yet, or declare it won't happen for political reasons, you all appear dismissive, arrogant and dumb. Its very disrespectful of the entire industry. If we're concerned, you fellas ought to be terrified.
Past results in the oil business are not indicative of future performance. It IS a business and we have to make money or we don't survive. The American shale oil phenomena would have been over 8 years ago, (because it has never made money) but for unlimited credit/debt. It did not make money at over $70, now its racked with debt and it will not make money at $70 now. If it does it will be at the expense of its future. A RRR of <100% will be its ultimate death. BTW, why use Brent oil prices to analyze the US shale oil phenomena? Phfttt.
Lastly, why is all this shit so important anyway? At the moment over 80% of all Permian Basin tight oil is being exported to foreign countries because of its quality and because we cannot use it in America. That will not change and not much of this is really going to help the American consumer in the long run. All the debt the shale oil industry is racking up (and it still IS racking it up), however, is a mortgage on our children's future.
Thanks for the comment Mike.
A clarification. Some of the charts are for all US tight oil (peak around 9.5 Mb/d) and some are for Permian basin (peak about 6.6 Mb/d). Enno assumes no increase in completion rate, it remains at 270 new wells per month from June 2021 to Dec 2029. My scenario is very different and assumes the completion rate increases to about 542 new wells per month (roughly two times the level of Enno’s scenario). Note that this 542 well level is the equivalent level of 2019 average Permian wells, I assume well productivity has fallen to 87% of the average 2019 well by June 2026 when this completion rate is reached, actual wells completed is 624 which has the same output as 542 average wells completed in 2019. Enno assumes no change in well productivity in his supply projection, I have assumed here that the average 2020 and 2021 wells have similar output to the average 2019 well
I agree that Enno does awesome work.
I will ask Enno if it is ok to put shaleprofile on my charts, in the past he has asked that if I use his data, he would like credit. The shaleprofile data is used to develope well profiles, I also use the shale profile well completion data, and output data for the entire basin. the future projections are my own.
Enno clearly states that his projections assume no future change in rig counts, I assume the rig count and completion rate will increase over time to a maximum completion rate of 624 new wells per month. If I use similar assumptions to Enno’s supply projection(270 wells completed per month) I get about 500 kb/d less than Enno’s projection in Dec 2029, 3779 kb/d for my model vs 4312 kb/d for Enno’s model. As I often say, my well profile assumptions are quite conservative, despite what many seem to believe.
Enno often mentions that the assumption of no increase in future rigs is likely wrong, I agree with him.
If we treat the Permian basin as a single project operated by one large theoretical oil company from 2010 to 2050. The cumulative net revenue in 2021$ would look like the chart below. I assume a well cost of 7 million 2021$ in Jan 2010 increasing by 33,333 dollars (2021$) each month until reaching $10 million in 2018 and then remaining at that cost into the future in fixed 2021$.
This is based on the scenario with a URR of 46.5 Gb that peaks around 2030 at 6600 kb/d. Interest rate on debt is assumed to be a 7.5% annual rate. Cumulative debt is paid back by August 2023 for this scenario which assumes the Brent oil price rises to $80/bo in 2021$ by Dec 2021 and remains at that level (on average) until 2033, oil the price declines linearly to $59.6/bo in 2021 $ by Jan 2050.
Nobody needs to be embarrassed. We totally thought of drilling 8 wells per bench per section/2 sections with 2 mile laterals. We still believe the original oil in place numbers. The resource exists but it all comes down to physics. The pressure depletion we originally thought was limited to a drainage area and that each new well would have close to original bottom hole pressures. What we found is that the rock while very tight has been made more permeable by the massive fracks, hence the the bottom hole pressures are way down from the Parent wells. This also means the the GOR is rising in the Permian Basin and we are seeing this all over the basin. Unless someone can figure out how to repressure this massive reservoir, the production charts above can’t possibly be correct. I believe that’s why we are seeing flat production despite the reduction of DUCs and increased frac spreads. I have been advocate of filling back the reservoir with dry gas which will probably be done one day and the gas could come from the Alpine High Gas field once the liquids have been stripped out.
Thanks LTO survivor. Note that my model assumes 1000 foot spacing with 9000 foot laterals, so for a one mile by 2 mile plot, (2 sections), that would be 5 wells for 1280 acres. The model could assume fewer wells, such as 4 per 1280 acres. Would that make more sense? In other words is optimal spacing more like 1320 feet in your view? The model can be adjusted with input from those more knowledgeable than me, but the knowledge is often not shared.
Ron said 4 wells per square mile, but it sounds like you are saying 4 wells per 2 square miles or 320 acres per well (10560 by 1320 feet). Or we could take average lateral length of 8500 feet and assume average spacing is 1320 feet which would be 258 acres per well. That assumption would reduce the number of wells in the model to 190k from the earlier model estimate of 238k wells for the TRR estimate of 75 Gb, note that when the economics is applies roughly half of the 238k wells are not completed (only about 120k wells completed in the scenario from 2018 to 2040). ERR is about 46 Gb (61% of the TRR).
Have you ever tried 1000 foot spacing or do you know of others who have tried it?
Just trying to learn from the pros.
Yes we did I totally and it was a disaster. There was a section called the dominator that Concho drilled I believe with 8 wells per section or something like that and the results almost tanked the company.
Going to try a model with the 258 acre per well assumption (190 thousand total wells after Dec 2017 for TRR scenario). Will take a bit.
Each of the watermelon hearts in both Permian sub-basins are being over drilled. As the oily gentlemen are trying to explain, pressure depletion is well underway. Gas desorption is leading to rising gas to oil ratios and declining liquids productivity per well per lateral foot, the correlation evident beginning in 2017. The USGS did not foresee this when it made its lofty predictions of POSSIBLE resource recovery years ago, “technically” speaking. Mother Nature is now having Her say. Unless you can find an economic way to re-pressurize the entire, say, Midland Basin, that problem is NOT going to get fixed. Its going to get much worse.
So, much of that hypothetical USGS stuff is going to get left behind, stranded, immobile. Stuck. I don’t quite understand why that is so hard to accept. It was a wild ass guess to start with.
And so, your next model needs to be away from the heart(s) and out toward the rind. Goat pasture. Where well productivity will be less, costs higher, economics even worse. S. Korea and China will be interested in these models; they don’t care how deeply America gets in debt and how fast we drain the remainder of our oil resources, they just like cheap Permian Basin imports.
All this HZ tight oil stuff is going down hill now; a few more years will do it. MUCH higher oil prices, sustained over a long period of time, might delay things, but not long. In the end there’s never messin’ too much with Mother Nature.
So, much of that hypothetical USGS stuff is going to get left behind, stranded, immobile. Stuck. I don’t quite understand why that is so hard to accept.
Thanks, Mike. Hell, I don’t find it hard to accept at all. 😉
Thanks Mike,
The USGS studies were completed from 2016 to 2018 (three separate studies). The range in estimates was 44 Gb to 114 Gb for TRR with a mean of 75 Gb (when we include cumulative production plus proved reserves as part of TRR, Undiscovered TRR was about 70 Gb for mean estimate). Model below (line with no markers) reduces TRR to 60 Gb and assumes oil prices rise to $80/bo for Brent (assume $75/bo for WTI) at the end of 2021 (in 2021 US$), oil price remains at that level until 2033 and then declines linearly to arounfd $60/bo in 2050. About 120 thousand wells are completed in the scenario from 2010 to 2034, well cost in 2021 $ assumed to remain at $10 million per well from 2018 to 2034 when the last well is completed, royalty and taxes at 28.5%, discount rate assumed at 10%, interest rate at 7.5%, OPEX about $13/bo (2021 $) over life of well on average, all debt paid back by 2024 for scenario.
Do you have a rough guess for Permian basin TRR? Does the USGS F95 TRR estimate of 44 Gb also seem too high?
Thanks.
Click on chart for larger view,
Dennis, what is the cumulative tight oil Permian production? Do you have that number?
I am quite certain you would find most producers/operators in the oil business don’t care much about “undiscovered, technically possible, resource recovery at some unknow, future oil price.” Most of us are just trying to survive another day.
I sure don’t care. As I have said, I think this sort of USGS stuff is not helpful, confuses an already confused public, creates the false illusion of abundance and in the case of these estimates in the Permian, led directly to such empty rhetoric from politicians as “limitless oil supplies, energy independence, Americans not needing to conserve oil anymore,” the use of American shale oil as a foreign policy tool, and worse, the Drain America First campaign.
Just because it might be ‘there’ does NOT mean its every going to see daylight.
Okay, I did the math and got just under 7 billion barrels cumulative tight oil production for the Permian. That means that 17. 5% of Permian oil has been produced and they still have 82.5% or 33 billion barrels left to produce.
Are you kidding me?
Thanks Mike,
Just trying to come up with a reasonable estimate. I do not think the concept of peak oil is well served by continually underestimating future output.
My estimates simply take published knowledge, attempts to make reasonable estimates of future well completion rates and EUR and see how the scenario plays out. If oil prices remain at $80/b from 2022 to 2033 (say the average oil price over this period will be around $80/b in constant 2021 $) then tight oil output would rise if the USGS mean estimates are correct. As always I may be wrong, in the past I have been (always wrong by being too low rather than too high).
Chart has well completion rate assumed for scenario in right axis, obviously this is a guess with zero probability of being correct.
Chart is small, click on it for bigger chart.
Ron,
I am just making my best guess, same as you. When I push back on the claims by the experts, they point to pressure depletion and rising GOR. Both are expected, that is physics, you remove fluid from a formation, pressure decreases, not unexpected.
The GOR in some plays is higher than others, Eagle Ford higher than Permian and Permian higher than Bakken/Three Forks. For all plays the GOR rises over time as expected.
The estimates I make for World crude plus condensate output are not very different from those of Jean Laherrere, though my methodology is different. Output will depend on both unconventional output (tight and extra heavy oil) and extraction rates from conventional resources. My models assume extraction rates that are historically low. Did you see Enno Peters projection from Feb 2021 where 300 oil rigs in the Permian basin was assumed? That gave output rising to 5500 kb/d by 2029. The oil rig count from May 2017 to March 2020 averaged 390 in the Permian basin, I expect that would be a more realistic number. Rig efficiency (wells drilled per rig per month) has improved over the 2017 to 2021 period so even if rigs only increase to 390 we would see higher well completion rates than 2017-2020.
I would also note that no aternative estimate has been given by the pros. Simply that they don’t like my estimate.
I would note in 2015 when you last predicted the peak, the tight oil boom was well underway. We disagreed in that case as well, I thought the peak would be in the future, around 2025. That was before the Permian USGS estimates (published in 2016, 2017, and 2018) were available and I was underestimating future tight oil output badly at that time (expecting about 12 Gb to 15 Gb of output from Permian basin).
When I get new information I adjust my thinking.
Also the USGS estimate for the Bakken/Three Forks in 2013 has proven to be very good. I expect North Dakota Bakken/Three Forks URR will be about 8.5 Gb from a TRR mean estimate of 11.5 Gb (about 74% of TRR will be produced).
If the Permian does as well as Bakken/Three Forks and the Permian mean TRR estimate is as precise as the Bakken/Three Forks, then we might see a URR as high as 75*0.74=55.5 GB for the Permian basin. My current best guess is 46.5 Gb/75 Gb=62% of the mean USGS Permian TRR is recovered. My 68% confidence interval for Permian basin URR would be about 40 Gb to 53 Gb, with an equal chance it would be either higher or lower than this range (16% probability it would be lower tahn 40 Gb and a 16% probability it would be higher than 53 Gb.)
Dennis, The Bakken, since 2010, or pretty close to the beginning of the shale boom, has cumulative production of almost 4 billion barrels. So your estimate of 8.5 Gb is not too far off. A little high perhaps, I would guess 7 Gb.
That raises a question. If the Bakken has produced about half its URR, why has the Permian only produced about 15 of its URR? Both basins began the shale boom at the same time. And both basins are having the exact same production difficulties right now. Something just doesn’t add up here.
https://www.aogr.com/uploads/content/w10-2_fig_2.jpg
Any well overlap pretty much totally destroys any output in the overlapping area. There’s no gain in spacing wells closer than the lateral length which is currently about a mile.
Ron,
Permian tight oil boom started about 5 years later than Bakken/Three Forks. In October 2018 I thought the Permian URR for a mean TRR guess of 36 Gb would be about 24 Gb. Then the assessment for the Delaware basin Wolfcamp and Bonespring formations was published in November 2018 and I revised my scenarios based on this new information.
The sum of undiscovered TRR (70 Gb) plus cumulative output and proved reserves at the end of 2017 (about 5 Gb) goves a total Permian basin TRR of 75 Gb for the mean (best guess) estimate.
For the Bakken Three/Forks the TRR estimate was about 13 Gb in 2013 (includes North Dalota and Montana) nearly 6 times smaller than Bakken/Three Forks in total. If we compare Permian to North Dakota Bakken/Three Forks the difference is about 6.5 to 1 (75 Gb vs 11.5 Gb). If we took your 7 Gb guess for North Dakota Bakken/Three and multiply by the ratio of Permian TRR to ND Bakken/TF TRR (6.5) we would get a rough guess of 45.5 Gb for Permian URR (not much different from my 46 Gb estimate.)
LTO Survivor,
many thanks for the explanation!
Is this the reason that well productivity per lateral foot has declined over the past years or is the worst yet to come? If this affects the entire basin we could see a huge decrease in well performance over the next years. Can you provide some data regarding well EUR and break even prices? Thanks!
Best
Toby
Toby we are still figuring out the EURs but at these prices we are anticipating a 70% + IRR and 1.85 times our money back on and NPV basis. The IRRs are very good but our location count has shrunk dramatically.
Thanks LTO survivor,
So that chart from the JPT (see below) is completely wrong, interesting. Can you tell us what you believ the optimum spacing for maximum profitability per acre would be?
In one place you say 4 wells per mile and I think in area terms you might mean 4 wells per 2 square miles (approximately) which would be 320 acres per well, can you confirm this?
If the USGS mean TRR estimate for area were correct (and note that I am not saying that it is) this would imply 49 million acres divided by 320 acres or about 153 thousand total wells completed after 2017 for a very high oil price scenario. I could run that scenario to see how it looks.
Toby,
My estimates for average Permian EUR for each year from 2013 to 2019 in kilobarrels are as follows:
161, 204, 279, 376, 379, 412, and 422. I assume EUR starts to decrease in Jan 2020, by June 2034 when final wells are completed, my model has average EUR at 271 kbo, for 40 Gb URR scenario, with TRR assumed to be 60 Gb (roughly an F70 TRR estimate based on the USGS studies.) So perhaps a 70% probability that TRR would be higher than this 60 Gb estimate based on the studies by the USGS (which experienced people have suggested are incorrect).
My guess for Permian URR would be 12 Gb. 7 down and 5 to go.
Come on Ron,
PDP reserves plus DUCs are probably more than 5 GB even if half of the DUCs in the Permian were dead DUCs. Rigs count is rising. That´s absurd.
Yeah, rig counts are rising, slowly, and production is still flat. But you may be right, I could be off a little on the downside, but I would bet my bottom dollar I am not nearly as far off on the downside as Dennis is off on the upside.
If my prediction is absurd, Dennis’s 40 Gb is even absurder.
Is absurder a word??? 😉
Ron,
Proved reserves plus cumulative production is about 17 Gb as of Dec 31, 2019. About 11 Gb of proved reserves, likely there are another 5 Gb pf probable reserves, that brings us to 22 Gb.
That assumes possible reserves and contigent resources are zero (which is unlikely). The F95 TRR estimate is 44 Gb, using that I get roughly 27 Gb, that would be a likely minimum URR, best guess remains 46 Gb.
Dennis, those estimated reserve numbers are appearing to be a very poor guide to what can be produced. The best guide as to what can be produced in the future is what is happening right now in the shale patch. And several guys who are actually drillers are telling you exactly what is happening right now. And you are totally ignoring them. You are telling them: “But, but, but, the USGS says all this oil is still down there.”
You said in a post above: I do not think the concept of peak oil is well served by continually underestimating future output.
Dennis, it is not my job to serve the concept of peak oil. All I am trying to do is explain what is happening right now. Yes, I have been wrong in the past because I did not anticipate the shale oil boom. Neither did you or anyone else I know of. But that sentence of yours I quoted totally explains your motives. You are so afraid of being wrong about the coming peak that you are making really wild and extravagant predictions about future oil production, not just for the USA but for the world as well.
But this time Dennis, it is you who are wrong. The production decliners have finally overtaken those who are still increasing oil production. Russia tipped the balance. The USA and Saudi Arabia will soon add to the imbalance.
That is where I stand. And if I am not serving the peak oil concept to your satisfaction, so be it.
Don’t worry about offending me. I enjoy and learn much from your comments. Plus, I think you are right. Also rude, though.
Rude to Dennis, which I sometimes regret. Old and impatient with bringing a half century of experience here, in hopes of helping, only to be ignored and lectured by many who’s knowledge of the oil business only comes from the internet. You’ll actually see the same frustration I feel from others, if you wish to actually look.
Its hard, oil and gas production; we’re a proud lot and don’t much like outsiders telling us we’re wrong, or can do it better.
The Maloob Zapp complex in the Bay of Campeche, BTW, contains fixed production facilities; the fire that USA Today, for instance, so dramatized, was a pipeline rupture, not a blowout, and was contained within hours. Stuff happens in the oilfield.
Mike , understand how you feel specially when you come from the ranks . Keep plugging and correcting . The doctor is not your friend .
Thanks Mike,
I try not to lecture, I am trying to explain my reasoning so where I am wrong I can be corrected. I am grateful you have taken the time to correct me where I have been mistaken as I have learned a lot.
I agree is possible the USGS estimates may be too optimistic, perhaps they got it right in the Bakken and wrong for the Permian basin. The Permian TRR estimate from TORA is much larger than USGS estimate, about 179 Gb vs 75 Gb.
See
https://www.beg.utexas.edu/tora/people
also see the challenges tab at page above with OIP and TRR estimates.
Dennis,
I have just looked up the USGS assessments for the Midland basin and they have a potential pruductive area of 4.1 million acres for both the Wolfcamp A and B, 4.2 million for the Spraberries and more than 5 million for the Wolfcamp D in their calculated mean estimate.
Looking at data from shaleprofile we find that production in the Midland basin is concentrated in Midland, Martin, Howard, Upton, Glasscock and Reagan counties – combined acreage is around 3.9 million acres. There are also some spraberry wells in a very small part of Andrews. Note that some areas in these counties might not be productive, such southwestern Upton and eastern Howard and Glasscock. The core area of the Midland basin is therefore probably less than 4 million acres, maybe only around 3 million. So I doubt that all the acreage the USGS mean estimate will be drilled.
The most productive wells are drilled in Midland and Martin counties and productivity in the other counties is much lower (I looked at wells completed in 2018 and later). We might see well productivity declining faster than predicted in your scenarios.
Best
Toby
https://www.oilystuffblog.com/forum/forum-stuff/pressure-depletion
Toby,
I am using the acres for all of the Permian basin assessments (there are 3).
They estimate that there are about 49 million net acres for the mean case.
It is certainly possible that the USGS assessment is incorrect. Note that my most recent scenario has TRR at 60 Gb, roughly midway between the F95 case (44 Gb) and the mean case (75 Gb). About 120 thousand wells are completed for that scenario and a well area of 258 acres is assumed for the average well completed from Jan 2018 to July 2034 (when last well is completed in the scenario). Only about 31 million acres (of 49 million total net acres) are utilized in my 40 Gb scenario (based on 60 Gb TRR), leaving 18 million acres that are not profitable to develop under the economic assumptions I have made.
Note that there is always a mix of good wells and bad wells, the counties with the poor productivity will have very few wells completed there ( they are part of the 18 million acres I assume are never developed.)
In any case it is all speculative, the USGS may be completely wrong as some oil pros say. Time will answer this question. Note that there are some oil pros that think my scenarios are absurdly pessimistic. They just post in other venues, not at peakoilbarrel.
Note that there are some oil pros that think my scenarios are absurdly pessimistic.
Dennis, you completely forgot to post your smiley face after that sentence. You should be more careful. Some people just might think you are serious.
Ron I am serious.
See
https://peakoil.com/forums/viewtopic.php?p=1472736#p1472736
There have been others, such as Rocdoc at peak oil.com and some at Oil Price.com as well.
Everyone has an opinion, when I disagree with a pro I ask questions, not to say they are wrong, but to find out what I can learn.
A response of we don’t think about that much, tells me that perhaps a micro focus does not always lead to the correct answer.
Dennis, I knew you were serious. My post was pure sarcasm.
Sorry, I forgot my smiley face also. 😉
Clearly, macro fixating on the subject of tight oil does not make it correct, either.
I don’t recall anyone here on POB IN the oil business saying they consider themselves, “experts;” its interesting how you have crafted that dialog at peakoil.com.
The one common denominator I have always noticed about people able to put a few initials behind their name is that they more often than not consider themselves on intellectual high ground. Odd, that.
Pressure depletion is indeed simple physics. The problem with pressure depletion in unconventional tight oil containers is that nobody was able to predict its rate of increase. That’s led to exaggerated EUR’s, impairments, loan defaults, bankruptcies, employment volatility and dangerous myths about abundance.
Now as you wander down the aimless road of determining how much USGS TRR there is left in the Permian, out toward the watermelon rind, how will you predict the rate of pressure decline in THAT rock. Because if you can’t, its sort of all meaningless.
Mike, as compared to Dennis and me, they are experts. That doesn’t mean they know everything, only that they know one hell of a lot more than Dennis or I. They are the ones putting their own money in the game, many millions of dollars. If they are not experts I would bet you my last dollar that they do consult those whom they believe to be experts. So I have no damn reservations about calling them, experts.
As to pressure depletion on out toward the watermelon rind, of course, it is a guess. But it is an educated guess. And of course, before they drill they will get all the expert advice they can find.
Mike,
I don’t claim to be an expert. I believe I referred to you an Lto Survivor as professionals. That is you make your living in the oil industry. It impliies that I think that you know more than me.
Sorry if that somehow offended.
“some … think my scenarios are … pessimistic. They (do not post) at peakoilbarrel”.
Just so, Dennis, and good for you for attempting to be both open minded and rigorous in applying honest – as best your available data enables – analysis on future hydrocarbon production.
As one Permian producer upthread has accurately noted ” … the rock has been made more permeable by massive fracks”.
This situation is graphically depicted in Liberty Oilfield Services just-released presentation detailing ongoing efforts (and methods) to minimize/eliminate exactly these unwanted events.
Although I do not follow Texas developments closely, I strongly suspect the geology in both the Permian and Anadarko basins is continuing to pose difficulties in ‘cracking the code’ for frac geometry management. When this is achieved, re-pressusurizing the rock will become the province of EOR which, itself, is making enormous strides in improvement.
Bakken completions in the Middle Bench are very different from the Three Forks horizons, similar to NE Pennsylvania employing different approaches than those done in SWPA.
You are correct, Dennis, in projecting higher recoveries in the coming years.
Dennis , not my domain, but seems an overestimate > History beckons .
https://www.theguardian.com/environment/earth-insight/2014/may/22/two-thirds-write-down-us-shale-oil-gas-explodes-fracking-myth
Hole in head,
Very old news from 2014. The Monterrey estimate was based on a very poorly done study commissioned by the EIA, it was not an estimate by the USGS.
I agree the Monterrey estimate was way too optimistic. It has never been included in any of my models, which estimate zero barrels of tight oil from California.
“The Monterrey estimate was based on a very poorly done study commissioned by the EIA, it was not an estimate by the USGS. ”
I know it was done by an outside agency but EIA signed off on it . As they say ” If you break it then you own it ” . Further how can we be sure that the University of Texas is better resourced to do the study for tight oil . Anyway , it is immaterial . The latest post by Ovi indicates a flat production inspite of higher prices , increased rigs and fracs .
The EIA just posted March world oil production. It’s up 1,899 kb/d from February. The two biggest contributors to the increase were the US, 1,401 kb/d and Russia, 150 kb/d.
Also the API has reported that US crude inventory dropped by 8.15 M bbls.
That increase was just a recovery from February’s bad weather month where both Russia and the USA were hit very hard. So it stands to reason that they would recover the most. However, we are still below January’s numbers.
In looking for a big future increase in production what I am not seeing are comments from the service and drilling companies to say that activity is picking up. In fact I’ve seen the opposite – Petrofac and a couple of the big offshore rig operators have said things remain fairly quiet; and the actions of Wood group and lack of gung-ho announcements from Schlumberger and B-H (and the continuing fading away of Weatherford) would back that up.
Iran power cuts fuel fears in Iraq as scorching summer peaks (bold mine)
Iran halted its crucial supply of power to Iraq, fueling fears of protests Tuesday amid instability following the resignation of Iraq’s electricity minister.
Provinces across the country’s south — where temperatures currently average 50 degrees Celsius (122 degrees Fahrenheit) — are shortening working hours citing extreme heat.
A call for protests in the oil-rich province of Basra, often the stage of power-related demonstrations, was distributed across social media giving the government until 6 p.m. Tuesday to restore power.
“Or else we will escalate and all of Basra’s streets will be cut off, and we will teach the officials a lesson they will never forget,” it said.
Outputs from four cross-border electricity tie-lines from Iran to Iraq were at zero on Tuesday, according to Ministry of Electricity data seen by The Associated Press.
The impact has been immediate.
In Basra, the province requires 4,000 megawatts but is currently receiving 830 MW. “It is a catastrophe,” said al-Maleki.
Note that URR-models doesn’t take events like these into consideration. That is one reason I think URR-models only can be seen as an upper bound, not the most likely scenario.
Iran’s New Record High Electricity Consumption Hard To Explain
A new record high in electricity consumption has caused serious concerns in Iran over outages. Officials blame summer heat and intensive illegal cryptocurrency mining.
The Associated Press reported Tuesday that Iran has halted electricity exports to Iraq, a development that has worried Iraqi officials as it increases chances for renewed popular protests.
Pollux,
For the World I look at average annual output, there will be ups and downs at various locations, but in general, except in the case of World Wars, Global pandemics, or Global economic depressions, typically bad stuff does not happen in all places simultanreously.
I look at historical rates of development of oil resources and output of oil and global discovery data and model future discoveries based on the best estimates of World URR. Future rates of development are assumed to be similar to the past and future extraction rates are also assumed to be similar to the recent past with an eventual decline in extraction rates as the World transitions to other sources of energy. There is no doubt the scenarios of the future will be wrong, it is a statistical impossibility for any one out of an infinite number of possible futures to be correct. Obviously it is not impossible as the future will occur. The probability of anyone predicting the future correctly is zero, it does not really matter which model it is, any model will be wrong. Mine have always been too low in the past. The future could be different.
Iran Grapples With Major Oil Worker Strike
Oil and petrochemical workers from 60 companies across eight Iranian provinces are now on strike demanding higher wages and better contractual conditions, Iran International reported, adding that the strikes have been intensifying since last week.
The oil industry is essential for the Iranian economy, which might lead to a fast resolution of the workers’ grievances. The situation might escalate further if this does not happen.
It has been stated, on this list, that the cut in oil production due to the pandemic, is simply oil saved that can be produced later. According to this Oilprice.com article, the exact opposite may be the case.
Russia Is Struggling To Boost Oil Production
By Irina Slav – Jun 29, 2021, 9:30 AM CDT
Russia is having trouble reversing an oil production decline it implemented under its agreement with OPEC+, Reuters writes, citing unnamed sources.
According to these sources, Russia has been producing some 10.42 million bpd of crude oil and condensates since the start of the month, which is lower than May’s average of 10.45 million bpd.
The reason for the decline could be related to difficulties with boosting production at older fields, other sources, also unnamed, told Reuters.
There was talk about such difficulties as early as last year when OPEC+ first agreed to take some 7.7 million bpd off the market in response to the demand destruction caused by the pandemic.
“Mass sealing of oil wells is a much more serious thing than short-term idling” in the Russian climate conditions, according to oil industry executive Evgeny Kolesnik, who spoke to Bloomberg in May 2020. “It’s by far not a given that after a well has remained shut-in for so long it will pump at the same levels as before.”
Initially, the report noted, when Russia had joined OPEC members in their production control efforts, its oil companies cut a relatively small portion of production, slowly, and for a few months only. In 2020, these companies were asked to cut much deeper and much faster, as well as for much longer.
With such long production suspension, there is the risk of never being able to restart some of the wells. The longer a well sits idle, the more likely pressure changes become, as well as water content changes capable of rendering the well unusable ever again.
OPEC+ is meeting later this week to discuss the next steps in its production control agreement. Early reports said the cartel was mulling over bringing additional supply online from August in response to the fast rebound in demand.
Ron. We have firsthand experience with this.
I assume much of Russia’s production is waterflood with a high ratio of water to oil. If the water stops moving for more than a short time, the production may not fully return. That’s been discussed on this forum for years.
Likely why Russia fights production cuts.
Shallow sand,
Is it apparent which wells are likely to suffer this fate? I would think and operator would know which wells are likely to have a problem and not shut in those wells. Is a potential solution to just flow the wells more slowly using chokes or does that not work. I would think Russia could have simply stopped completing any new infill wells or delayed any new field start ups and natural decline would have given an adequate cutback. It is unclear how large OPEC producers manage this problem.
Dennis.
I really don’t know the makeup of Russia’s oil production. So my comments are just guesses.
I have read that Russia has many waterfloods. That would not be surprising given the age of its fields.
Like us, I assume there is a high water to oil ratio. Likely 10-100+ BW for every BO. When you shut in a high water cut well, you also eliminate that much water being injected back into the producing zone.
Waterfloods can be complicated. A lot of sands are not continuous nor of consistent porosity and permeablility. An injection well may not increase the downhole pressure of the wells immediately offsetting it, but instead will hit a well more than one location away. We have wells that produce almost nothing but water, but if they go down it hurts oil production of other wells in the flood. Things also change over time. We bucket test wells annually and have produced water increase or decrease in wells over time. Not radical changes, but it does happen.
Our wells are all on rod pump. I think most of those older wells in Russia are also.
Again, there is probably someone reading this who has better info on Russian production.
Thanks for the information.
I was thinking you probably know the wells in your field and which ones, if any are less likely to have problems when shutting them in temporarily. I am sure it is very complex, perhaps even moreso in the very large Russian fields, but I also imagine they have pros in Russia that know their field as well as you know yours. This doesn’t mean there will not be problems or surprises, but a knowledgeable operator will try to minimize those I would think.
Interesting to read everyones comments.
It is clear that we are somewhere in the peak oil decade, globally.
And the next stage is oil supply decline in the setting of a rapidly expanding population.
I don’t hear much talk about what comes next.
How will the rationing pan out (other than simply by purchasing power- as is always the first layer of rationing)?
Which countries will be the first to suffer economic contraction, and how will this change their geopolitical and economic relationships?
What oil intensive uses will people give up first, and second?
Will people simply stop traveling miles, or will they switch propulsion mechanism?
Will some countries buck the trend and actually come up with rational energy policies to improve their outcome chances?
Well, United Airlines is going to feel very silly ordering 270 new airliners, that’s for sure.
Hickory,
You bring up points I am very curious about as well. Who gets the oil that is left? What rules will governments enforce? How will people respond to lack of oil availability? Will we just let the markets run their course, or will we attempt to intervene? What shortfalls will renewables make up for, and what shortfalls will we be stuck with? Will the world respond to these limits in a positive manner or a destructive manner? How long will the process of adapting to lack of oil take? Will we see a return of people to agriculture to make up for lack of oil? Will we decide to go to war to secure what is left? Will we see a spiritual awakening as people come to understand their connection to nature and the limits of this world? Will society bend, or will it break?
Personally, I am very excited to learn the answers to these and many more questions. The decline of oil will surely be a momentous time in our history, and all of us here who are aware of what is happening are privileged to get front row seats to the show.
Indeed Niko.
These kind of questions are the big ones, and so many basic things about the way the world is organized will get shaken up if/when oil declines quickly.
And it seems as if we will see the whole shortage story just start to unfold this decade.
The jostling in the S China Sea over the last 5 years is just a prelude.
Here is one of the questions I can answer simply- “Will we see a spiritual awakening as people come to understand their connection to nature and the limits of this world? ”
No. If anything, people/countries will likely behave even more poorly when facing energy poverty. A few people may conduct themselves with grace, but not many.
I do think some countries will try to fight their way out of their constraints. If Venezuela was located in the S. China Sea you could guarantee it would be war over control of the oil assets. As is stands, the US will have trouble controlling itself from moving on Venezuela if domestic oil falls off quick.
There are countries with high oil import dependency and a big military- China, India, Pakistan, Korea, Japan, Turkey, Germany. Many on the list sound familiar from a previous time when oil scarcity was at play (1930’s)
Many countries will face internal social unrest or even fragmentation as the gap between haves and have nots becomes more severe. Watch the price of food- http://www.fao.org/worldfoodsituation/foodpricesindex/en/
Some countries are more fragile even though they are relatively well off- I would put the US high on that list. I don’t know the internal dynamics of other countries well enough to give any intelligent rank of this kind of risk.
I am very curious to hear other people speculations on these issues.
Even simple things may change- bananas may a become a rare treat for those outside the subtropics.
You will know things are desperate when the government confiscates your photovoltaic system (or oil well) output.
Hey people, read this article. It confirms what I have been saying for years. That is Saudi Arabia is blowing smoke about their proven reserves. That is, it is all total bullshit.
How Much Oil Can Saudi Arabia Really Produce?
By Simon Watkins – Jun 22, 2021, 7:00 PM CDT
For decades, the true numbers relating to Saudi Arabia’s level of crude oil reserves and production have been a subject of much debate and confusion, not helped by the obfuscation from the Saudis over precisely what these numbers are. The reason for obfuscation is that Saudi Arabia’s only source of real power in the world begins and ends with its oil reserves and production, so the higher these numbers, the more the power, and the lower the number the less the power. In recent weeks this debate has become even more pronounced in the run-up to Saudi Arabia’s latest bond offering and in the debate oversupply and demand in the oil market over the remainder of this year and beyond. As detailed below, much of what Saudi Arabia has said about its oil reserves, current production, and likely future production is an exaggeration made for the purposes of self-aggrandizement but despite that, the numbers have increased somewhat compared to where they were 10 years ago. To begin with the claimed crude oil reserves numbers: these have been a work of stunning bravado and almost complete fiction since 1990 when the Kingdom suddenly increased the official number from 170 billion barrels to 257 billion barrels, despite absolutely no new oil discoveries or improvements in recovery rates being made, as highlighted in my last book on the oil markets. Shortly thereafter, Saudi Arabia increased its official crude oil reserves numbers again, to 266.4 billion barrels, a level that persisted until a slight increase in 2017, to 268.5 billion barrels. Over the same period – in fact, from 1973 to last month – Saudi Arabia has pumped an average of 8.162 million barrels per day (bpd). Taking just the 30-year period from 1990 to 2020, this means that Saudi Arabia permanently removed 2,979,130,000 (around 2.98 billion) barrels of oil every year from its fields, a total over that 30-year period of: 89,373,900,000 (about 89.4 billion) barrels. Using the original number of crude oil reserves would have meant that Saudi Arabia’s reserves would now stand at around 81 billion barrels, placing it around eighth on the list of countries by crude oil reserves ranking. Instead, due to the exceptionally fortunate – and equally mystifying – unilateral hike in the reserves numbers by Saudi itself in 1990 (the numbers were not originated or corroborated by any independent source, mark you), Saudi Arabia has somehow been able simultaneously to remove 89.4 billion barrels of oil permanently from its fields whilst actually increasing its crude oil reserves numbers by over 87 billion barrels. Given, as mentioned, that during this time there were no new oil discoveries made – indeed, there was declining production over this period at many of Saudi Arabia’s core fields, including Ghawar – this is a mathematical impossibility.
There is a lot more to this article, but you will have to click the link to read it. The rest of the article talks about Saudi’s actual production capacity.
During 2020 the top 4 importers of oil (China, United States, India, South Korea) accounted for 53.7% of the overall value of imported crude petroleum purchased on international markets. Next highest on the list are Japan, Germany and the Netherlands (totaling 61%).
Some of these seven have very little domestic energy sources, especially S.Korea, Japan, Netherlands and Germany (ex coal).
On a continent basis, Asian countries bought the highest dollar worth of imported crude oil during 2020 with purchases costing $391.9 billion or 57.4% of the worldwide total. In second place were European nations at 25.4% while 13.2% worth of crude oil imports were delivered to North America.
Combined, Lat America, Africa and Oceania accounted for 4% of global oil imports.
I believe this data refers to net oil imports, but I could not confirm this.
Reuters-
India is expecting to reach pre-Covid fuel consumption levels by the 4th q 2021 , according to oil minister Dharmendra Pradhan’
“India, the world’s third-biggest oil importer and consumer, imports over 80% of its oil needs. Asia’s third-largest economy has been hit hard by a spike in global oil prices, with its tax-heavy retail prices of gasoline and gasoil touching record highs.”
“Inflation is a challenge to the globe today …so we are also facing this challenge in our economy. But with all these challenges we are confident by the end of this calendar year we will be in a position to restore our original consumption behaviour,” Pradhan said.
Of course this will not happen ever according to some self-anointed experts.
Hicks , a copy of an earlier post . Just for your info .
“Pilot , I have provided this info earlier but maybe you missed out so once again for your rethinking and coming to an appropriate conclusion .
India ; Total population 1300 million (1.3 billion )
50 million rich and ultra rich : Own the house + vacation home in the hills for summer . Vacation in Europe /USA or any other exotic place to talk about . Kids in Yale, MIIT, Oxford . Cars for each family member with chauffer . Brands BMW , Mercedese , Lexus .Clothing Armani/ Versace . For health problems prefer to go to USA . Drinks only Scotch or Fosters beer (Aussie) . They cannot create demand like the 1% in USA . Saturated .
100 million upper middle class : Own the house but no vacation home . Vacation in Singapore , Bangkok, Dubai, Maldives . Kids in the best college of India . Cars for the parents and mobike for the kids . Car brands Hyundai, Suzuki . Clothing high end local brands . Health care in private hospitals . Drink best high end Indian brands . Comfortable . Not much aspirations and so no additional demand . House Full .
200 million lower middle class : Own house but mortgaged . Car but with a car loan . Vacation domestic only . Kids in medium level college but aspire to be in the best college . Clothing local . Skinch on health care to save for the future . This is the aspirational class . They want a better lifestyle and a better future for the kids . They want a car for their kid , an A/C in each bedroom and other goodies . Unfortunately the 35 million (add 20 million of the first wave , total 55 million) who got downgraded from the “lower middle ” to the ” upper poor” . The rest of the 150 million have gone into absolute saving mode fearing that the same future awaits them . Zero demand creation .
150 million migrants with no fixed address . They keep moving from village to city and city to city . These are vegetable vendors , food stall vendors, daily labourers . Only survival mode .
800 million (60%) already explained above .
Yes as you said “all want cars and other modern conveniences. ” , the problem is the aspirational class is dying . The living standards are falling and not rising . Increased inequality .
That is why energy(oil ) demand will remain flat ( cars/trucks already on the road will burn gas/diesel) or decrease in the future . Growth in energy demand is a no .no .
Some info off the point . Capacity utilisation of industry is at 65 % since 2018 . No demand indicating lower living standards . The poor cannot even buy kerosene for cooking and now scavenge for wood or use cowdung cakes .
The truth ,nothing but the truth . ”
I said “That is why energy(oil ) demand will remain flat ( cars/trucks already on the road will burn gas/diesel) or decrease in the future . Growth in energy demand is a no .no .”
I saw your many posts about the collapse of India.
And I know you lived there.
And as a fellow human I recognize the poverty in India as as tragedy beyond comprehension.
Nonetheless, in regard to macroeconomic issues I choose to rely on those with expertise, rather than just the most severely pessimistic view of things.
The growth engine (and energy demand) of India has not gone into permanent reversal.
Maybe some day later.
For now, more and more import of oil and gas and coal is the road they are on.
Hicks , “Maybe some day later. ”
Ok , will do . Be Well .
Shale’s 400% Rise in Frack Crews Not Enough to Boost Output
By David Wethe June 22, 2021, 3:14 PM CDT
Even a more than 400% jump in the number of fracking crews working the U.S. shale patch isn’t enough to send oil output soaring. In fact, it’s just enough to keep production relatively flat this year, according to Primary Vision Inc., which has tracked data on frack crews since 2013.
After an 85% tumble in the number of crews completing wells during the depths of the pandemic, the figure has steadily recovered over the past year. It now stands at 235, up from 45 on May 22, 2020. That could grow by roughly another 6% to 250 crews by year end, Scott Levine, an analyst at Bloomberg Intelligence, wrote last week in a report.
But because of the way well production decreases over time, the jump in crews is only enough to keep output flat, rather than boosting it.
“Operators are still focusing on getting out of 2021 with a little bit better managed expectations and better hedge profile,” Matt Johnson, chief executive officer of Primary Vision, said Tuesday in a joint webcast with Bloomberg Intelligence forecasting the pressure-pumping market. “Where is that relative to the actual production? We’re pretty close to managing it at this point.”
Because shale wells see steep declines early in their life of production, the U.S. oil market requires more wells to be drilled and completed in order to replace them and hold output constant. After dramatically turning off activity last year due to history’s worst crude crash, the oil service companies had to ramp up frack crews in order to get new production back online. The mantra among shale’s biggest explorers is to keep output relatively flat this year and send profits back to shareholders.
Ron,
An estimate of 250 frack crews by years end is very conservative, it is likely to be closer to 300, maybe even 320 by Dec 31,2021.
Trouble is brewing .
https://oilprice.com/Energy/Energy-General/Goldman-Sachs-Oil-Markets-To-See-Deficit-Of-5-Million-Bpd-By-End-2021.html
Or is it a case of ” blow hot blow cold ” .
https://oilprice.com/Energy/Crude-Oil/OPEC-Fears-Significant-Oil-Glut-After-April-2022.html
US April production is down 19 kb/d from March. Onshore L48 is up by 80 kb/d. GOM down 92 kb/d. Complete report on Saturday
In not too distant future all US companies which include all the US oil majors. Will have to report their net carbon emissions. And those who offset those emissions with carbon credits will get access to cheap capital. What known as Blue carbon credit are the best IMO and they are things like mangrove forest. Those companies that fail to offset carbon emissions won’t get access to cheap capital.
Some of the oil majors are already doing this. Because cheap capital trumps the cost of carbon credits. Cheap shit made in China and sold by amazon and walmart will also have to be accounted for and carbon offset through the purchase of carbon credits. This will be inflationary for prices on everything.
FED is playing with fire here. I expect them to reverse coarse and raise interest rates before inflation really gets out of hand. If prices are allowed to go too far the house of cards can come tumbling down while they are doing max QE and interest rates are at zero. So depression with no monetary tools or levers to pull.
I’d stay very cautiously long oil due to supply strains and be ready to exit at any time if needed.
HHH, how much can they rise?
To stop this emerging Inflation of 5-8% at the moment you’d need at least a rate of 5%, if not more.
This would kill everything faster than the inflation. The FED has painted itself into the corner – they can’t rise (beside symbolic) and they can’t not rise.
I see no good end – when they rise to stop inflation we get a deflationary crash (all zombie companies get destroyed in short time, creating a bank domino rally), if they don’t rise your scenario of hyperinflation plays out.
In any case, it’s good to hold no money and have not too big debt.
The only thing they can do they do at the moment. They are talking the inflation down – they talk about temporary, they talk about tapering and raising on a long time horizont – but they don’t DO something.
Think about it again: Without QE and with a big inflation at the horizont, 10 years should crash now, their rates should reach at least 6-8% in this crash. This may not happen – for example for fracking companies and other junk bond junkies that would take them to 20% bonds. Credit will dry out, stocks will crash, too. Game over.
Crude Hits Highest Since 2018 on SA Russia Proposal
Reuters reported that Saudi Arabia, OPEC’s largest producer, and Russia are working on a proposal to raise the group’s output by 400,000 barrels a day from August, and by the same amount every month through the end of this year. That would lifting output by 2 million barrels a day from current levels as of the beginning of December.
https://www.investing.com/news/stock-market-news/crude-hits-highest-since-2018-on-talk-of-saudirussian-output-proposal-2547407
WTI Crude future contract for Aug 2021 at over $75/b as of 11:48 am ET. Close to peak for last 5 years.
US Tight Oil has been absolutely flat for 11 months, except for the weather-related month of February.
The below chart is through May and is in Million barrels per day.
Projection by Enno Peters from February 2021, for Permian basin, where an increase in rig count to 300 by Jan 2022 was assumed and than a constant rig count at 300 until Dec 2029.
Output rises to about 5500 kb/d for this scenario see link below for post
https://shaleprofile.com/blog/permian/permian-update-through-november-2020/
link below goes directly to image
https://shaleprofile.com/wp-content/uploads/2021/02/Supply-Projection-300-rigs.png
below I have a very fuzzy image, had to reduce resolution to get under 50 kb.
Note that the horizontal oil rig count was over 300 rigs from May 2017 to March 2020 in the Permian basin and based on current trend a 300 or higher horizontal oil rig count by the end of 2021 looks very reasonable. The average horizontal oil rig count in the Permian basin from May 2017 to March 2020 was 391. At the current trend that level would be reached in August 2022.
Dennis , rise in number of rigs . Where are they deployed ? Tier 2 ? Tier3 ? Tier 1 is as Mike S terms a watermelon pin cushion . Reminds me of a post here (who , I forget) ” What good are fertile seeds in fallow soil ” .
Hole in head,
I assume they are deployed where the oil professionals think is the best place to deploy them. We will know in the future how productive the wells will be. In my model I assume well productivity decreases with every new well drilled after Dec 2019.
See what you want to see in this chart of USA total energy consumption over time.
One thing I see is a roughly flat high plateau level for the last 20 years.
Peak energy use?
If this peak energy use stays true, then we must realize that a shortage of energy was the not cause- there was no shortage in the last 20 years.
And high energy cost was not the cause- liquid fuels, solid fuels and electricity have all been a bargain for most of the time.
And prolonged depression was not the cause- we have had two abrupt deep recessions that were fairly short-lived.
And it sure doesn’t seem due to a change in behavior. People still do all kinds of frivolous and discretionary activities with energy- fly and cruise and speed and consume with abandon.
I suppose one big part of the answer must be increased efficiency. Most people are driving around in more efficient vehicles for example. New higher efficiency appliances and motors of all sorts, lighting, and building products have gradually been installed around the country.
And maybe casino/sports gambling and video game playing just doesn’t use as much energy as it had been assumed? [sarc- in case it wasn’t obvious]
https://cleantechnica.com/2021/07/01/nonfossil-fuel-sources-accounted-for-21-of-u-s-energy-consumption-in-2020/
Note that your thesis that efficiency has maintained flat energy consumption supports our theory that Jevon’s parodox operates in reverse during the contraction stage of oil extraction. See https://link.springer.com/article/10.1007/s41247-016-0016-6.
In their discussion they say ” If extraction rates fall precipitously and remain low for 2 years, one can expect a price spike followed by a drop in prices which decimates first industries which use oil followed by the oil extraction industry and a recovery will be highly unlikely.”
The price drop they refer to is due to unaffordability of oil, and resultant bankruptcies/business failure, which would then lower demand.
It might not work that way however. It is possible that despite high oil prices to come, that demand will remain high enough from global customers that prices will stay high for a long time. Depends on the rapidity of the changes. Every year that goes by means more and more people with the wherewithal to purchase energy.
Schinzy ,good find . Tks
Some gems from the blog of Mike S .
https://www.oilystuffblog.com/forum/forum-stuff/left-behind
https://www.oilystuffblog.com/forum/forum-stuff/the-duc-s-have-flown-north
To boost the moral, the probability of having a return of La Nina/Neutral Enso state has increased which means less windshear above tropical Atlantic area and more possibilities for tropical phenomena to develop, which increases the probability of disruption of oil extraction at GOM. https://www.cpc.ncep.noaa.gov/products/analysis_monitoring/lanina/enso_evolution-status-fcsts-web.pdf
Russian C+C production fell by 48,000 barrels per day in June. Their OPEC= limits increased but their production decreased anyway.
Russia Oil, Condensate Output Fell While OPEC+ Eased Limits
Russia reduced oil production in June after keeping it almost flat in May, despite more generous quotas from the OPEC+ alliance.
Producers pumped 42.64 million tons of crude and condensate last month, according to preliminary data from the Energy Ministry’s CDU-TEK unit. That’s about 10.419 million barrels a day, or 0.5% less than in May, Bloomberg calculations show, based on a 7.33 barrels-per-ton conversion rate.
Frack tech man makes a case for the O&G industry in the US
https://www.youtube.com/watch?v=1yubV5eqL8U
From Google Translate:
Fire on the Ku Sierra platform in Campeche
A fire is registered 400 meters from the Ku Sierra platform that belongs to the Ku Maloob Zaap Integral Production Asset. The asset is located in the Campeche Sound in the Gulf of Mexico.
The incident also threatens to spread to other offshore oil complexes.
Maybe George could comment on this?
Volcano growing, like Paricutin in forties.
Lava seeps.
https://en.wikipedia.org/wiki/Parícutin
It has been ended by closing valves.
My call , World C+C peak at 84,631 mbpd Nov 2018 . US peak C+C at 12,866 mbpd Nov 2019 . Any dissidents (excluding Dennis ) ?
A new thread reporting on April US oil production has been posted
https://peakoilbarrel.com/us-april-oil-production-flat/
A new open Non-Petroleum thread has been posted.
https://peakoilbarrel.com/open-thread-non-petroleum-july-3-2021/