The EIA STEO was published recently, the estimate for World C+C output from September 2024 to December 2025 in the chart below is based on crude oil estimates in the STEO for World minus US C+C output and the trend in the ratio of the STEO crude estimates and C+C estimates from the EIA’s International Energy Statistics for World minus US C+C output for the most recent 48 months (September 2020 to August 2024).
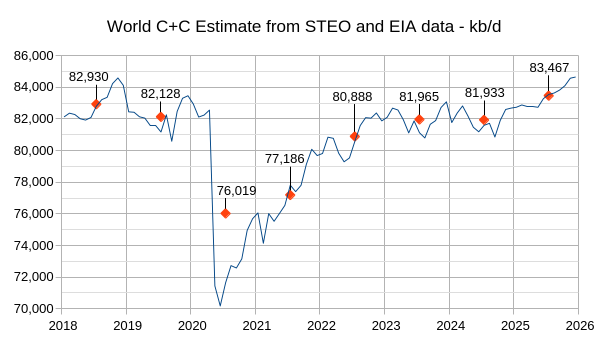
In my view the estimate for World C+C annual output in 2025 (83.47 Mb/d) looks optimistic, I expect World C+C will average about 82.5 Mb/d in 2025 about 600 kb/d higher than the 2024 estimate, which appears reasonable.
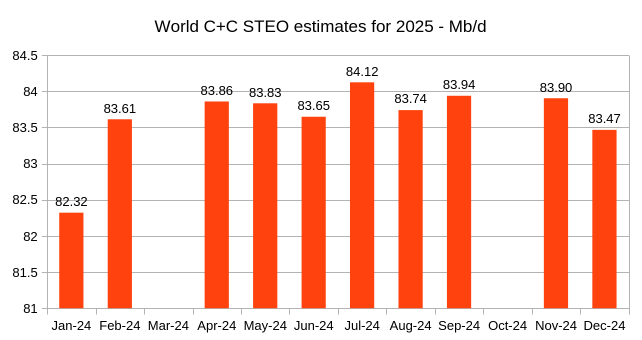
The chart above shows how the STEO estimates for annual output have changed from Jan 2024 to December 2024. If we throw out the Jan 2024 estimate, which is significantly different from the other 10 estimates, the average is 83.79 Mb/d with a standard deviation of 197 kb/d. If we assume that the probability distribution is Gaussian then we expect 95% of the data would fall between 83.4 and 84.2 Mb/d. Note also that decisions by OPEC on future quotas have changed over the past 11 months and this affects the STEO estimate. The decision by OPEC to delay the future ramp up in output from Jan 2024 to April 2024 likely dropped the STEO estimate for December.
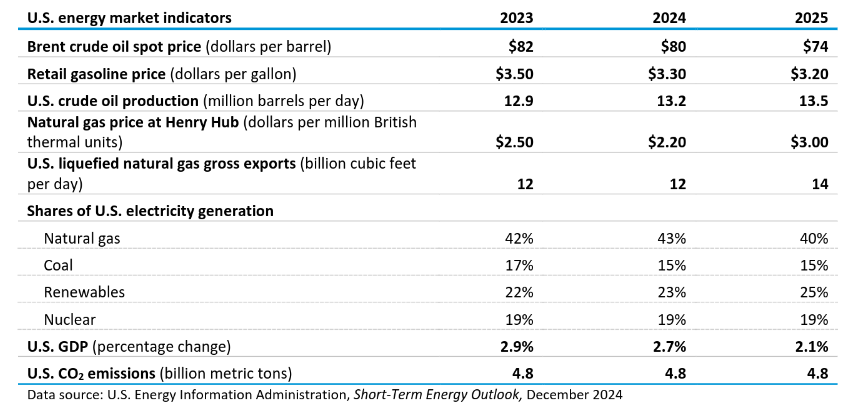
The Brent price has been revised lower by $2/b compared to last month’s STEO and the price of natural gas has been revised higher by 10 cents per MCF, the estimates for US crude oil output and US LNG exports are both unchanged from last month.
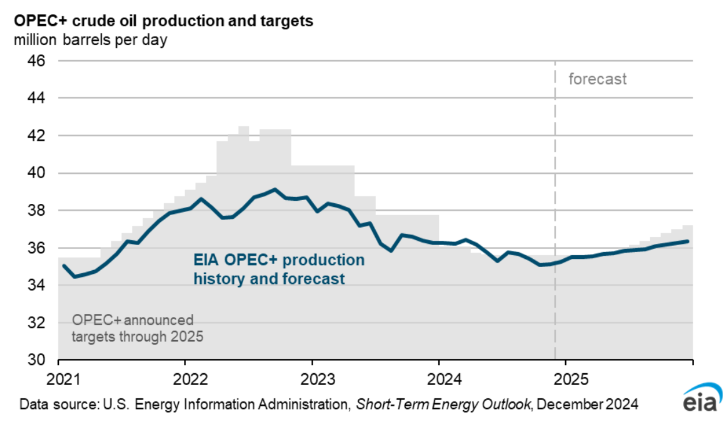
The chart above reflects the delay in OPEC output increases to later in 2025 and shows what the EIA expects for OPEC output in 2025, which is slightly below the OPEC targets for the second half of 2025.

Most of the 1.6 Mb/d increase in World liquids fuel output in 2025 is expected to come from countries that are not part of OPEC+.
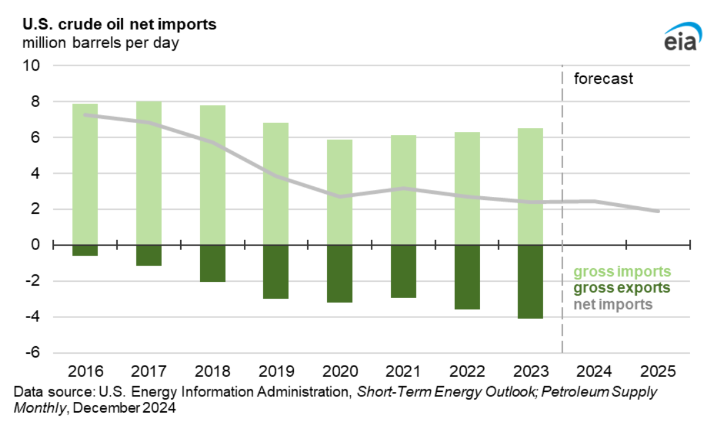
US crude oil net imports are expected to fall below 2 Mb/d for the first time since 1971.

US Jet fuel stocks have been falling since mid 2024 after rising over most of the period starting in Jan 2022, Jet fuel stocks continue to decrease through 2025.
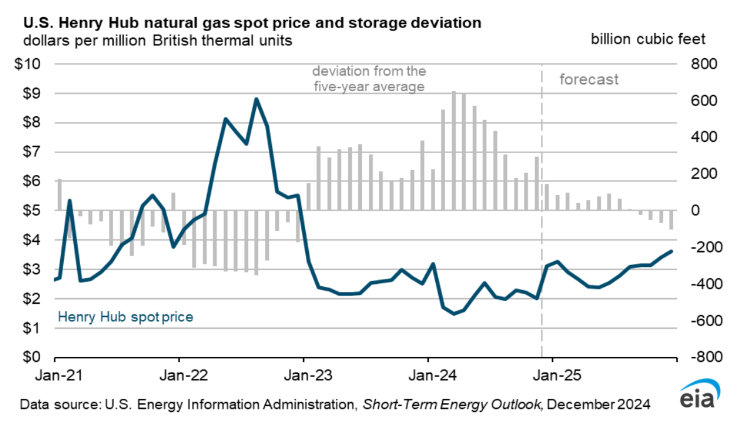
Falling natural gas stocks in 2025 result in generally increasing natural gas prices in 2025.
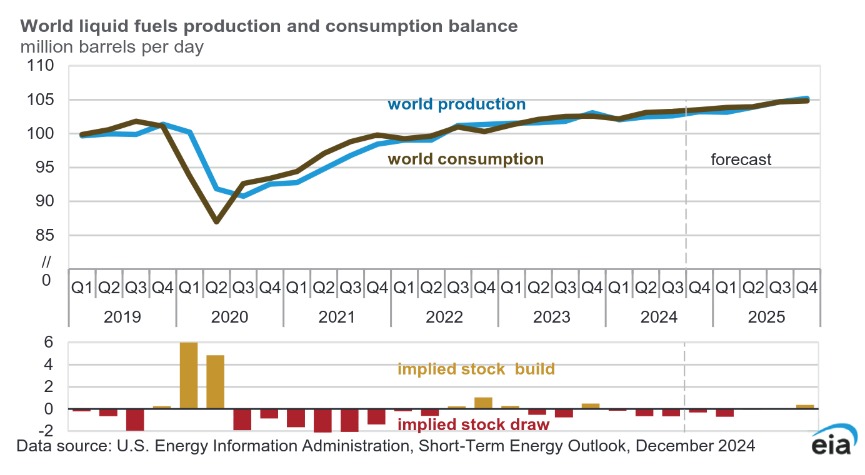
World crude stocks are expected to decrease in 2024 Q4 and 2025Q1 with a small stock build expected for 2025Q4.
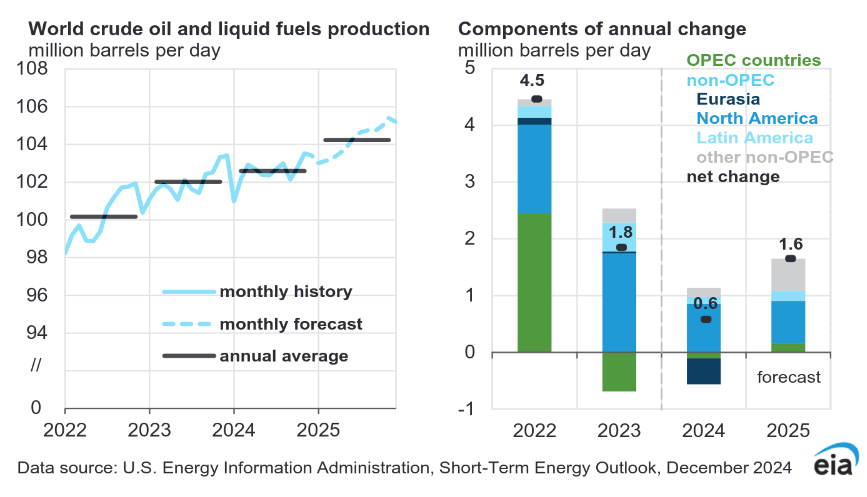
The chart in the right panel above gives some indication of where the increases in liquid fuels in 2025 are coming from. The other non-OPEC increase is about 500 kb/d with about 130 kb/d coming from Europe, 50 kb/d from non-OPEC Middle East nations, 180 kb/d from non-OPEC Africa, and 70 kb/d from Asia and Oceania.
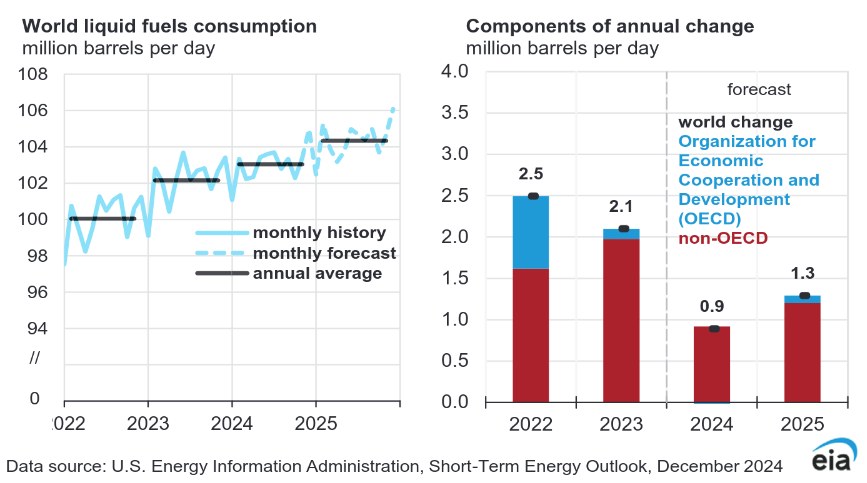
Most of the increase in liquids consumption in 2025 comes from non-OECD nations.

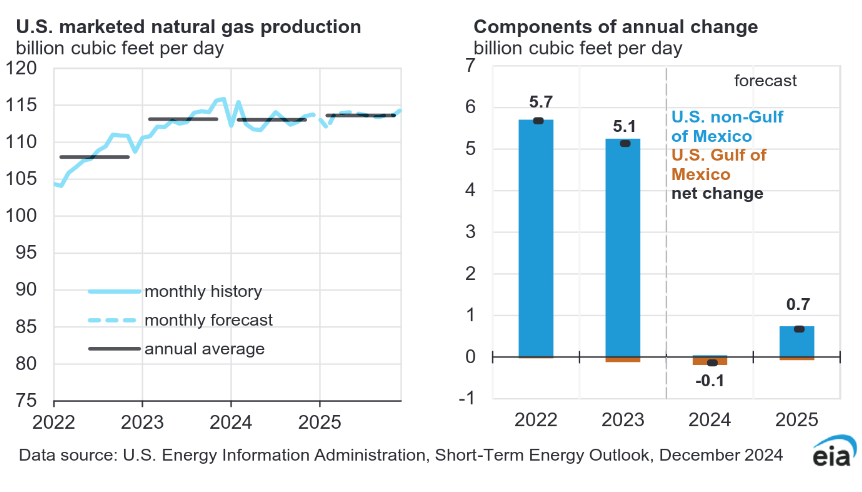
US Natural gas production remains relatively flat in 2025, especially when compared to 2022 and 2023.
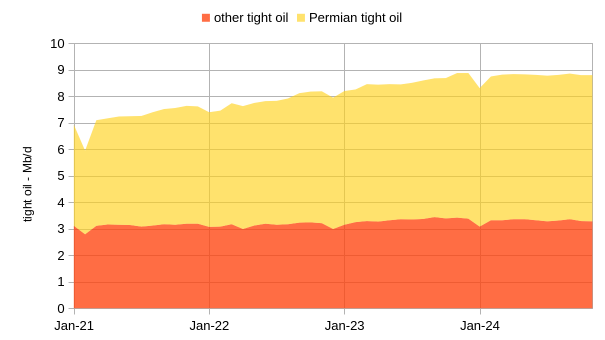
Most of the increase in US tight oil output since 2021 has come from the Permian basin. Notice how flat Permian tight oil looks in 2024 for the EIA estimate above. Below I will suggest this is not a good estimate.

The chart above looks at all US L48 output excluding Gulf of Mexico (GOM), like tight oil most of the increase since Jan 2021 has come from the Permian Basin region (including conventional oil output from this region). Notice how the regional Permian estimate is less flat in 2024 than the tight oil estimate.
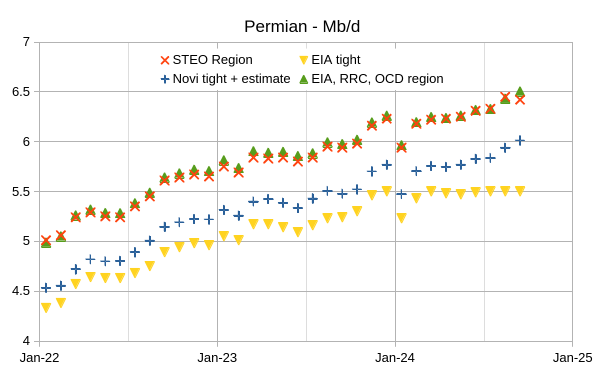
The chart above compares several estimates for the Permian Basin with two regional estimates (the higher two data sets) and two Permian tight oil estimates. The regional estimates compare the EIA STEO estimate for the Permian region with an estimate based on EIA State data for Texas and New Mexico and Permian basin and state level data from the RRC of Texas and the OCD in New Mexico, these estimates are nearly identical. The Permian tight oil estimates compare EIA data with Novilabs data from Jan 2022 to September 2023, from October 2023 to September 2024 I subtract the average difference between the RRC/OCD/EIA Regional estimate and the Novilabs data over the Jan 2022 to Sept 2023 period (493 kb/d) from the RRC/OCD/EIA regional estimate. The EIA leaves out several Permian formations from its tight oil estimate which should be included leading to an underestimate of Permian tight oil output.
Dennis,
Thank you very much for this article.
Am I reading it correctly for 2024 production: flat C+C, but 0.6 kbpd of liquids?
So all liquid growth is from NGL and biofuels?
Do they have a breakdown for total liquids: how much is C+C vs NGL vs biofuels?
Kdimitrov,
They give crude oil output and total liquids, my C plus C estimate is based on the trend of the ratio of crude to C plus C for World minus US, US C plus C is forecast by the EIA, but not for the World, no breakout of NGL and biofuels in the STEO at the World level.
If crude oil and condensate production would be between 70 and 75 million barrels per day by 2050, what would be the estimated production levels of natural gas liquids (NGLs) and biofuels under the best-case scenario?
Omar,
Not known, check the international Energy Outlook from EIA for one view or OPEC or IEA forecasts.
I want approximate numbers of NGLs + biofuels + refinery gain if the crude and condensate are between 70 – 75 mbd in 2050?
Omar,
Doubt there will be much change in biofuels from today, NGL is difficult to guess, it depends on natural gas output. An older model I did 9 years ago for natural gas has NGL about 100 kboe/d higher than 2024 in 2050, about 1.3% higher than 2024 (estimate of about 7738 kboe/d for World NGL in 2024). I haven’t revisited this estimate for some time so it is highly speculative.
Nelow is my current guess based on my C plus C scenario and the older natural gas and NGL estimate with NGL adjusted for lower energy content using barrels of oil equivalent.
Thank you so much
Omar,
Keep in mind that the probability that my scenario is accurate is 0%. For your 72.5 Mb/d estimate in 2050, NGL would add about 7.8 Mb/d so roughly 80 Mboe/d for C C NGL. According to Energy Intitute liquid biofuels production was roughly 1 Mboe/d in 2023. My guess is that it will be a similar level in 2050, if this is correct then total liquids output in 2050 would be about 81 Mboe/d in 2050 for your guess of 72.5 Mbo/d for C plus C in 2050.
Did the predictions of a oil glut pan out?
Jacob,
Oil prices are pretty low relative to 2010 to 2015 so in a sense yes the predictions of an oil glut have proven relatively accurate since 2016, with the exception of 2022 when the War in Ukraine caused prices to rise.
The Rig Report for the Week Ending December 27
– US Hz oil rigs were unchanged at 441. They are down 18 rigs from April 19 and are up 14 relative to their recent lowest count of 427 on July 24th. The rig count has remained in a very tight range between 427 and 442 since July.
– In New Mexico and Texas, the Permian rigs were unchanged at 94 and 193 respectively
– In New Mexico, Lea and Eddy were unchanged at 45 and 49 respectively
– In Texas, Midland and Martin were both were unchanged at 27 rigs
– Eagle Ford dropped 1 to 38
– NG Hz rigs were unchanged at 85
Frac Spread Report for the Week Ending December 27
The frac spread count decreased by 9 to 201. It is also down 39 from one year ago and down by 71 spreads since March 8.
The last time the frac spread count was close to 201 was March 6, 2021 when it was 200 and the frac spreads were rising coming out of Covid.
It is amazing how the frac spreads keep dropping and US production grows.
Dennis and Ovi:
Do either of you have any recent DUC data for the US shale basins?
SS
The only data we have comes from the DPR. That data was reported in the last US update and will be updated in the next one probably around Jan 3 or 4.
There is a lot of controversy around those numbers. In the Permian there are close to 875 DUCs. Mike used to claim there were no more than 100 DUCs.
I think it is a question of how one classifies DUCs. If one considers all the wells that have been drilled and the average time gap of 6 months between drilled and completed, I can see 800 to 900 as being in the ball park in the Permian. Some participants on this site might have been considering Dead DUCs, those that would never be completed. I can see those being in the 100 to 150 range.
Shallow sand,
See
https://www.eia.gov/outlooks/steo/data/browser/#/?v=32&f=M&s=0&start=201901&end=202512&map=&ctype=linechart&maptype=0&linechart=DUCSPM~DUCSEF~DUCSBK
This DUC estimate includes WIP wells which Mr Shellman excludes from his DUC estimate, though in reality the Permian has a monthly completion rate of about 480 wells per month and if we assume WIP is 6 months (480 times 6) it should be at least 2900 wells so the EIA estimate seems too low. Novi labs has much different estimates than the EIA (they are considerably higher), but we can no longer access that data.
Found an old chart from Novilabs and they had Permian Ducs around 3500 in May 2023. This would be about 7 months of WIP wells if it is 7 months from spud to first flow, which seems more reasonable than the EIA estimate recently of 1000 DUCs for the Permian Basin.. Most DUC counts include WIP.
Bottom line is that the EIA estimates are all we have these days since Novilabs stopped making any data available without paying 10k per year and the EIA DUC estimates, especially for the Permian basin are not very good.
From what I´ve read, the Biden (and previous administrations also) promised there would be plenty LNG availible for the world at a reasonable cost in the immediate/short term future no matter what. So Europe bet it´s least smelling shirt, and later the rest of it, at that bad assumption.
But that might have been a major mistake in my view.
Laplander
The best bet the way I see it when it comes to stability, is that transportable energy in the form of oil and gas is well supplied in the global market. There is a “black” market, and has always been, when it comes to oil. The main extrapolator of the current supply situation is technology (AI a part of it) and the ripple effects of this globally. Along with plan A, to expand where possible. We are not done with the expansion model, but probably we are in a plateau phase for oil and by logic a natural gas plateau would come at least 10+ years after that. Natural gas could potentially last for a long, long time; but not necessarily confined to the US.
Ovi: “It is amazing how the frac spreads keep dropping and US production grows.”
Tack on an extra lateral mile of rock facies to hydraulically fracture and this is what you get: stronger initial well production. But it would also appear that a cost in ultimate recovery could be suffered due to earlier and more severe decline in performance. Time will tell whether these three (and even four)-mile laterals is an overall plus, minus, or a draw.
In the early three-mile laterals there was far from an equivalent increase in production. It has been generally believed that this was due to earlier fissure and pore closure in the distal segment. Exxon engineers obviously think they can solve this by using a carrier fluid containing coked petroleum as a far-field diverter to settle into the dendritic distal fractures and prevent long-chain hydrocarbon molecules from plugging up fissures as the pressure drops. In fact, they think this can add 15-25% to well production.
This is going to be an interesting experiment. An increasing problem is that over a million gallons of water are needed to hydraulically fracture each long lateral, and it, along with produced water, has to be disposed somewhere. Many of the Permian disposal wells are over-pressured and costs of disposal are rising. Unless water re-use is revolutionized or oil and gas prices rise (or both), the extra gain from enhanced proppants and more stages could be overwhelmed by rising water-handling costs.
This can go on for quite a while. Long enough to make people start to doubt stark warnings about the shale basins peaking, with a rollover coming soon. It could even quite possibly go on long enough to give Mr. Trump his extra 3 mboepd. But eventually the basins (and even Exxon) will run out of room for 3-mile allocation wells, and possibly also water. In other words, this can’t go on forever.
Gerry,
Thank you, spot on in my view.
Very intetesting, obvious even Exxon need to have a profit after all exspensives are payed. Seems now there also is a challange the LNG production in Permian exeed the capacity in the transport pipe system. Is this related to the wells are getting more gassier as it seems increase in oil production from the us shale was limited in 2024?
Gerry
I just became aware of 4 mile laterals in reporting North Dakota’s production in the upcoming US September oil production update.
Googling 4 mile laterals brought up this interesting tidbit: “For three-mile wells, Chord assumes the third mile is only 80% as productive as the first two miles, Brown said, with a 40% EUR uplift for a 50% longer lateral and 20% more drilling and completion costs.”
I wonder what the productivity of that last mile of the 4 mile lateral will be. If 50% increase yields 80% productivity, how much productivity will a 33% increase yield.
These laterals must initially act like a pressure equalizing channel. All of these random local isolated oil bearing spots must have slightly different internal pressures that would equalize once the frac occurs and oil starts to flow. If the pressure midway down the lateral happens to be higher than the last mile, it would take a while for the oil in the last mile to start to flow. It will be intersting to see how this extra mile works out.
XOM is also experimenting with 4 mile laterals: “Exxon Mobil plans to drill longer, more capital efficient wells in the Midland Basin after a major boost from the $60 billion Pioneer Natural Resources acquisition. Data shows that Exxon is a leading operator drilling 4-mile laterals in the Permian’s Delaware Basin.”
https://finance.yahoo.com/news/chord-energy-goes-long-bakken-160000502.html
https://www.hartenergy.com/exclusives/exxon-shale-exec-details-plans-pioneers-acreage-4-mile-laterals-209060
Ovi,
The longer laterals may be more cost and capital efficient, but overall URR per acre of formation are likely to be lower than with shorter laterals (say in the 7k to 10k region, rather than 20k). Bigger is not always better.
So in essence, if I understand correctly, you get more and/or cheaper/more profit/less loss up front but loose absolute accumulated production in the long run? Doesn´t seem like a long term business plan in my view.
But it reminds me of many other comments here lamenting it, perhaps short term reward is the major factor playing here, and what should be addressed.
Laplander,
Businesses try to maximize profits and in doing so will try to produce oil at as low a cost as is possible, the main goal is to produce money, not oil, just the nature of capitalism.
Evidently Stuart Staniford passed away recently.
https://www.linkedin.com/posts/alexlanstein_sad-news-to-share-with-the-fireeye-family-activity-7254663936036200448-ZnM3/
I was not able to find an obituary. But a little bit of online search shows that he had “met” an African woman online and eventually progressed to meeting physically and marrying. He traveled to Nigeria to do so (I think completed, not sure). Shortly after he returned, he died of malaria.
Almost sounds like a LARP, given the story, but I think there’s enough comments on the LI post, to show it is most likely true.
Thanks Nony,
The posts by Stuart Staniford at the Oil Drum are a big part of what got me interested in Peak Oil, sorry to hear of his passing. My thoughts and prayers go out to his loved ones.
The last peak oil post by Stuart at his blog Early Warning at the end of 2013.
https://earlywarn.blogspot.com/2013/12/oil-supply-update.html
Like many of us, I think he was an oil outsider that provided a fresh perspective.
Oh what a pity. I worked 6 years in Eastern Africa. Our employer instructed us when and where we would have to take Chloroquine.
I remember Stuart for his 2007 article:
Greenland, or why you might care about ice physics
http://theoildrum.com/pdf/theoildrum_841.pdf
In this article, Stuart quoted NASA climatologist James Hansen.
https://www.columbia.edu/~jeh1/
From the posting on Greenland regarding combustion related global warming…unfortunately true and so understated-
“The big risk is that we will set in motion something unstoppable before we see overwhelmingly clear evidence of it.”
It is much more convenient to demonize scientists, rather than for humanity to show restraint.
We don’t do restraint.
“U.S. Shale Is Growing Old. That’s a Problem for Donald Trump’s Oil Plans.”
https://www.wsj.com/business/energy-oil/us-shale-trump-oil-policy-1a001e6c?st=dZxXsn&reflink=desktopwebshare_permalink
What a shocker – I thought the center of the earth was this gooey oil filled ball that was infinite in size…..
rgds
Vince
During 2024 the US deficit was 8% of GDP. Should we believe that will continue on each year over the next 4 years?
If that kinda spending doesn’t continue we go into an economic contraction.
If it gets dialed back to 4% of GDP. We have a problem. A major problem.
Government spending really is the only game in town. Without it increasing at an ever expanding rate the money supply will absolutely contract. Which will lead to forced selling of assets because the demand for dollars to service debts goes up or remains the same. While the supply of dollars contracts violently.
Trump is going to get his $40 oil. But it won’t be a good thing. It will be because the economy imploded.
HHH
That is absolutely correct. There is already a dollar crisis in the Eurodollar market which is the economy. If government spending contracts the dollar shortage will only get worse. As much as the popular movement is a form of isolationism we absolutely cannot survive without imports for basic infrastructure maintenance. Right now we see the dollar strengthening and Trumps moves might take it hyperbolic short term. But the global system will eventually contract into a depression like nothing we have ever seen before. $40.00 oil might be optimistic.
The dollar is up and moving higher because the global economy is in the toilet. Low interest rates in China aren’t stimulus. They are a reflection of a crappy economy in China.
This will feed itself. Because there is a crappy economy. Lack of demand. Fewer dollars will be created which in turn creates more lack of demand and further decline in the economy. It’s a doom loop.
How many countries are down hill from the Chinese steamroller? Brazil is certainly getting hit hard.
My guess on oil is $25. And not only $25 oil but $25 oil that hangs around for awhile before attempting to recover.
Germany is in the midst of layoffs in the auto sector and closing plants. Due to lack of demand. It all can be traced back to energy and affordable energy but we can sum it up as lack of demand. How many other jobs in Germany are directly related to those auto employees maintaining jobs?
HHH,
Trump is not likely to reduce the deficit.
Dennis,
We are adding $1 trillion to the deficit every what is it, every 100 days now? Think that is about right. What is the interest rate on that debt currently?
I’m just going to point out that they need a crisis in a bad way to not only crush what inflation is still left. But also so they can pin interest rates back at zero.
So we are looking at adding another $15 trillion or more over next 4 years. $50 trillion in debt by the end of 2028. That’s if spending continues as is.
If you are a bank and you see the writing on the wall. You’re only going to be lending to your very best clients. Eventually you’ll stop lending to them as well.
When the banks stop lending it’s game over. Tax receipts fall through the floor.
HHH,
2024Q3 GDP was about 29 trillion, 8% is 2.32 trillion per year or 1 trillion about every 5 months. A lot of the deficit is interest payments and those may decrease if inflation abates. Trump’s tariff policy may keep inflation high. Deporting lots of immigrants will also raise prices. Populism is usually not consistent with intelligent economic policy.
The deportation of illegal immigrates will be deflationary not inflationary as we are told. Told as a scare tactic.
While businesses aren’t yet doing mass layoffs, they aren’t hiring. I’ve talked to more than one person who has put in between 80-120 job applications with no luck, no response in most cases. Nobody is doing much hiring.
If you remove 11 million illegals. You also remove the demand those 11 million people generate. The money they spend disappears. All those high priced government subsidies condo units in NYC now need new tenants that aren’t subsidized.
Tariffs will also be deflationary. Watch what the dollar does when you slap a 60% tariff on China.
When the dollar index goes to 150.00 it will be very hard for Europe to import the same amount of shale oil and gas from the US. You’re going to see demand tank.
And as demand tanks because purchasing power has collapsed regardless of where nominal prices are. It becomes a negative feedback loop. It becomes very expensive in dollars terms. And what matters to most of the world is what their currency will buy in dollar terms in global markets.
There is nothing out there that will sink the price of oil faster or harder than the exchange rates to the dollar crashing.
HHH,
I agree the Trump policies will be bad for the economy, it is possible to have economic policy with high inflation and a contracting economy as we did in the early late 70s and early 80s in the US, that might be where we are headed. Most illegal immigrants do not have subsidized housing, that’s nonsense. They do mostly work under the table at lower wages doing the work that most Americans are unwilling to do, deporting these people will leave farmers without workers to harvest their crops and may lead to a spike in food prices, construction costs will also rise as their will be a shortage of construction workers, many service industries will struggle to find workers. Tariffs will be passed on to consumers leading to higher prices.
On the other hand demand will be reduced by removing people from the nation so that will tend to push prices down, also other nations will retaliate with tariffs on US goods which will reduce employment in sectors that export their goods leading to unemployment in those sectors and reduced demand from that unemployment. That effect may be offset by sectors where tariffs protect workers from competition and perhaps leads to increased employment in those industries. Impossible to know the outcome, but my guess is reduced overall economic output in the US with higher overall price level.
HHH
I agree we’re on the cusp of the Great Depression 2.0
The banks don’t trust anyone’s collateral and who would. If iconic automakers haven’t been your best customers then who has?
We’re certainly setup for a stock market and housing meltdown in many countries. Probably a merge of the dot com bubble 2001 and the housing bubble 2008.
AI is all hype the only ones making money with it are speculators manufacturers and implementers. It has some cost savings eliminating jobs as many jobs sitting behind computers are mindless. Which is deflationary. But it hasn’t generated any revenue it’s not productive it doesn’t produce anything but consumes copious amounts of electricity.
The 2008 crises has been painted as a subprime loan issue which isn’t completely correct it was a crisis in confidence by the banks in the collateral they were holding. The same conditions are here now.you simply can’t use depreciating assets as collateral banking 101.The US government as well as every other government are depreciating assets. They can’t work together they never agree they steal from the people. Their infrastructures are crumbling. Sure they can print their own currency and have in the US $100,000.00 note tide to every man woman and child who are themselves up to their eyeballs in debt. That’s a good investment.
It’s going to be an interesting day when everyone realizes that their money has evaporated or simply has become worthless. You can’t eat it or drink it or heat your house with it. Retirement and pensions are all built on mountains of deplorable collateral that will soon implode.
The NASDAQ 100 which includes the AI darlings formed a reversal candlestick on monthly chart in December.
Not the daily or weekly charts. The monthly! Obviously we need confirmation and follow through over next 2 months. But the AI bubble which arguably is holding the entire US stock market up has given cause for concern.
I know the Wall Street consensus says blue skies are ahead for 2025. But reality is in the charts not peoples opinions.
I point this out because it’s one of those things where everyone is on the same side of the boat. Everyone is long AI. When prices drop and margin calls go out. There will be forced selling of other assets in order to meet margin calls.
Things like gold and yes even oil futures contracts where people who invested wisely and are up big on. They will get sold to meet margin calls.
Dennis
I keep reading that WTI is in the $70/b range because a number of experts believe that there will be an oversupply of oil next year in the range of 300 kb/d to 500 kb/d. Looked at the OPEC supply demand scenario and they are not showing such an over supply.
Attached is a supply/demand chart from the current STEO. They are showing an average deficit of close to 94 kb/d. It will be interesting to see if WTI strengthens into the first 3 months of 2024 and OPEC can add barrels in April 2025.
Clearly the market believes that OPEC can pump more. And even the threat/possibility is enough to lower futures prices.
I realize people here go on and on about how OPEC/SA struggles to produce. (E.g. Staniford in 2007. And very wrong in retrospect.) But you might ask yourself the Occam’s Razor question of if OPEC is a cartel that props up price, by electively withholding production (as they say they do, as experts think they do, and as they have over all their history). Or if they are just sneaky sneaky trying to lie and make peak oilers look bad.
Here we think OPEC spare capacity is about 2500 kb/d, I don’t think we will see prices rise much over the next year with oil price in 2025 about the same as 2024 (365 day average for each year). Demand seems to remain relatively subdued.
Nony,
yes and the pressure on futures prices brings down spot prices, as well, as operators pull barrels from storage and hedge them with lower priced futures.
Backwardation thus correlates with destocking (albeit with a seasonal pattern) and increases the supply of barrels. Remember, supply = production+draws. The problem for the Saudis is that higher supply means lower prices.
OTOH, the Saudis like backwardation for two reasons:
1. It makes it difficult for small E&P competitors to get bank credit for production, as the hedging is unfavorable.
2. It rewards “normal” financial investors who would buy futures to generate yield from the stable backwardation: as the futures mature their value increases. The Saudis hate speculators, but they want more of these “normal” investors to buy-in, to lift the overall futures curve.
It appears, however, that the Saudi’s two aims of having higher prices and stable backwardation are somewhat incompatible.
Agreed. The whole term structure of the futures market is correlated because of the ability to time arbitrage (essentially by no more than the cost of storage). (Barring strange exceptions like the filling of storage during Covid and the panic that drove prompt negative, but even spot never went negative.)
So the “cartel cohesion risk” tends to weigh down the whole term structure, but also backwardate it. Or in the other direction, the “war in the ME” risk tends to prop the whole term structure up, but also to contango it.
I think the whole “unable to hedge” is a very easy to make public point (like oil quality concerns), but also overstated. If I’m a producer, I’d much rather have $100/BO backwardated than $40/BO in contango! I am much more likely to drill in the former than the latter.
And I don’t need to hedge, really. There is no law requiring that. Continental doesn’t. The majors don’t.
Oh…and nothing stops me from hedging in a backwardated environment if I want to. After all, the market expectation is the market expectation. Sure, I might lose money on the hedge. But the betting odds (with huge uncertainty bars) are that the future price will decline as shown by the term structure. It’s like betting on a favorite in sports–sure you accept worse odds, but that’s what the market expects to happen. Over time, you’re no worse if you bet on favorites or underdogs in sports. There’s no foolproof system either way. The same applies with oil trading and futures speculation. (And hedging is a form of futures speculation.)
Nony,
small producers often need bank credit to drill and the banks will require hedges that cover the re-payments…
If oil prices are at $100 and prices are backwardated (futures lower, say sloping down to $90 a couple years out), than EVEN IF you are drilling on bank credit, requiring hedges, you just lock in THAT price with hedges. Nothing prevents buying hedges in a backwardated environment. Producers do it all the time. Ignore the CNBC midwit newsreaders!
And you can still drill a butt-ton of prospects with oil at 100 prompt, 95 a year out, and 90 two years out. Of course if prices rise to $150, you won’t get the windfall. But also you don’t have the downside of $50 oil either. That’s endemic to hedging.
The shape of the curve is much less important than the absolute level. $100 and sloping down is much better for producers than $50 and sloping up. This is whether you hedge or just take the risk. You will still put in 100/95/90 or 50/55/60 into the first three years of your NPV model. And the NPV is a lot better with 100/95/90 than with 50/55/60!
Listening to the same Groundhog Day remarks about hedging reminds me of the “crude quality matters” midwits. Same thing of a little knowledge and the thinking how smart they are when they’re not. Who gives a damn if the Mars (medium sour) to LLS (light sweet) diff contracts from $2 to $1, when we live in a world where the baseline itself can easily swing $10$-50 in a year?
I mean if you are a producer would you rather have $100 baselin oil, but only a $1 quality premium? Or have $50 and a $2 quality premium? (Even this is a trick question since the baseline itself, WTI, is ALREADY LIGHT SWEET.)
Nony,
$100/bo is quite optimistic especially given your tendency to think there is lots of oil out there, do you expect a rebound of demand? What about all the excess OPEC capacity. Use a realistic price in your examples like $75/bo with futures curve sloping down to $63/bo, that is the reality today. A bank is going to look at these numbers for a small producer trying to drill a tight oil well and say, find some other bank. The small producers have to pay to get their natural gas out of the Permian or flare it so things are not looking great for smaller Permian producers.
Ovi,
A problem with all liquids forecasts is that they include too many different types of energy (crude, condensate, propane, butane, ethane, ethanol, biodiesel, etc) so the price of crude might not be affected much if the crude supply and demand are balanced while other “liquids” are not, the best guess on crude demand is the crude input to refineries (which may or may not include some condensate, this is a bit unclear). As always the data is pretty fuzzy especially on the demand side.
Over at oily stuff, Mike Shellman makes a number of claims that are not supported by evidence.
https://www.oilystuff.com/forumstuff/forum-stuff/it-won-t/dl-focus
He claims 2019 wells declined much less ( a difference of over 22%) than more recent wells (2022 or later). My analysis shows there has been little change since 2019 for first year decline rates, 2019 about 73% decline in first year and in 2022 about 74%, which is well within normal variability.
Here is the quote as Mike may edit this:
There is no doubt that on an IP90-180 basis Permian wells are more productive than a few years ago and that is because of longer laterals. Not because rigs drill holes in the ground faster. But the bigger they are, the harder they fall and I have shown you repeatedly, with data, that Permian wells that declined 47% in 2019 the first year of production, now decline plus 75% the first year of production. The net difference for the first year may be greater, but the ensuing two years production is dropping like a rock and EUR’s are lower. Why THAT impresses people is beyond my comprehension.
Mike has also claimed the following:
In a few days the TRRC will be publishing October production from operators in Texas. This fella is reporting U.S. production thru the middle of December and declaring records have been “shattered,” once again for the same old tired reasons: resilience, inovation, new technology, greater efficiencies and well, its just all a plumb ass miracle is what it is.
His “data” comes from 34 operators in the US, representing 30% of U.S. production via 914 reports to the EIA. Those EIA guesses get adjusted going foward, whatever…its a little premature to say U.S. production records were “shattered.” The trend thru 2024 was flat (see above EIA data) and maybe not such a miracle afterall. Half of what we saw happened in 2024 occured in the last half of 2023…we should wait to see what October, November and December production looks like, I think.
I pointed out to Mike that his comment that the data comes from 34 operators representing 30% of US production is false. When we look at compstatoil file at EIA (link below) for US L48 about 90% of production from the states surveyed is covered by the 914 survey and 86% of all US lower 48 onshore production. No clue where Mike came up with 30% but it is off b a factor of 3. Mike did not dispute this, he simply deleted my comment.
https://www.eia.gov/petroleum/production/xls/comp-stat-oil.xlsx
EURs per foot of lateral are lower, but overall EURs continued to rise through 2021, might have fallen a bit in 2022.
In kbo from 2013 we have 153, 198, 283, 347, 363, 385, 417, 431, 454, 434 for Permian average EUR. Mike is correct that the increase in EUR is due to increasing lateral length. If we look at EUR per 10k feet of lateral there is a decrease from 2016 to 2022 of roughly 1.74% per year on average.
Correction, Mr Shellman was correct about 30% of production from the 34 Publicly traded companies used in an EIA analysis for well productivity.
My sincere apology to Mr Shellman, I misread what he wrote.
I thought he meant the EIA 914 represented 30% of US output (it is about 90% of states and GOM that are covered by the 914 and 88% of all US output).
See https://www.eia.gov/todayinenergy/detail.php?id=63984
Quote from piece above:
We base our analysis of 34 publicly traded oil companies that produce most of their crude oil in the United States on their published financial reports. Our observations do not represent the entire sector because we exclude private companies, which do not publish financial reports. The included 34 publicly traded companies accounted for 30% of the crude oil produced in the United States in the second quarter of 2024, or about 3.9 million b/d.
Also see this piece from the EIA, also based in part on data from 34 publicly traded companies representing about 30% of US output.
https://www.eia.gov/todayinenergy/detail.php?id=64124#
A problem with the analysis of the EIA in the link above, using productivity per rig, is that there is a 6 to 8 month lag between when a well is drilled and first flow from the drilled well. A proper rig productivity metric would consider production with the rig count from 7 months earlier. This may be what Mr Shellman was saying.
Another interesting piece from EIA on Permian from August 2024.
https://www.eia.gov/todayinenergy/detail.php?id=62884
When we adjust the new well productivity per rig by lagging the rig count by 7 months we get the following (compare with figure at bottom of Dec 23, Today in energy linked earlier). Also note that the November 2022 data is influenced by a fall in DUC inventory over that period which boosts rig productivity, but has nothing to do with actual rig productivity improvements (another flaw with the EIA analysis).
Note that when we compare November 2023 to November 2024 (when DUC inventory was relatively stable) we see an increase in rig productivity in all three basins based on the drilling productivity metrics in the EIA’s STEO (rig count shifted forward by 7 months and crude oil production from newly completed wells).
An alternative way to look at rig productivity is to look at regional C plus C output per active rig with rig count shifted forward by 7 months to account for lag between start of drilling and first flow of output from new wells. The chart below considers Permian region output divided by rig count that is shifted forward in time by 7 months. The spike in this “rig productivity” metric in 2021 and 2022 is due to a decrease in DUC inventory over that period. The period to focus on is Jan 2023 to July 2025 (STEO forecast for October 2024 to July 2025) where DUC inventory is stable. Note the increase in rig productivity especially in the first half of 2024.
> Mike Shellman makes a number of claims that are not supported by evidence.
Dennis have you hold a mirror to yourself ? Most of your work is based on other’s projections like EIA’s and other, which to be frank they don’t have any evidence behind…
Mike’s predictions and assessments of current situations comes from his gut feelings the so called educated guess from his __experience__ in the oil industry for almost 70 years.
Svaya wrote: Most of your work is based on other’s projections like EIA’s and other, which to be frank they don’t have any evidence behind.
That is one of the most absurd statements I have ever read. To claim that the EIA, and others, (I guess others means the IEA), does not have evidence for their predictions is truly absurd. It is their entire business to gather evidence and make predictions. Svaya, if you expect to be taken seriously, then you damn sure need to make a better argument than that.
I made myself misunderstood.
I think EIA doesn’t offer evidence for past data, at least not to the public. So if the current data is fake the projections are flawed to begin with.
As for evidence for future predictions and projections I really think that is impossible, that’s why I firmly say that every projection is baseless and without evidence. Evidence is for things that happened in the past. Or happens in the present.
Since all projection and predictions are without evidence, I prefer predictions based on gut feeling from people who had skin in the game in the industry.
As for Mike his experience of life is the evidence so he doesn’t need to provide anything is like when universities hire people that excelled in one specific field as professors… they don’t need evidence, their life’s achievements is the evidence!
I think EIA doesn’t offer evidence for past data, at least not to the public.
If you find yourself in a hole, you should stop digging. It is more than a little pathetic to say the EIA does not offer evidence for past production data.
EIA World Oil Production
https://www.eia.gov/international/overview/world?src=
Svaya,
Mike does great work, but he also analyzes data to reach conclusions, he doesn’t simply go with his gut, I agree all predictions tend to be wrong whether it is the EIA, Mr Shellman or me.
When I make errors I prefer that others correct me. Mr Shellman has done so often and I appreciate learning from an expert. Though all of my mistakes are mine alone.
Svaya,
Not quite right, I don’t really use the STEO for my projections, though I often compare the EIA’s to my own. I do use historical data from EIA, RRC, OCD of NM, and NDIC of ND and resource estimates by the USGS combined with my personal guess of future prices and an economic analysis informed by what Mike Shellman and Shallow Sand and others have taught me about oil field economics.
I will never know as much as Mr Shellman, but when he is in error (such as the claim the average 2019 wells decline by 50% in their first year and more recent wells by 75% which is incorrect for the 2019 wells, the first year decline is similar and the best years (around 2016) decline rate was still 69% in first year. Also Mike seemed to associate the publicly traded companies with the EIA 914 which is not quite right, the EIA914 uses data reported directly to the EIA by both public and private oil companies and those companies produce about 90% of the C plus C from the US L48.
Mike is correct that Permian EUR has increased because of increasing lateral length and in 2021 there may have been some high grading where more tier one wells were being completed than normal, in 2022 this may have stopped leading to a fall in EUR, I do not have access to data beyond 2022 as Novilabs no longer provides any free access to data (this is new starting in October 2024).
Chart below is Permian basin average new tight oil well EUR in kilobarrels of tight oil by year based on data from shaleprofile.com and Novilabs.
Permian EUR per 10k feet of lateral (normalized to 10,000 feet) for 2013 to 2022. Note that an exponential function fit to 2016 to 2022 data using OLS finds an average annual decrease of about 1.75% per year. If we consider 2021 and 2022 anomolous and fit on 2016 to 2020 the annual decrease in normalized EUR is about 1.15% per year. Note that the 2022 estimate is based on the smallest amount of data and data is often revised, unfortunately I am no longer getting any new data.
How can we be using less oil in 2024 than in 2018?
There are far more goods vehicles globally and car efficiency has not improved that much in 5 years
Global shipping is far higher
https://www.statista.com/statistics/253987/international-seaborne-trade-carried-by-containers/
Global aviation is higher
https://www.iata.org/en/iata-repository/pressroom/fact-sheets/industry-statistics/
.
Something doesn’t add up.
Perhaps the mass murderers in the Chinese government are fibbing about how much oil they buy from another couple of governments who imprison and torture anyone who stands against them?
Surely not.
Loadsofoil,
There are many more EVs, plugin hybrids and hybrids than there were 5 years ago, also natural gas powers shipping of LNG and is being used for transporting goods by land. Production of oil is measured separately than the import and export of oil and many different agencies track the production of oil closely. The amount of C plus C used in the world per unit of real GDP produced in constant dollars has been decreasing for 40 years and is likely to continue decreasing.
Dennis
Russia has thousands of oil wells, no outside agency can monitor what they produce.
What agency do you think has hundreds of people on the ground in Russia?
People in Russia do not even know how many Russians have been killed in Ukraine and that is far harder to hide then how many barrels of oil produced from thousands of wells.
Loads of Oil,
OPEC watches very closely what is happening in Russia, as does NATO, the IEA, and EIA and many private oil tracking firms. The estimates are no doubt imperfect, but better than just creating the estimate we like.
Dennis
You forgot to mention the CIA. They probably have the best info but not for the public.
Ovi,
Some of the info is made public, but not all of it, each NATO member has its own dtat collection.
https://www.cia.gov/the-world-factbook/
Dennis,
There is something which I suspect is suppressing oil consumption that IMO is greatly undervalued: substitution of PV for oil.
There is a great deal of diesel and fuel oil being used to generate power. Some of it is on the National/utility level: KSA is big; others include developing nations in Africa and Southeast Asia, such as Sudan, Congo, Pakistan, Bangladesh. Many small countries and islands: Jamaica, Hawaii, etc. Wood Mackenzie, reports there are now 17 countries that have more off-grid diesel generator capacity than on-grid power generation capacity. The researchers estimate there is now roughly 100GW of operational diesel power across 39 African countries – and they describe this as a “conservative estimate”.
In many countries where the grid is weak or inadequate diesel generation at the residential and commercial level is very widespread: India, most of Africa and the ME.
Diesel generation is very expensive to run. Solar PV has much lower TCO: panel prices have fallen dramatically, and have next-to-zero operational costs. The total cost of PV is much lower than the operational cost of diesel. This means diesel will move to a relatively rarely used backup.
A simple and very low cost first step is to add decentralized solar to mostly eliminate diesel consumption during the day when power consumption is highest. That’s happening very strongly right now in places like Australia and Pakistan (PV sales in Pakistan are so high that the national utility is in financial trouble). Simple and low-cost follow-on strategies include moving consumption to the day, and adding batteries incrementally.
I think this must be reducing diesel consumption significantly.
https://www.americansecurityproject.org/diesel-generators-are-the-next-frontier-in-curbing-carbon-emissions-asp/
https://www.energymonitor.ai/power/weekly-data-africas-diesel-generation-boom/?cf-view
Nick,
This may be a factor, but without data on the diesel used for power generation Worldwide we are left speculating on how significant this is.
Yeah, it would take some time to develop decent quantitative estimates. Nevertheless, it’s clearly significant:
“A solar surge has reached new heights in Pakistan, sparking what some experts are calling one of the fastest solar revolutions in the world.
Thanks to cheap Chinese solar technology imports, Pakistan is expected to add an estimated 17 GW of solar power in 2024, which is more than a third of the country’s entire generating capacity.
The surge is “probably the most extreme” case “that has happened in any country in the world with the speed that has happened,” according to energy analyst Dave Jones, who tracks the global energy transition at think tank Ember in the UK.
This growth places Pakistan as one of the top installers of solar panels globally for 2024, in the company of much bigger, richer economies like China, the US and Germany, Jones’ team found.
Countrywide, consumers, businesses and industries are rushing to tap into the cheap renewable power source as an alternative to the erratic and expensive state-provided, largely fossil-fuel-based energy.
When Shafqat Hussain’s mom nearly died during a 28-hour power outage at their family home that coincided with a heatwave, he decided it was time to harness the power of the thing that almost cost his mother her life: The sun….His family’s energy bill has since been slashed by about 80%, and they haven’t endured a power outage since. They now revel in a newfound “sense of safety,” said Hussain.
The boom puts Pakistan on a better pathway to achieve its goal of 60% renewable energy by 2030. But the mass solar upswing hasn’t been without complications.
As increasing numbers of people use solar power to meet their own energy needs during the day, the sudden drop in demand is causing problems for operators of the main national electricity grid.
“The way those power plants were planned and funded was to run a minimum amount of hours,” said Jones. Because they’re no longer meeting those minimum hours, the electricity they do provide is becoming significantly more expensive for the remaining consumers, Jones explained.
“It’s also causing problems for balancing the grid more generally,” he added, as operators are struggling to predict how much energy they will need to provide and when.
Pakistan’s solar revolution is only possible because of the plummeting cost of solar PV modules, which have reduced in price by 90% in the last 15 years alone….Over four decades, solar power has gone from being one of the most expensive, out-of-reach electricity sources to just about the cheapest in most places around the world.
Pakistan is not the only country tapping into the cost-saving clean alternative. Throughout 2024, Jones’ team at Ember tracked high numbers of Chinese solar exports to Saudi Arabia, the Philippines, the United Arab Emirates, Thailand, South Africa and Oman.
“It is transformative and it’s affordable,” said Azeem Azhar, author, tech entrepreneur and founder of research group Exponential View, who likens the exponential drop in the cost of solar technology to the PC revolution of the 1980s.
https://www.dw.com/en/pakistan-solar-power-renewable-energy-power-grid-v2/a-70885544
Here’s a similar report, but with more detail:
“Not long ago, energy analysts noticed something weird in the data they were tracking. The anomaly centered on Pakistan. All of a sudden, the country seemed to be using far, far less electricity than before. What the analysts would discover baffled them – a different kind of power surge brewing elsewhere, right under their noses….
Over the course of 2024, Pakistan will install an estimated 15-20 GW2 of solar power. That could be almost half of its entire generating capacity. If that figure doesn’t quite resonate with you – putting it plainly, it’s absolutely heaps. …
A little while back, energy analysts noticed something weird in the data they were combing through.
Pakistan’s national electricity grid data that is. There seemed to be a huge drop in demand for electricity. A drop of 10 percent since 2022. For a rapidly growing country of 250 million people, where the economy has also grown by 2 percent in the past two years, that just didn’t seem right….
there aren’t many hard datasets around, head to Google Earth to see for yourself.
Dave Jones: Oh my God, I had a lot of fun going through Google Earth! It was really hypnotizing just floating around and being able to see all of these solar panels from the satellite images that they have. And it’s not on one or two houses in certain areas, like whichever urban area you went to, whether it was a house or block of flats or whether it was a factory or government building, you could see those solar panels on the image everywhere.
I had a look too, and Dave’s right, float over Islamabad Larkana, Lahore… and you’ll see the unmistakable little checkered grids atop homes, businesses, buildings big and small, left, right and center.
Dave Jones: It was unbelievable. Just the amount of solar panels on so many buildings spread throughout the whole of the country.
But how to find out just how much solar had made its way to Pakistan? Tracking how solar is developing and being deployed in different parts of the world is extraordinarily hard. A lot of the government stats are really delayed or even non-existent.
The renewable shift is happening so rapidly and, sometimes, randomly, most governments can’t track how much power is coming from where quickly enough to crunch official statistics. There is one country with a very useful, up-to-date dataset though. And that is China. The world’s number one manufacturer of solar PV modules…
It’s come to that point now that for daytime electricity, it is a no brainer for people in Pakistan to go out there and to be doing this on the scale that they’re doing it…
It was earlier in 2024 that in some countries like the US and in Germany, it became cheaper to buy a solar panel than to buy a fence panel for your garden made out of wood or fake plastic that looks like wood. And so, you started to see the first time in places like Germany people installing solar panels vertically as fencing specifically around balconies.
Now of course the physics of that is that a vertical solar panel doesn’t get as much sunlight as one that is sort of horizontal or tilted at an angle points to the sun, but it gets some sunlight and it’s cheaper than you’re putting a fence panel up, so why not do it and just generate some electricity while you’re at it?
And it’s not just Pakistan and Germany cashing in.
Over the course of this year Dave’s energy data analysis team has tracked high numbers of Chinese solar exports to Saudi Arabia, the Philippines, the UAE (United Arab Emirates), Thailand, South Africa and Oman too.
There are also whispers of people-powered solar trends similar to Pakistan happening in Zimbabwe, Namibia and Madagascar.
This rise in renewable energy has big, big implications for ambitious global climate goals. Especially the one to triple renewable energy capacity by 2030. Which, until now, based on combined national targets, wasn’t looking like it was gonna happen. But, if on-the-ground solar surges like we’re seeing in Pakistan continue, a tripling could actually be within reach .”
https://www.dw.com/en/deep-dive-the-hidden-solar-revolution-that-stumped-experts/audio-70856809
And this is still the first inning on this form of energy deployment, or perhaps the early 2nd inning.
From OPEC Annual Statistical Bulletin (ASB) at link below see table 4.8 from Section 4 Oil data: downstream.
https://publications.opec.org/asb/Download
Annual World demand for gasoline, kerosene (jet fuel), and distillate fuel (diesel) in chart below.
2019=62865 kb/d, 2023=63023 kb/d
When “Demand’ is used in this context I presume it means actual consumption (as best can be determined).
Is that a correct presumption?
Hickory,
Yes this is an estimate of World consumption of these oil products. Below is EIA estimate for World consumption of gasoline, distillate fuel, kerosene, and jet fuel. Slightly different from the OPEC estimate, particularly for 2023 with a difference of 1484 kb/d (OPEC being higher by 1484 kb/d). Perhaps more than a slight difference at about 2.4% higher for the OPEC estimate compared to the average of the two estimates in 2023 (62281 kb/d).
Thank you Dennis,
Would be nice to include the Statistical Book of Energy, for completeness
Kdimitrov,
I agree. Data for chart below from Energy Institute’s Statistical Review of World Energy (Oil regional consumption tab.)
Interesting piece on Oil Market Forecasts.
https://www.bakerinstitute.org/research/whats-happening-oil-market-forecasts
Chart below from piece linked above
Updated Permian Basin Region C plus C estimate (includes both tight oil and conventional oil) using latest data from RRC of TX, OCD of NM and EIA. Data from November 2022 to October 2024 (24 months). The average annual rate of increase over the past 24 months has been 402 kb/d for C plus C output from the Permian region. Tight oil output is about 500 kb/d lower than the regional estimate (500 kb/d is roughly what conventional oil output has been lately from the Permian basin region). US L48 onshore C plus C has increased at an annual rate of 535 kb/d over the past 24 months (Nov 2022 to Oct 2024). About 75% of the L48 OS increase has come from the Permian region over the past 2 years.
US Production at New High
Bounce back from GOM and 55 kb/d from Texas.
A Happy, Healthy and prosperous New Year to all
Thanks Ovi, not to steal thunder from the detailed post, but my initial additive observations:
1. NM close to flat, down slightly. Likely just monthly noise. But we’ll see.
2. ND down significantly, but the result is temporary. Wildfires in OCT led to several pads being shut in. Should be mostly back on line in NOV, except a few that were damaged. (Source, Director’s Cut.)
3. LA was up a bit. That’s just temp hurricane shutins coming back. A microcosm of the GOM dynamic with a drop followed by return.
4. MT up also, but is now just a hair behind LA. But still interesting to see it nose forward.
Segue: Doesn’t change national dynamics or the world price. But just kind of an interesting local play to observe. Presumably because Elm Coulee was developed so early in the shale revolution there is some oil that was left behind by too-small completions or poor in-zone hzes. So, now they are going back and trying to get some of the left behind.
A little bit of this is in play in ND itself, which is still relatively old compared to the EF or Permian. Does not imply that this will happen in the Permian, since its development was later in the revolution. Well…unless 5 or 10 or 20 years from now, we have more gradual improvements in shale development. And…that would never happen right? (Just cornie wishfullnes, until it happens and the naysayers have to adjust.)
I’m teasing a little. My assumption is there will be SOME development/improvement in technology, but not as much as we saw earlier in the shale revolution. So, sort of halfway between the cornies and the naysayers. But still enough to make people like Dennis Coyne need to (once again) shift their goalposts on “when wells start to degrade”. And even more for the more-negative-than-DC types, like G&R, Berman, etc. But still, in general. But also not the crazy, crazy improvements that cornies predict.
5. OH down slightly, but still well ahead of LA and MT and KS.
6. UT down slightly. Not sure if noise or what.
7. WV up 10, but maybe just noise. Lot of up/down in their graph. And they are still nowhere near recent peaks.
8. CO up noticeably. Not sure why.
9. Bunch of other states (e.g. WY) down slightly.
10. Net, net: I think your summary of GOM and TX as most significant tells the story!
———
11. Natty is up a couple BCF/day. Probably just filling storage for winter.
Even if you take out AK (which is reasonable, it’s disconnected to the NAM pipe grid and mostly pumped right back into the ground), it’s still over a BCF/d up. But that’s just seasonable variation.
Prices are decent. FEB “prompt” futures contract is sort of decent at ~$3.67. Spot is ~$2.95. Sources: CME (futures) and EIA (spot). Not great. But still not in the tank. Winter gas drilling in prolific areas is incentivized.
Nony,
The decrease in normalized EUR is about 1.7% per year from 2016 to 2022, don’t have access to data for beyond 2023, Novilabs is 10k per year, too rich for me.
My recent scenario has new wells with gradually decreasing EUR of 1% per year starting in 2025, I also assume average lateral length increases no further and that eventually producers have to start mixing more tier 2 and tier 3 acres into their mix. I assume technological improvements allow the devrease in EUR to only be 1% at the current completion rate.
Comparison of two Permian scenarios where one has an EUR decrease of 1% per year at a completion rate of 480 wells per month (using average 2022 EUR) starting in Jan 2025 and the second scenario where there is no decrease in new well EUR. The completion rates are the same for the two scenarios. Completion rate is assumed to be 480 wells per month from Feb 2025 to December 2032 and then decreases. The lower 56 Gb scenario is already very optimistic and the assumption of no decrease in new well EUR is quite unrealistic in my view (note it is assumed there is no increase in lateral length after 2022).
For the Permian scenarios above the average annual rate of growth in Permian tight oil output is about 99 kb/d for 56 Gb scenario from 2024 to 2030 (6 years) and 108 kb/d for the 59 Gb scenario from 2024 to 2032 (8 years), even the lower scenario is likely to be too optimistic in my view. In either case tight oil output growth from the Permian basin will be quite small on an annual basis compared to the past.
Total wells completed for both Permian scenarios in previous comment is 141,370 with no completions after February 2045. Completion rate is assumed to decrease by 2 wells per month from Jan 2033 to Jan 2040 and by 5 wells per month from Feb 2040 to March 2045.
Dennis,
what is the current Permian production?
Up there in this thread you had it at 6.5 MMbpd, but this chart is 6MMbpd. What’s the difference in methodology?
Thanks!
Kdimitrov,
The higher number is Permian region output, I estimate conventional output from the Permian region is about 500 kb/d, based on Novilabs data from 2023 that I had downloaded earlier before they cutoff all free access to their data. This 500 kb/d difference is just whether we include the conventional output or not. The regional output is the more solid estimate, the conventional output is more of a rough estimate, so the 6000 kb/d estimate might be 100 kb/d higher or lower somewhere 5900 to 6100 kb/d for Permian tight oil output.
Shorter answer
Permian region output (conventional plus tight oil)=6500 kb/d
Permian tight oil=6000 kb/d plus or minus 100 kb/d.
Year End WTI Challenge Winners
Year End price winner was Iron Mike. He guessed $73/b. Settled price was $71.72 high by $1.28. Second was Dennis at $75, high by $3.28
Average for the year was Dennis. He guessed $75/b and was low by 79¢. Second was Iron Mike low by $2.79.
As for the group average, we didn’t do well. Year End price guess was $86.80 and year average guess was $83.
Overall Hideaway was the most optimistic and HHH was the most pessimistic.
Thanks Ovi,
I think I didn’t come second for the year average. It seems Dennis came first, WeekendPeak, Shallow Sand, and Hickory were all pretty close 2nds.
Thanks for charting it up as well, looks great.
We’ll do another one for 2025.
Iron Mike
Glad to see that you are starting the New Year more awake than I am.
Weekend Peak came in second to Dennis on the Year Average. He just snuck in ahead of SS.
Thanks
Hey Ovi, should be do another guessing competition for 2025?
Ovi,
Are you using futures prices? I would use the spot price, which will be available for December 31 tomorrow from EIA. Or maybe you found spot prices somewhere.
Not a huge difference between futures and spot prices though they tend to track pretty closely for WTI.
Oh you are using Dec 27 for year end. The spot price was $70.38/b for WTI on Dec 26, 2024 (no data for Dec 27). The year average from Jan 2, 2024 to Dec 26, 2024 was $76.69/b, though the Dec 30 and Dec 31 data might change the average a bit, the data is published today maybe after 1 PM US Eastern Time.
I would call Weekendpeak the winner based on spot price for the yearly average and Iron Mike remains the winner for year end WTI spot price as of Dec 26, we will know more later today after 1 PM.
Looking back to the original post you specified futures prices, though the EIA has changed policy on futures prices since Jan 2024 and they are now only available through April 2024. For 2025 we should probably play the game based on spot prices from link below.
https://www.eia.gov/dnav/pet/pet_pri_spt_s1_d.htm
Hopefully the EIA doesn’t change policy on Spot prices in the future.
My guess for yearly average WTI spot price at Cushing, OK in 2025 is $70/b and my guess for closing price for Dec 31, 2025 is $65/bo for WTI spot price at Cushing, OK. My expectation is that chaos from Trump may lead to slow economic growth for the World in 2025 and lead to slow growth in demand for oil.
Better link for WTI Spot Prices below
https://www.eia.gov/dnav/pet/hist/RWTCD.htm
Dennis
I report the settled price posted by the Chicago Mercantile Exchange. It is the price reported by the financial press and financial TV business news. The EIA reference you supplied reports the WTI price at Cushing and it is different than what is reported by the CME.
In the response above to Iron Mike, I agree that Weekend peak won the average price guess.
The attached picture is from the CME site and shows the settled price for December 31.
https://www.cmegroup.com/markets/energy/crude-oil/light-sweet-crude.html
Ovi,
That is a futures price no? Yes this number is widely reported on financial news and is important especially for hedging. How are you finding the average annual price? In your first chart it says Dec 27 for closing price rather than Dec 31 so I mistakenly thought that was the date for your closing price for 2024.
Spot price is easier to track in my view as we can download the spreadsheet for the year from EIA or Fred as in link below
https://fred.stlouisfed.org/series/DCOILWTICO
Note that based on the average you use, I would be the winner for yearly average price (for futures contracts, but unclear where you get this data), but I am using a different average based on spot price and that number will change when we have the spot prices for Dec 30 and Dec 31, probably not by much though. Also for an overall winner where we assume the average and yearend price are equally important, Shallow sand would get the prize as he is closest when we take the sum of the two guesses and compare to the sum of the results.
WTI Price reported by the Financial TV.
I have to get the CME price every day since the EIA stopped reporting it in April 2024.
You ask where do I get this data. I download it every day. The one advantage for me to use the EIA data for Cushing would make life simpler and would not have to worry about missing a day.
Note that today’s current price is $73.31 up $1.59. Adding 71.72 and 1.59 = 73.31
The Dec 27 is a typo. That’s when I updated the chart. I forgot to change the date when I updated the price.
For average spot price for crude for 2024 I get $76.63/b for WTI at Cushing, OK. The spot price on Dec 31, 2024 was $72.44. The sum is $149.07, Shallow Sand guessed 73 for average and 76 for year end price for a sum of $149. For futures prices Ovi has 75.75 yearly average and $71.72 year end price, the sum is $147.47. If we assume yearly average and year end price should be equally weighted (50/50) Shallow sand is the winner for 2024 whether spot or future prices are used (the contest was based on futures prices).
Congrats Shallow Sand, you have earned bragging rights for knowing the future, Happy New Year!
Congrats to Iron Mike who wins year end price contest (for either WTI spot prices or futures prices.)
Also congrats to weekend peak who wins yearly average price contest based on WTI spot price.
Ovi,
Futures price is fine, I only used spot price because I did not have access to daily futures data, seems going forward spot prices would be easier as it seems to be too much work to track the daily front month futures price for WTI.
Found WTI futures data at link below
https://www.marketwatch.com/investing/future/cl.1/download-data?startDate=1/1/2024&endDate=12/31/2024
The 2024 average closing price was $75.76/b, just as you said.
Dennis
Attached is a comparison of the CME price and the EIA’s Cushing price since the middle of December.
I agree to switch over to EIA Cushing since it will make life a lot simpler for me and we will use it as the basis for next year’s price guess.
Thanks Ovi, great job as always.
Peak then and now:
Happy new year POB!
Can’t say when this will happen but if history repeats itself then it just might be soon…
Kengeo,
2024 US C plus C will probably be about 13.24 Mb/d and the STEO forecasts 13.5 Mb/d for 2025 which is probably pretty close, probably a plateau at 13.5 to 13.7 Mb/d from 2025 to 2030, unless oil prices crash due to over supply relative to demand for oil before 2030.
An update to US October Oil Production has been posted.
https://peakoilbarrel.com/new-record-high-for-u-s-october-oil-production/
A new Open Thread Non-Petroleum has been posted.
https://peakoilbarrel.com/open-thread-non-petroleum-january-3-2025/