By Ovi
All of the Crude plus Condensate (C + C) production data, oil, for the US state charts comes from the EIAʼs Petroleum Supply monthly PSM which provides updated information up to September 2024.

U.S. September oil production decreased by 157 kb/d to 13,204 kb/d. The largest decrease came from the GOM, 215 kb/d. August production was revised down by 40 kb/d from 13,401 kb/d to 13,361 kb/d.
US oil production has been essentially flat since September 2023 when it was 13,177 kb/d.
The dark blue graph, taken from the November 2024 STEO, is the forecast for U.S. oil production from October 2024 to December 2025. Output for December 2025 is expected to reach 13,661 kb/d, down 51 kb/d from the previous post. From October 2024 to December 2025 production is expected to grow by 215 kb/d. Most of the increase will occur in November 2025.
The light blue graph is the STEO’s projection for output to December 2025 for the Onshore L48. September Onshore L48 production was down by 30 kb/d to 11,166 kb/d. From October 2024 to December 2025, production is expected to increase by 155 kb/d to 11,374 kb/d, revised down from 11,442 kb/d in the previous post.
US Oil Production Ranked by State

Listed above are the 11 US states with the largest oil production along with the Gulf of Mexico. Ohio has been added to this table since its production approached 100 kb/d in January and exceeded Louisiana’s production. These 11 states accounted for 85.7% of all U.S. oil production out of a total production of 13,204 kb/d in September 2024.
On a MoM basis, September US oil production dropped by 157 kb/d. The drop was primarily due to hurricane Helene entering the GOM in Late September. On a YoY basis, US production increased by 27 kb/d.
It should be noted that there are two other states with similar production to Louisiana, Montana and Kansas.
State Oil Production Charts
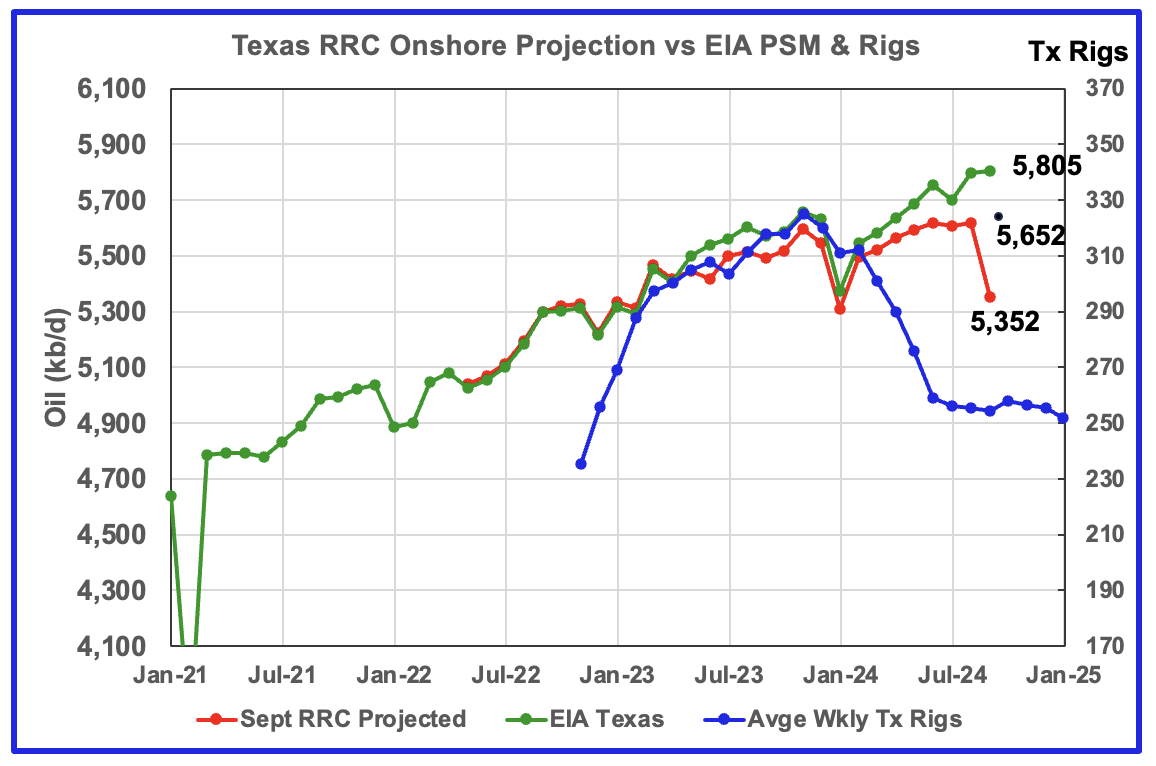
Texas production increased by 9 kb/d in September to 5,805 kb/d a new record high. YoY production is up by 235 kb/d. August production was revised down by 22 kb/d from 5,818 kb/d to 5,796.
The red graph is a production projection for Texas using the Texas RRC reported August and September oil production. The projection uses the cumulative difference between the August and September preliminary production data provided by the Texas RRC. Unfortunately there is a significant under reporting of September production. Typically the production difference between the latest month and the previous month is around 300 kb/d. However the August/September difference according to the latest RRC update is 582 kb/d. This makes the September production projection of 5,352 kb/d not credible.
I have arbitrarily added 300 kb/d to the projection to obtain the 5,652 kb/d production estimate shown for September which puts the projection 153 kb/d below the EIA’s 5,805 kb/d. The projection is directionally correct with the EIA Texas data from January 2024.
The gap between the projection and the EIA production data could be due to slow updating.
The blue graph shows the average number of weekly rigs reported for each month, shifted forward by 10 months. So the 276 rigs operating in July 2023 have been shifted forward to May 2024. From February 2024 to July 2024, the rig count dropped from 312 in time shifted February 2024 to 256 in July 2024. That drop of 56 rigs had no impact on production until recently when monthly production increases appear to be slowing.
As of September, production rose even though the rig count continued to fall. This is a clear indication that some significant improvements have been made with drilling technology and possibly fracturing.
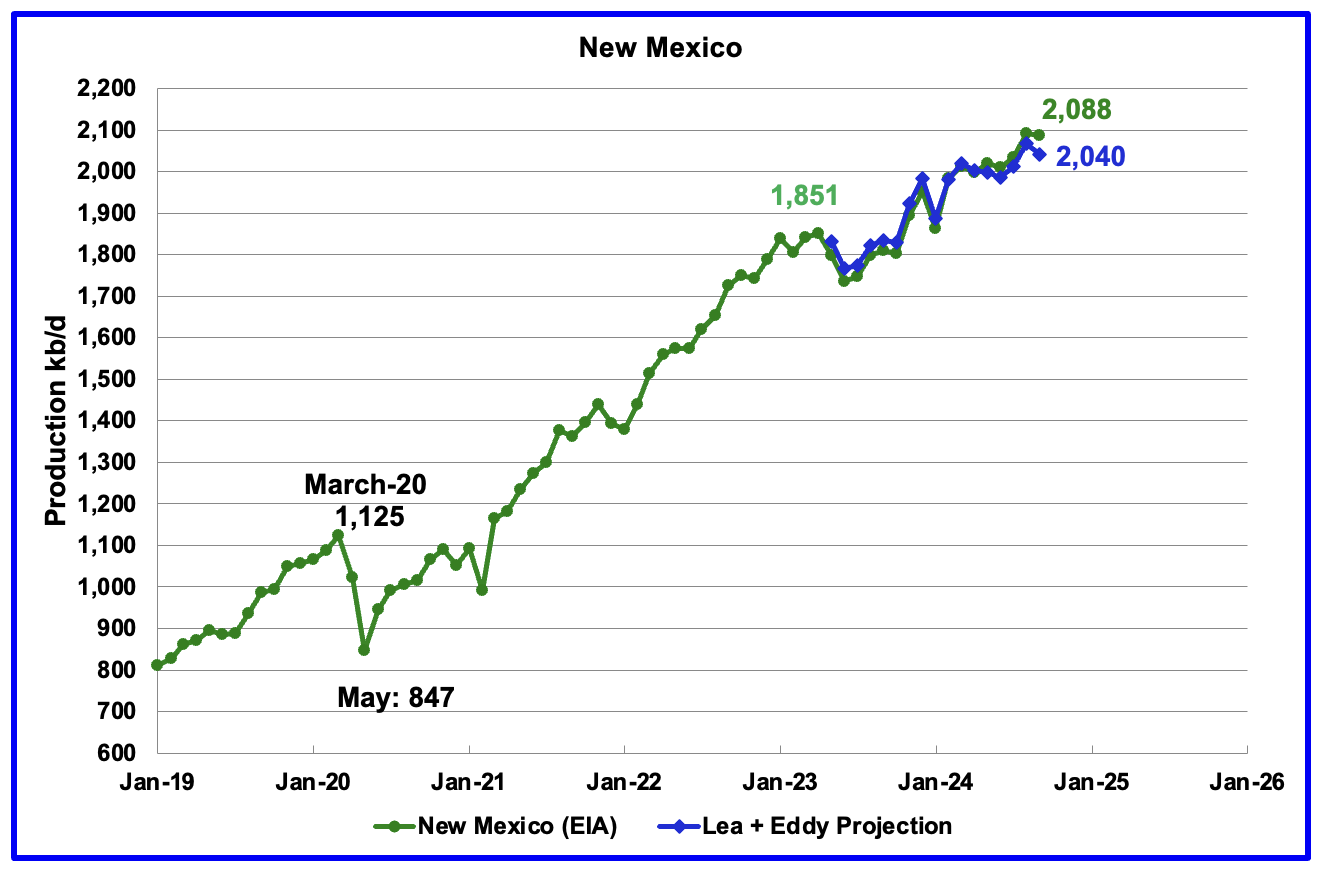
According to the EIA, New Mexico’s September production dropped by 4 kb/d to 2,088 kb/d.
The blue graph is a production projection for Lea plus Eddy counties. These two counties account for close to 99% of New Mexico’s oil production. The projection used the difference between the August and September preliminary production data provided by the New Mexico Oil Conservation Division. Both show a decrease for September but the projection is 48 kb/d lower than the EIA’s forecast. A 1% correction was added to the Lea plus Eddy projection to account for their approximate fraction of New Mexico’s oil production.
Note the methodology used to project New Mexico’s production is the same as that used for Texas.
More oil production information for these two New Mexico and Texas counties is reviewed in the special Permian section further down.
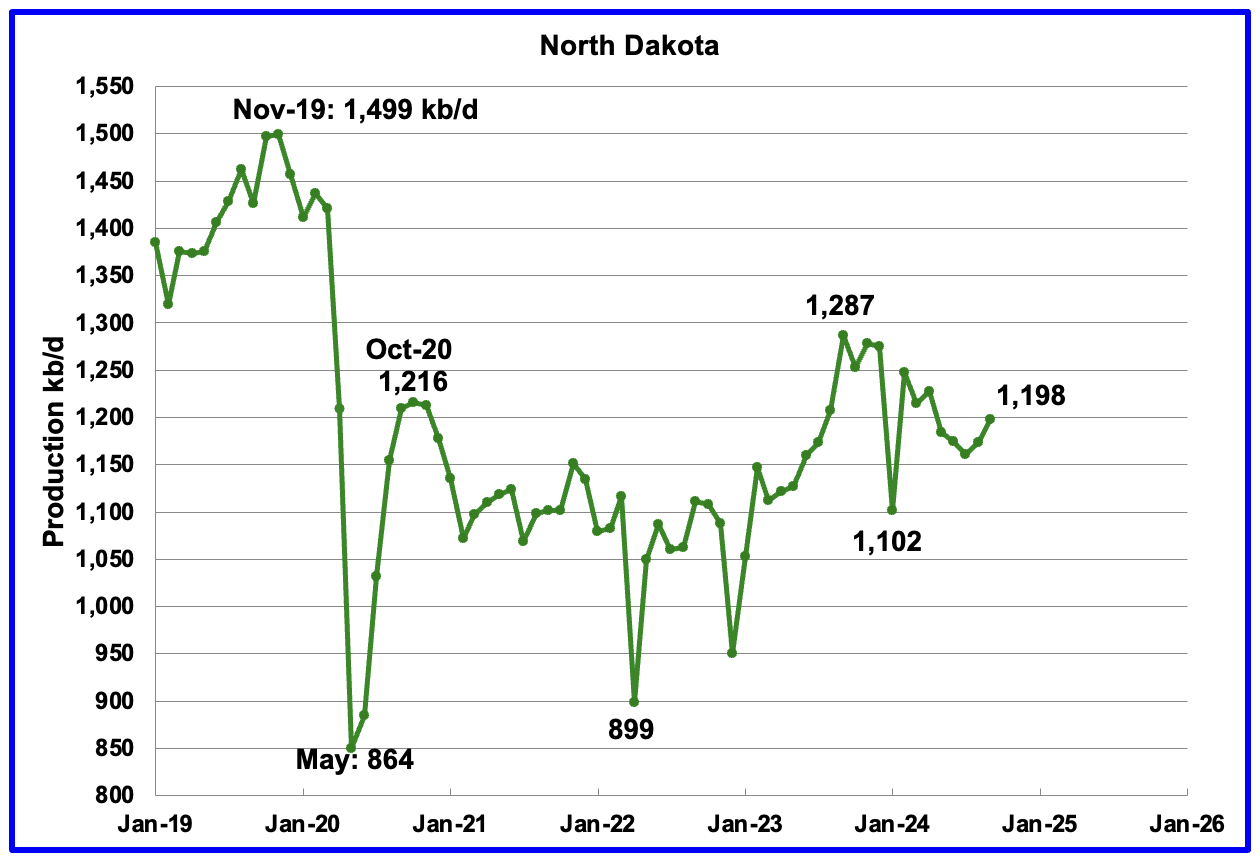
September’s output increased by 25 kb/d to 1,198 kb/d. Production is down by 89 kb/d from the post pandemic peak of 1,287 kb/d.
According to this article, ND reached a new all-time high in producing wells in September 2024.
He said the state produced nearly 1.2 million barrels of oil a day in September and that number was about a 1.2% increase and 9% above the revenue forecast. He said that was the increase they have been anticipating coming up later on the year, based on the completions they have been seeing.
The state permitted 111 wells in October.
“We think around that 100 number is the number we need to be at to be able to grow production 1-2 %,” Bohrer said.
He said the rig count has been very steady over the last several months. On Tuesday, 39 rigs were actively drilling in North Dakota.
“The rig count remains steady,” Bohrer said. He said it might increase slightly over the coming years.
He said there are 16 frac crews currently active in the state. He said last month there were 18 frac crews actively working.
Bohrer said the number of wells waiting on completions are steady. He said they believe that will be the new normal for future numbers. In September, 376 wells were waiting on completions.
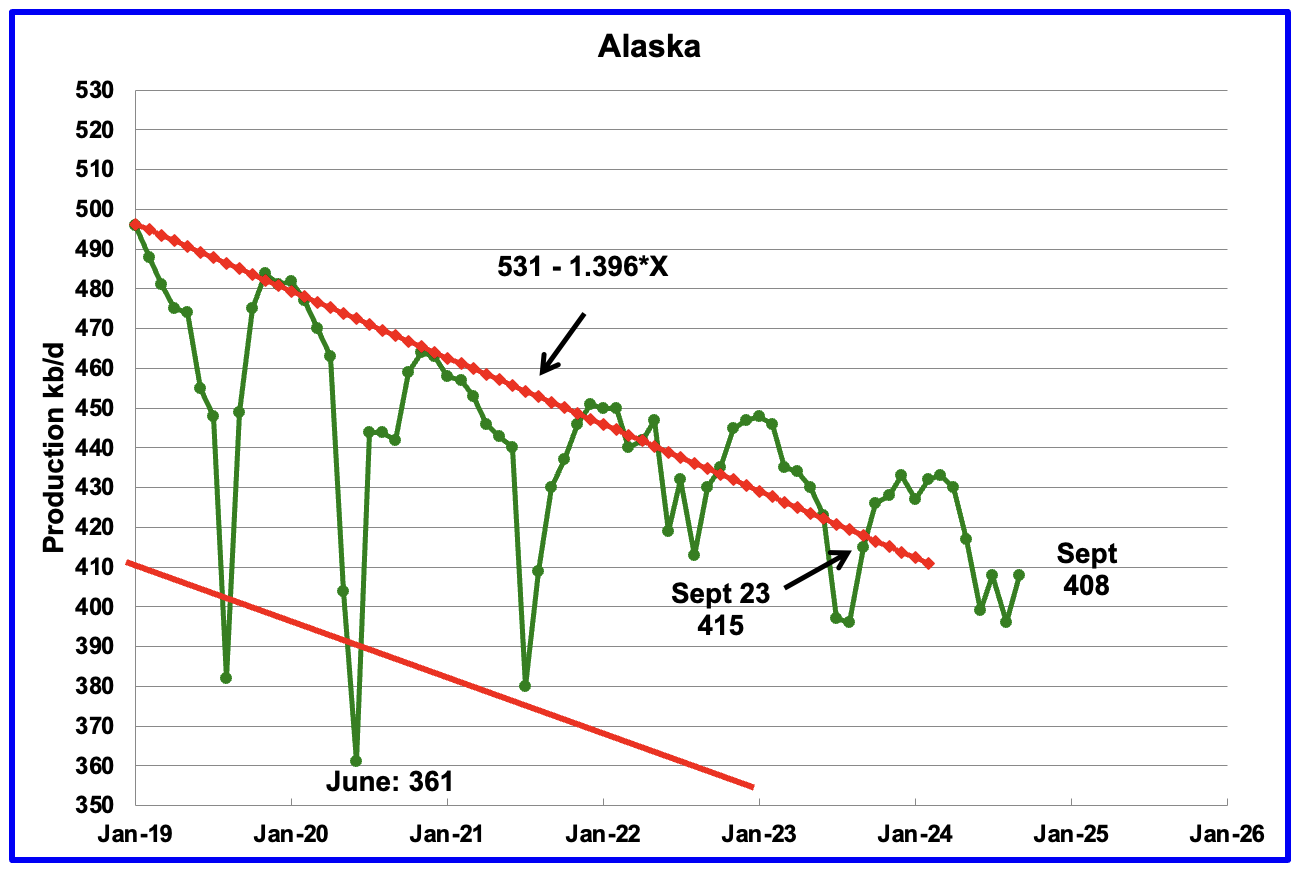
Alaskaʼs September output rose by 12 kb/d to 408 kb/d while YoY production dropped by 7 kb/d. The increase in production is an indication that summer maintenance is winding down and production should begin to recover. Weekly Alaska September production reports are close to 410 kb/d.
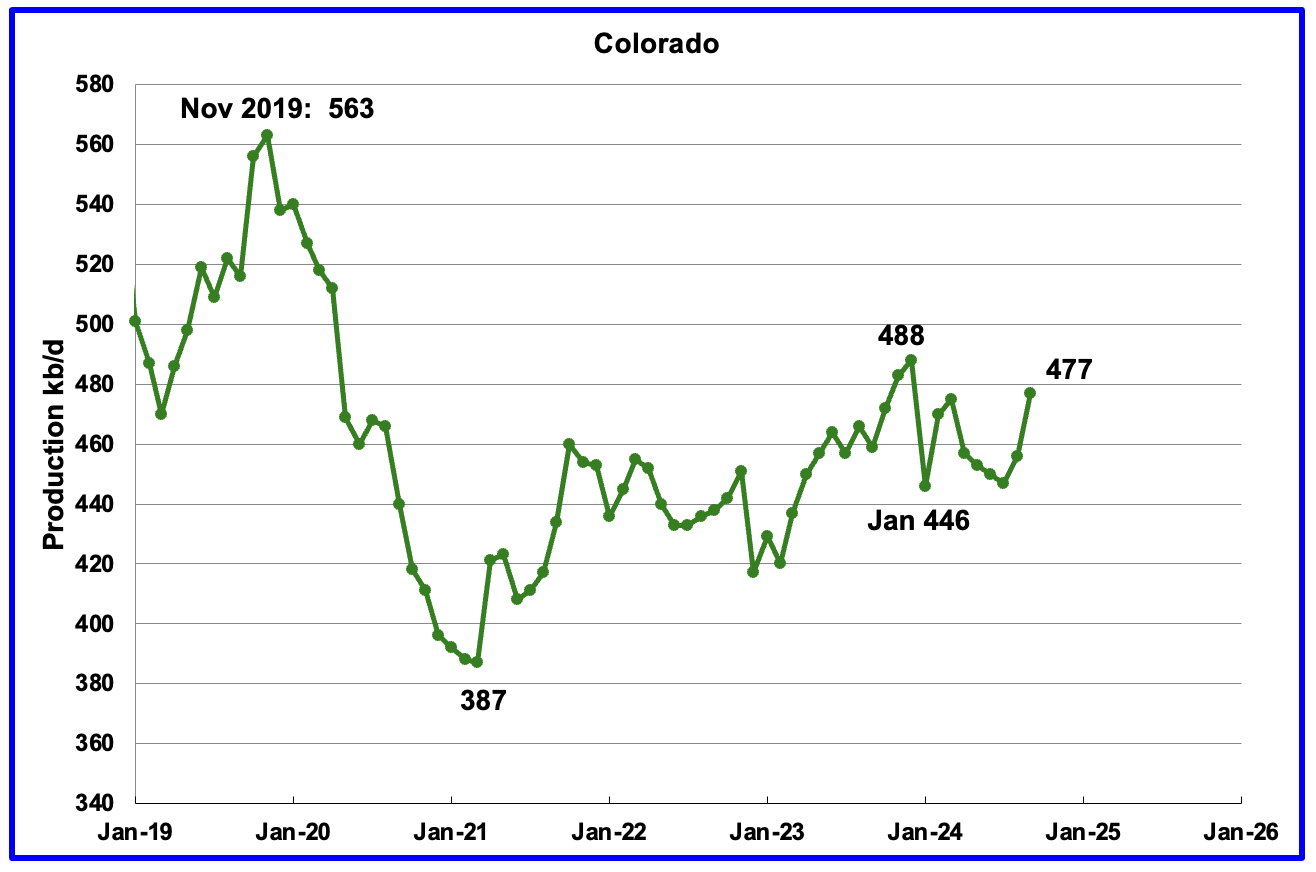
Coloradoʼs September oil production increased by 21 kb/d to 477 kb/d. Colorado has moved ahead of Alaska to become the 4th largest US oil producing state. Colorado began the year with 12 rigs but dropped to 10 during June, July and August and had 8 in operation October and November.
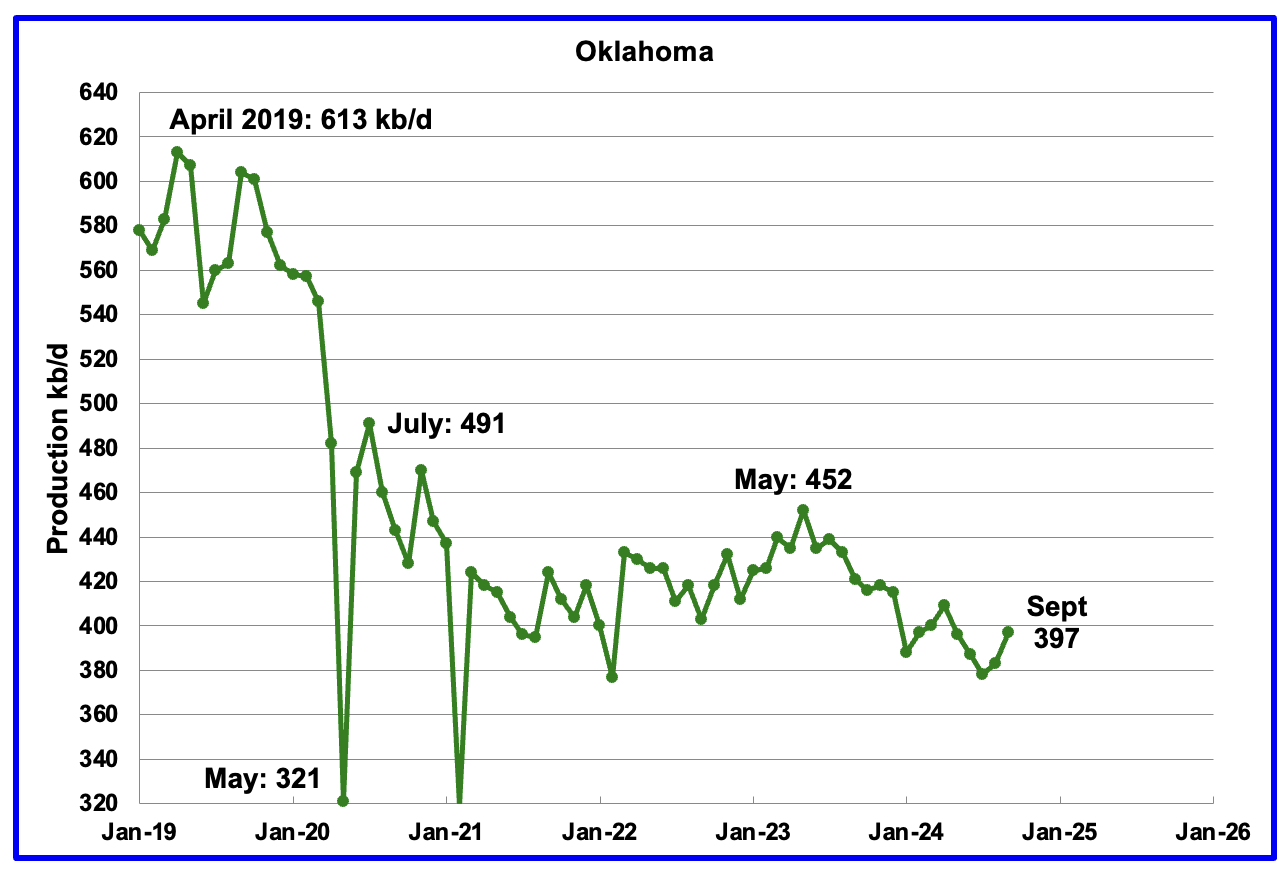
Oklahoma’s output in September rose by 14 kb/d to 397 kb/d. Production remains below the post pandemic July 2020 high of 491 kb/d and is down by 55 kb/d since May 2023. Output entered a slow declining phase in June 2023.
Oklahoma’s rig count dropped from 40 in May to 30 in July. By the end of September 2024 there was an uptick to 41 operational rigs and has held steady at 40 in October and November. Will the increase in the rig count reverse the current dropping production trend?
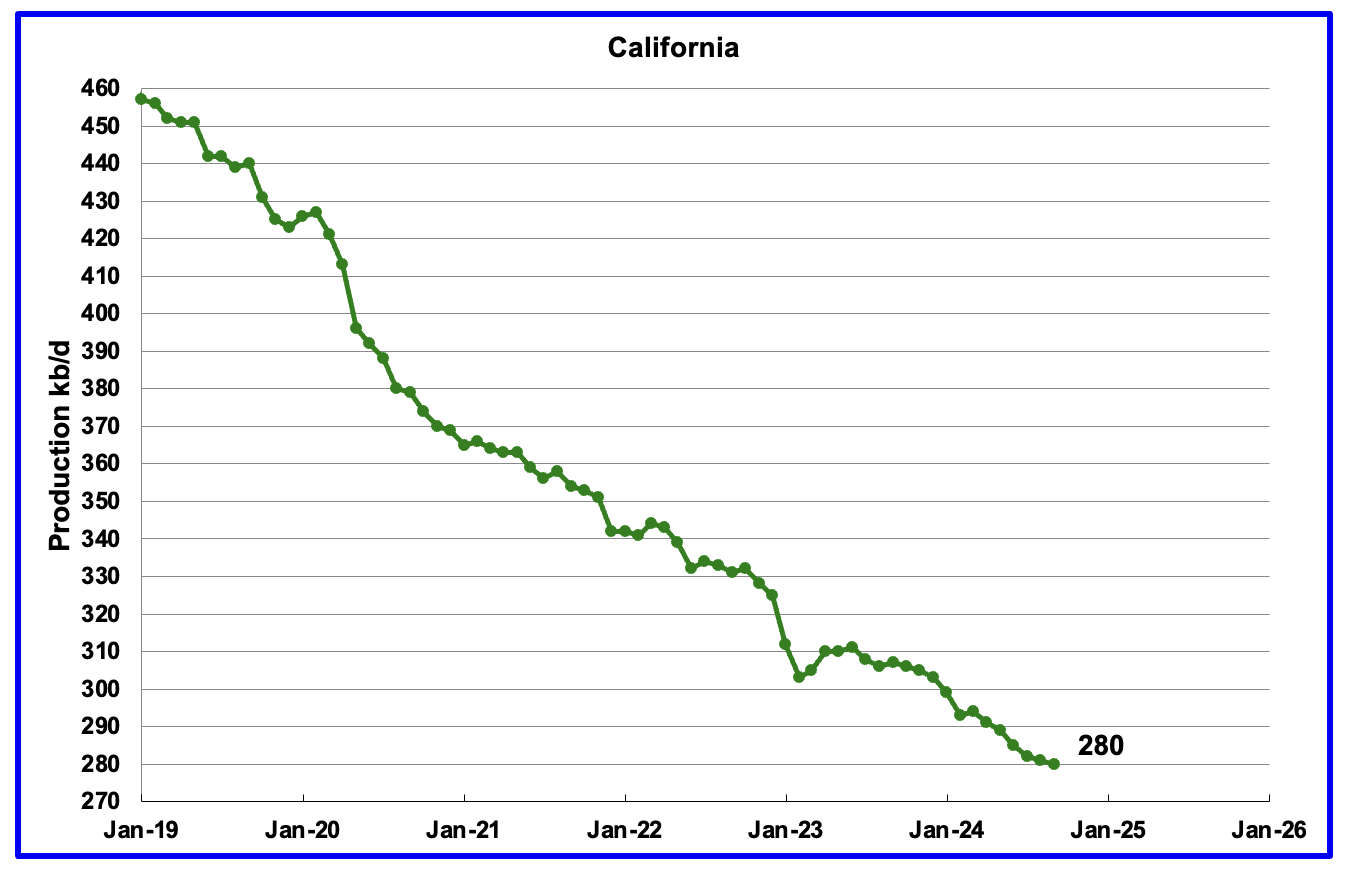
California’s declining production trend continues. September production dropped by 1 kb/d to 280 kb/d.
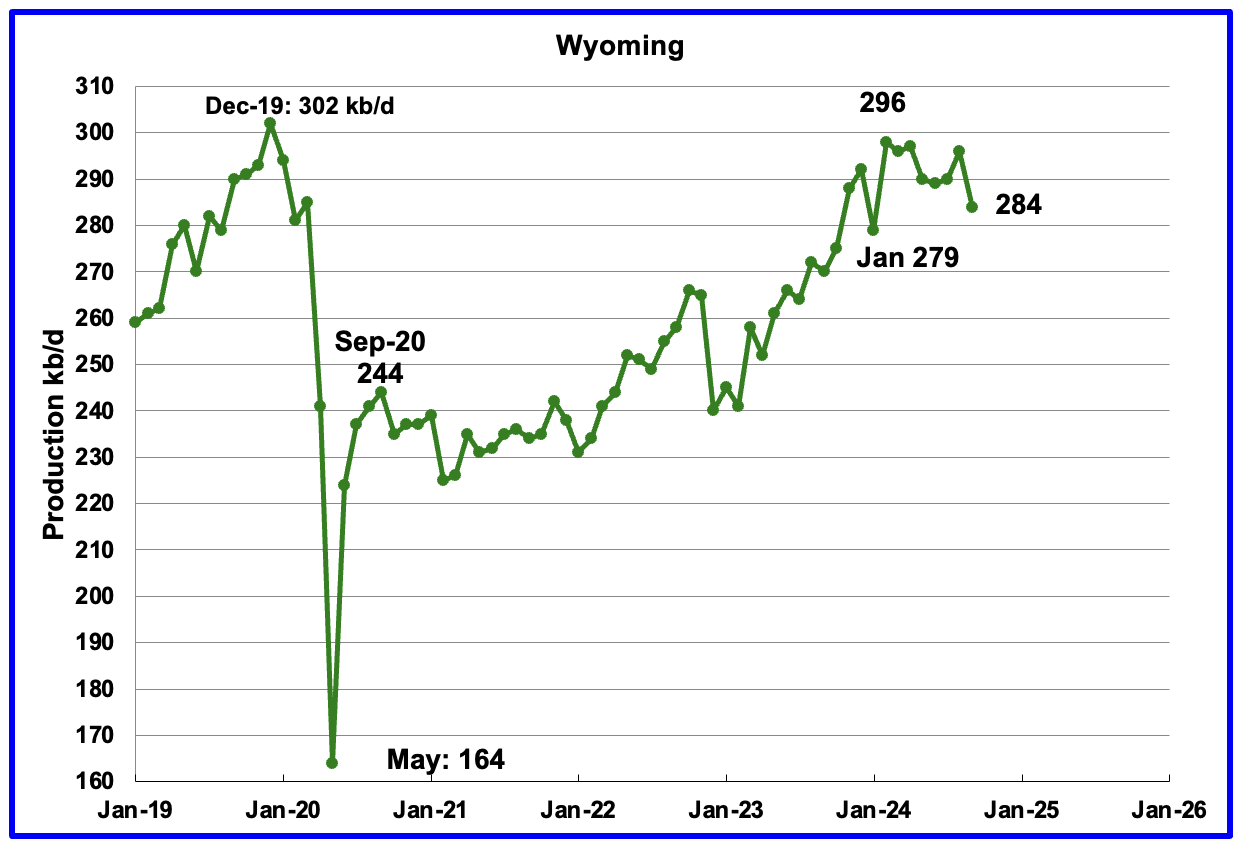
Wyoming’s oil production has been rebounding since March 2023. However the rebound was impacted by the January 2024 storm. Production peaked in February 2024 and shows no signs of rebounding. September’s production dropped by 12 kb/d to 284 kb/d. Note that production has almost recovered to the pre-Covid level of 302 kb/d.
In August Wyoming has 8 operational rigs. The rig count has slowly risen to 14 in November.
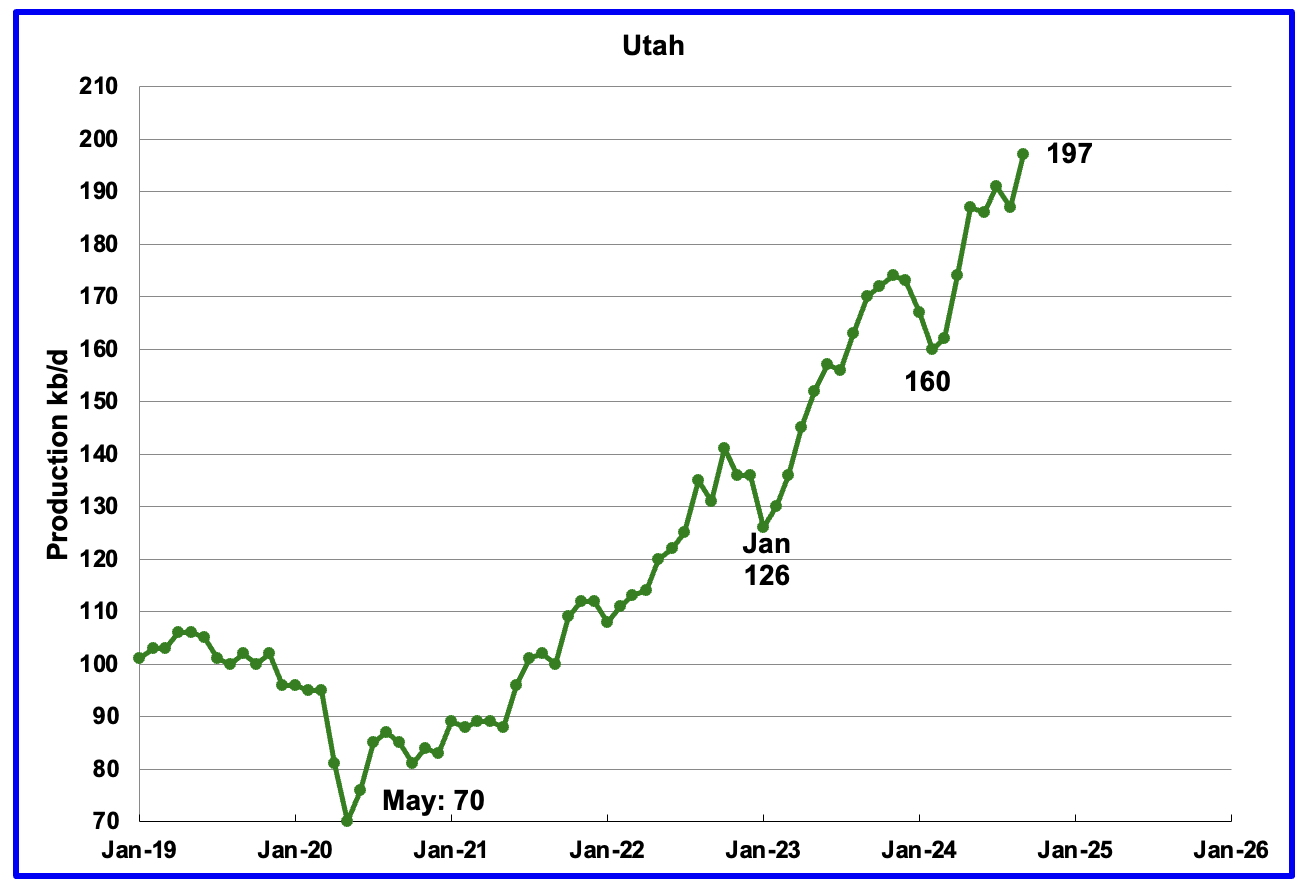
September’s production increased by 10 kb/d to 197 kb/d. Utah had 9 oil rigs in operation from January to September 2024 but dropped to 8 in October and November.
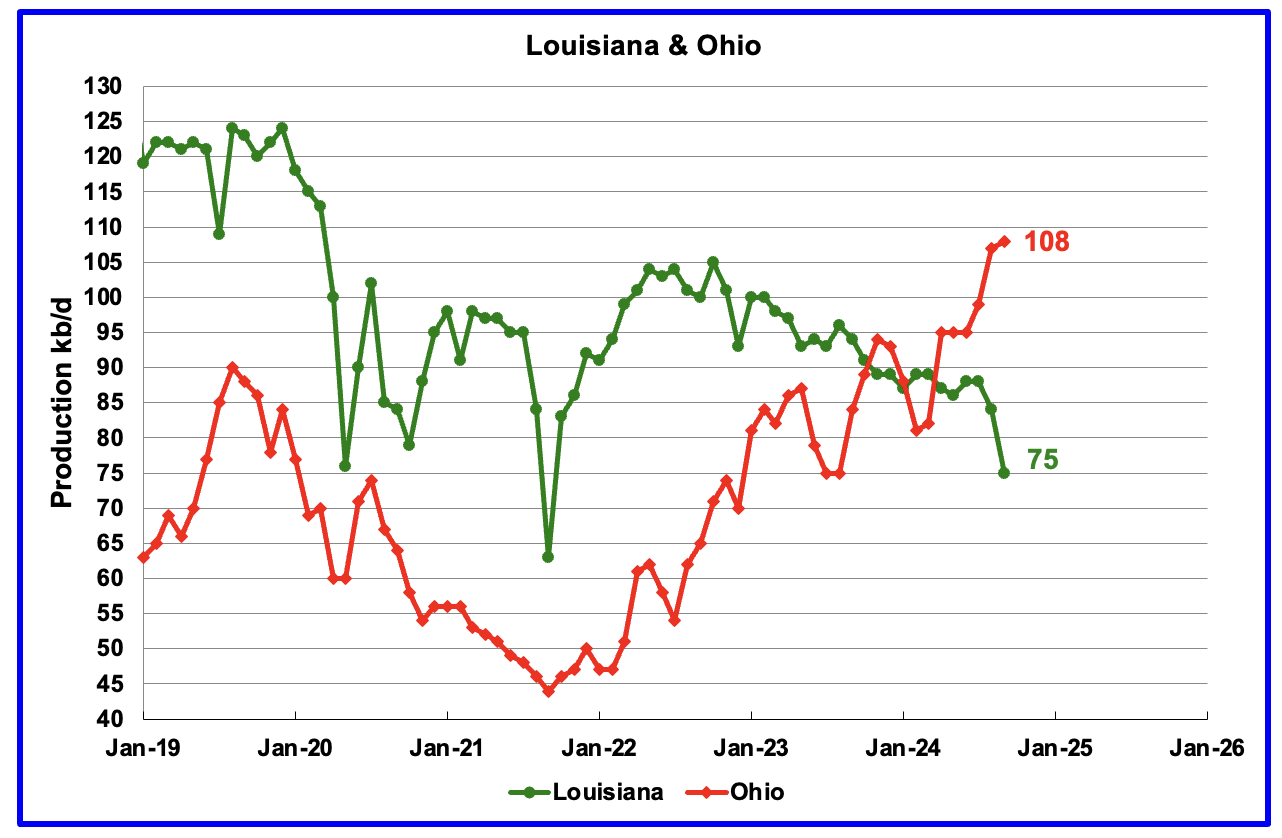
Ohio has been added to the Louisiana chart because Ohio’s production has been slowly increasing since October 2021 and passed Louisiana in November 2023.
Louisiana’s output entered a slow decline phase in October 2022. September’s production dropped by 9 kb/d to 75 kb/d.
Ohio’s September oil production added 1 kb/d to 108 kb/d, a new high. The most recent Baker Hughes rig report shows two horizontal oil rigs operating in Ohio in September, October and November.
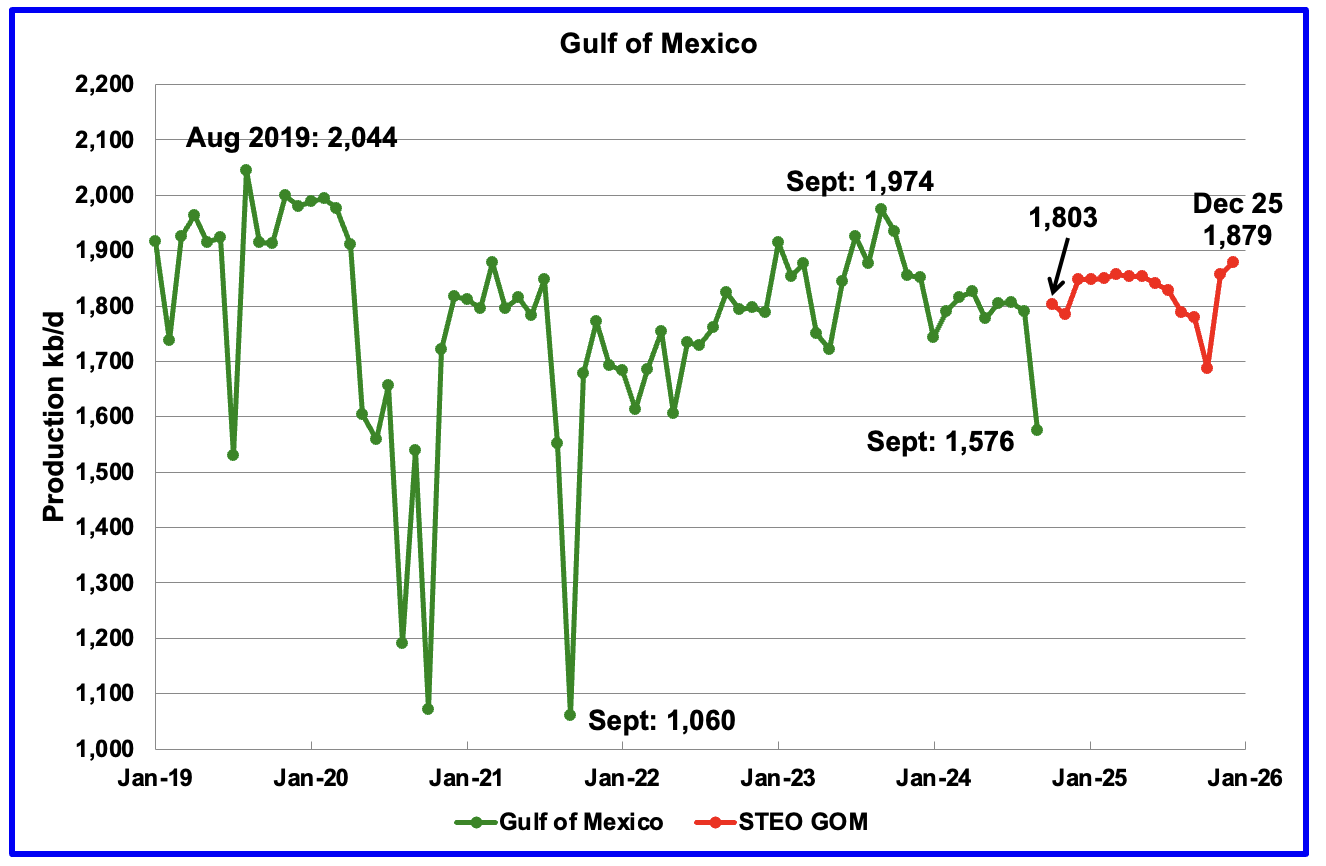
GOM production dropped by 215 kb/d in September to 1,576 kb/d but is expected rebound by 227 kb/d in October to 1,803 kb/d. The drop was caused by hurricane Helene when it made landfall as a Category-4 storm on the Florida Gulf Coast on September 26.
The November 2024 STEO projection for the GOM output has been added to this chart. It projects production from October 2024 to December 2025 will rise by 76 kb/d to 1,879 kb/d.
A Different Perspective on US Oil Production
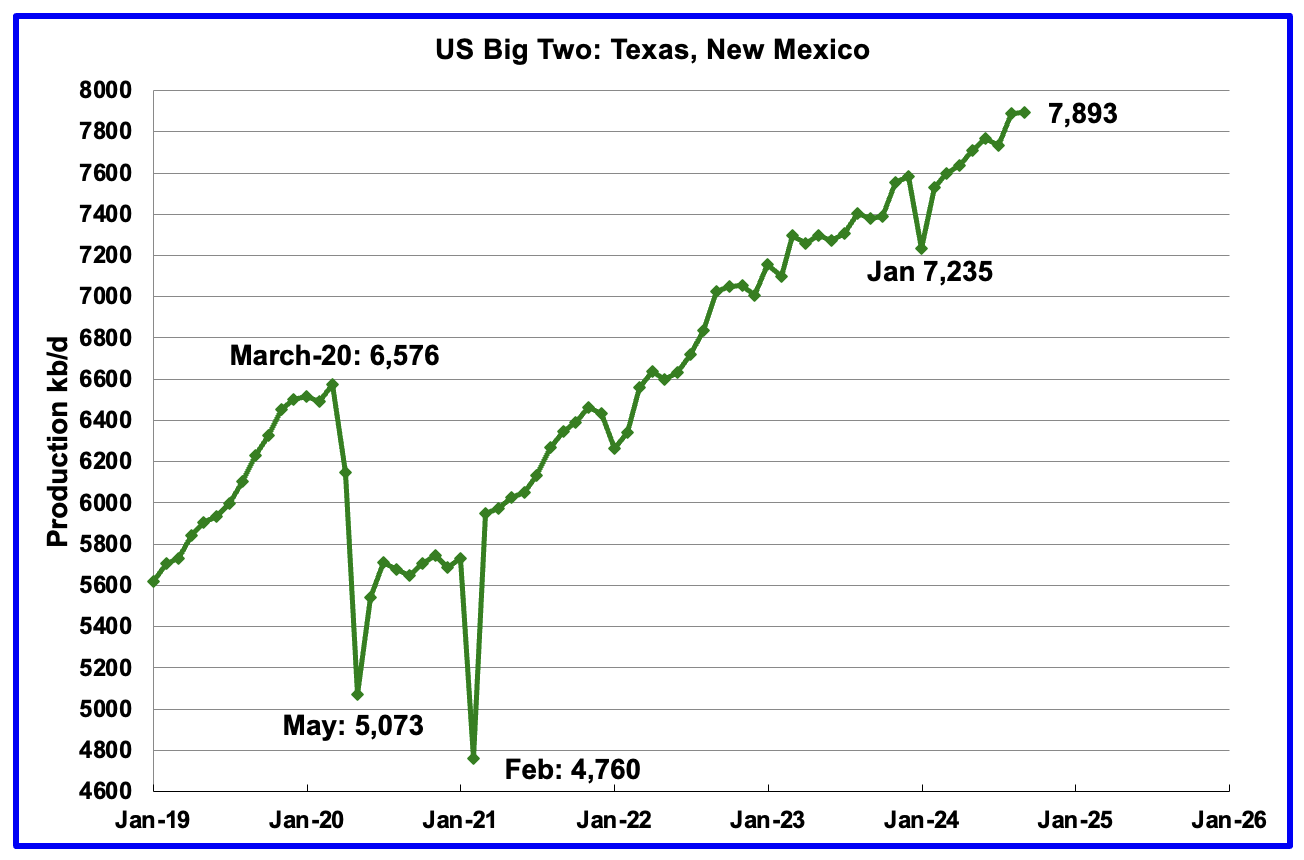
The Big Two states combined oil output for Texas and New Mexico.
September’s production in the Big Two states increased by a combined 5 kb/d to 7,893 kb/d, a new high, with Texas adding 9 kb/d while New Mexico dropped by 4 kb/d. August production was revised down from 7,910 kb/d to 7,888 kb/d.
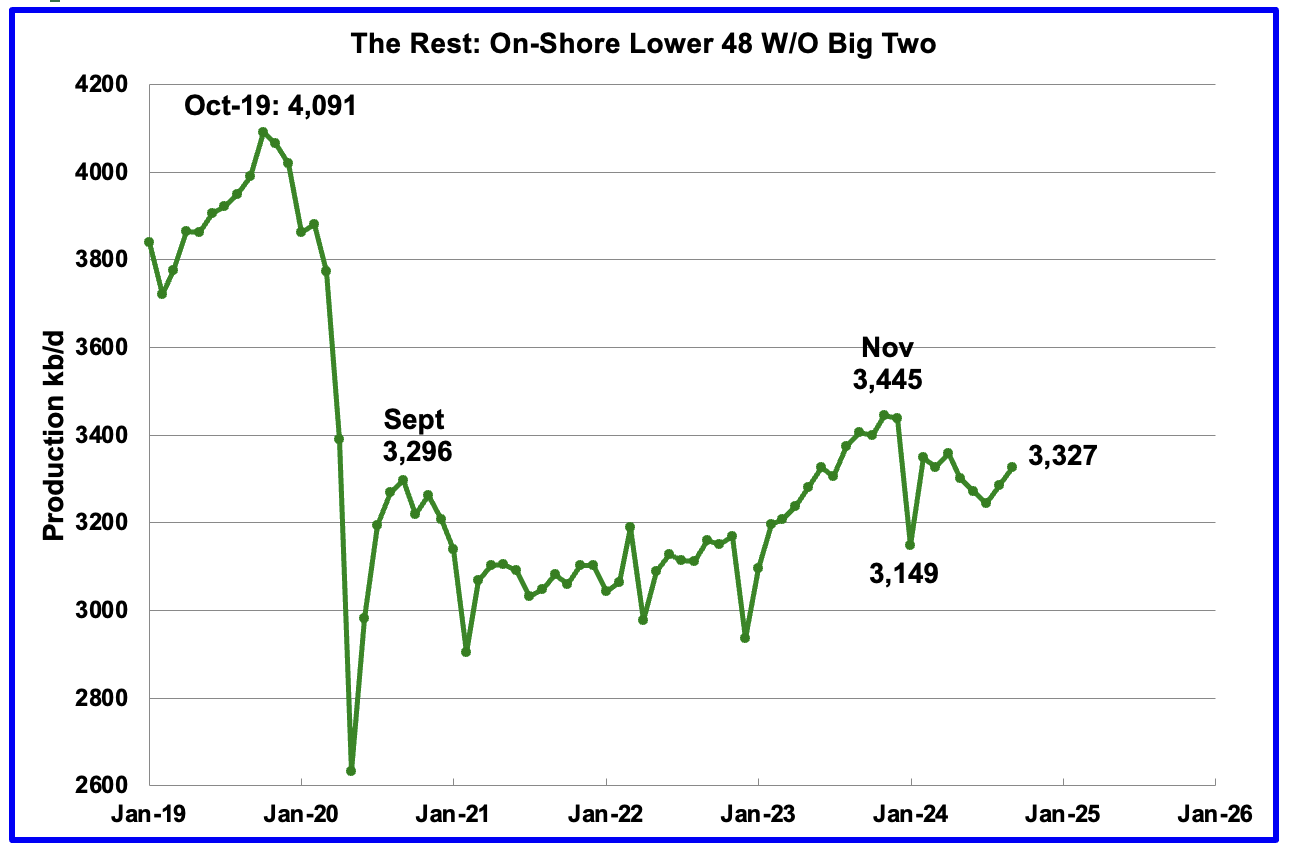
Oil production by The Rest
September’s oil production by The Rest rose by 41 kb/d to 3,327 kb/d and is 118 kb/d lower than November 2023.
The main takeaway from The Rest chart is that current production is below the high of October 2019 and is a significant loss that occurred during the Covid shut down and will not be readily recovered. Note that September 2024 production has now exceeded the Sept 2020 post covid rebound to 3,296 kb/d.
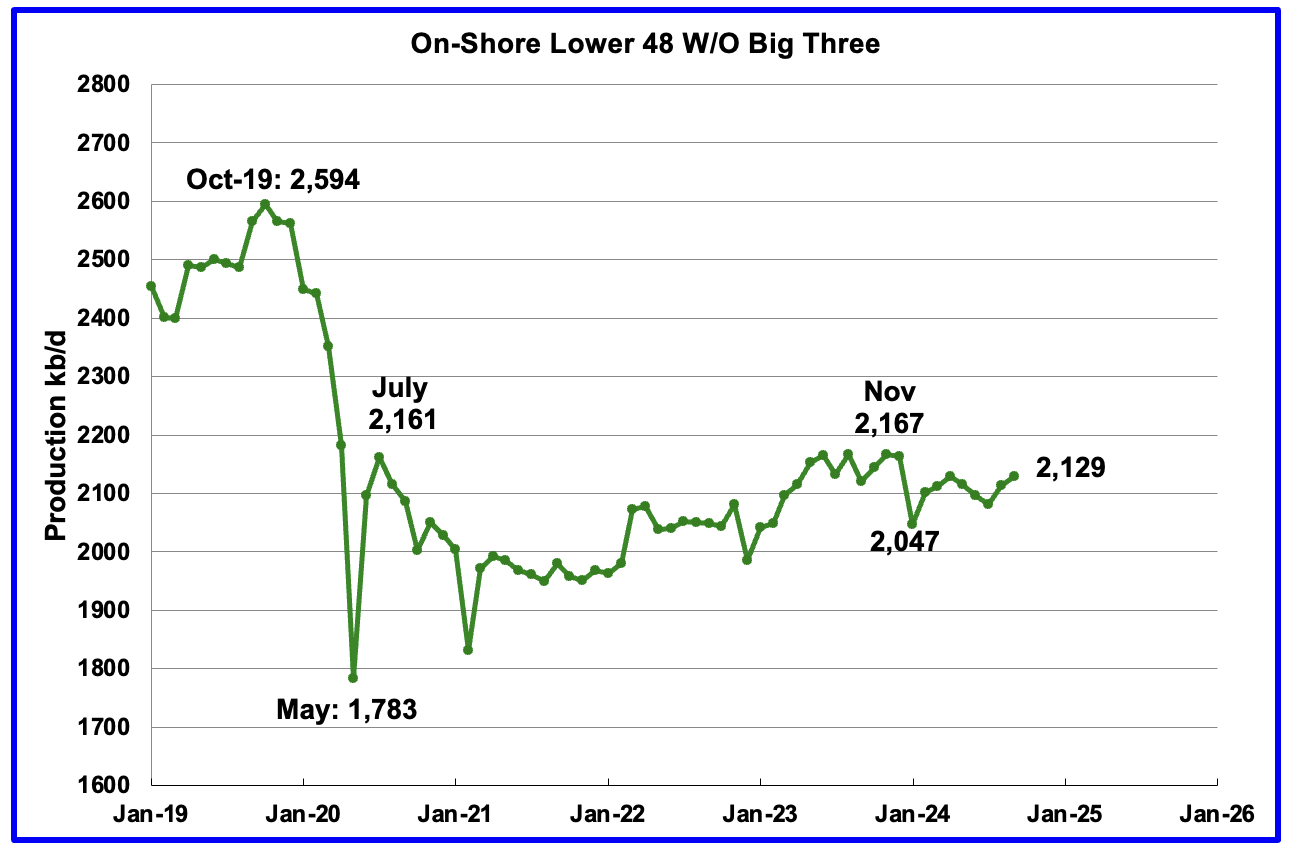
The OnShore L48 W/O the big three, Texas, New Mexico and North Dakota, shows production is on a plateau in the range of 2,125 ±75 kb/d from January 2023.
September’s OnShore L48 W/O the big three production increased by 13 kb/d to 2,129 kb/d.
Permian Basin Report by Main Counties and Districts
This special monthly Permian section was recently added to the US report because of a range of views on whether Permian production will continue to grow or will peak over the next year or two. The issue was brought into focus recently by the Goehring and Rozencwajg Report which indicated that a few of the biggest Permian oil producing counties were close to peaking or past peak. Also comments by posters on this site have similar beliefs from hands on experience.
This section will focus on the four largest oil producing counties in the Permian, Lea, Eddy, Midland and Martin. It will track the oil and natural gas production and the associated Gas Oil Ratio (GOR) on a monthly basis. The data is taken from the state’s government agencies for Texas and New Mexico. Typically the data for the latest two or three months is not complete and is revised upward as companies submit their updated information. Note the natural gas production shown in the charts that is used to calculate the GOR is the gas coming from both the gas and oil wells.
Of particular interest will be the charts which plot oil production vs GOR for a county to see if a particular characteristic develops that indicates the field is close to entering or in the bubble point phase. While the GOR metric is best suited for characterizing individual wells, counties with closely spaced horizontal wells may display a behaviour similar to individual wells due to pressure cross talking . For further information on the bubble point and GOR, there are a few good thoughts on the intricacies of the GOR in an earlier POB comment and here. Also check this EIA topic on GOR.
New Mexico Permian
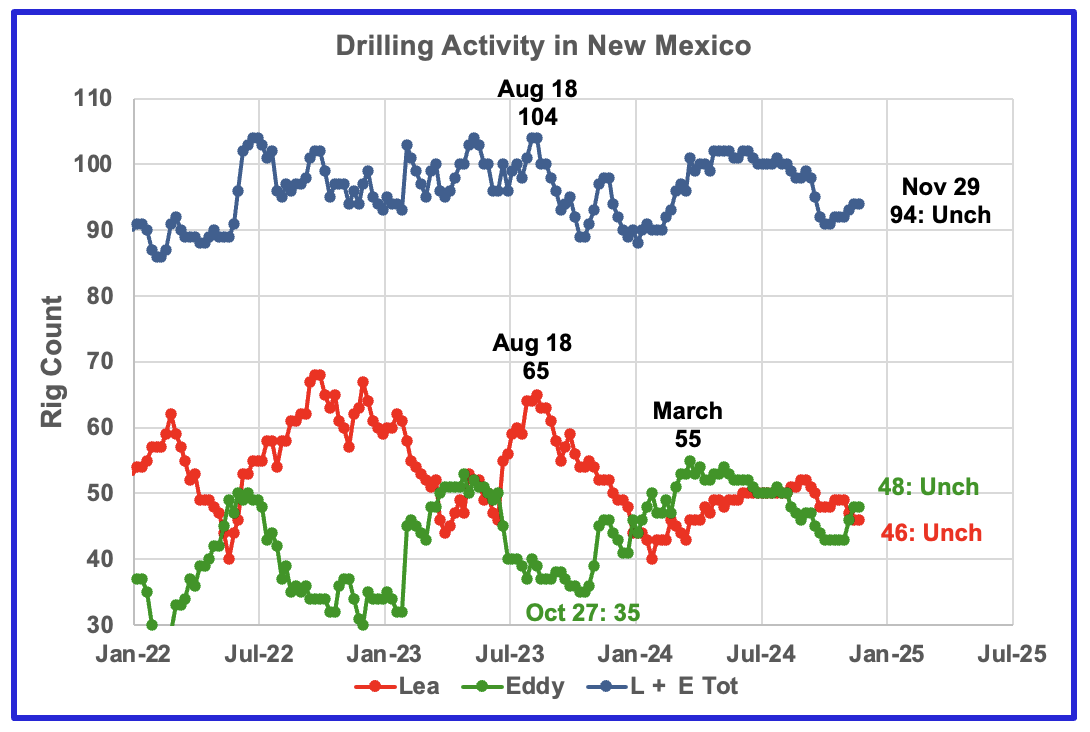
The total rig count in Lea and Eddy counties in the week ending November 29 is down 6 to 94 from the July count of 100.
Lea county rigs have declined from 50 in July to 46 in November.
The Eddy county rig count has increased by 5 from 43 in October to 48 in November. The rise in the Eddy rig count from 35 in October 2023 to 55 in March 2024 is now resulting in increasing production Eddy county in September. See further down.
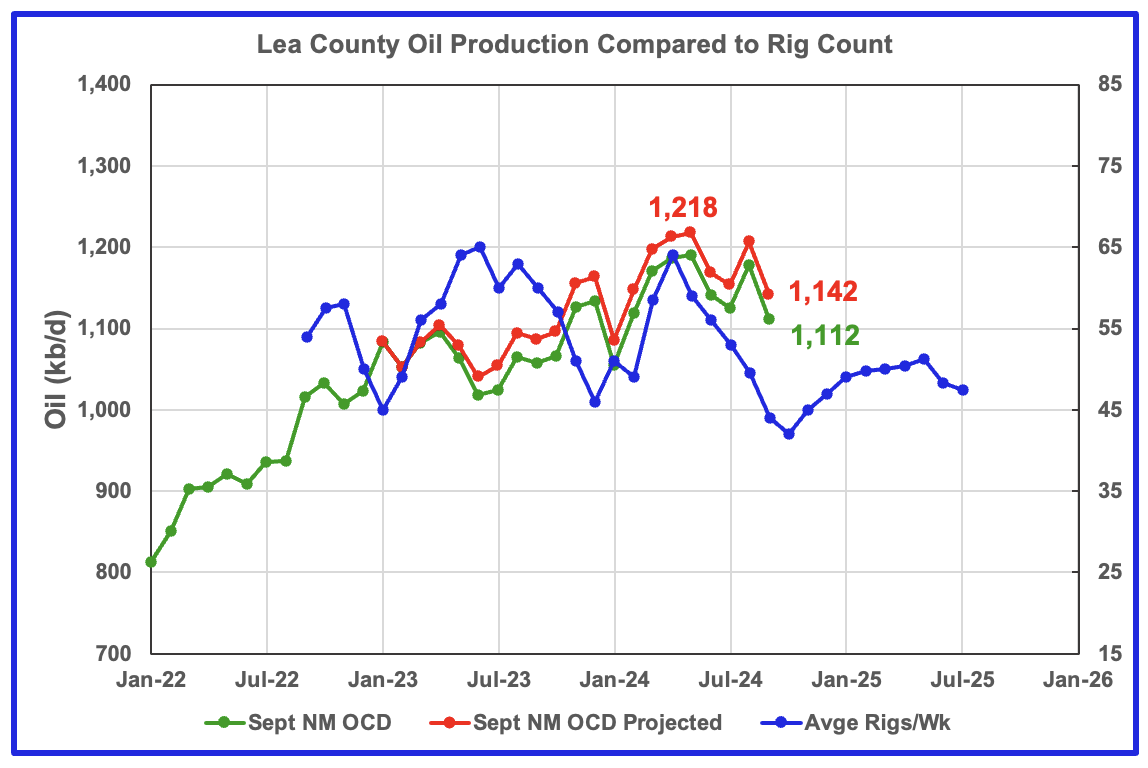
Lea County oil production peaked in May at 1,218 kb/d.
Preliminary September data indicates Lea County’s oil production decreased by 74 kb/d to 1,112 kb/d. A projection for September’s final production estimates it will be closer to 1,142 kb/d, a decrease of 64 kb/d from August and down 76 kb/d from 1,218 kb/d in May.
The blue graph shows the average number of weekly rigs operating during a given month as taken from the weekly rig chart. The rig graph has been shifted forward by 8 months. So the 64 Rigs/wk operating in August 2023 have been time shifted forward to April 2024 to show the possible correlation and time delay between rig count, completion and oil production. If the oil production were to follow the rig count going forward, oil production in Lea County should continue to drop for a few more months before recovering in November/December.
This chart is indicating production peaked in May and now has entered its decline phase.
Note that rig counts are being used to project production as opposed to completions because very few extra DUCs are being completed at this time.
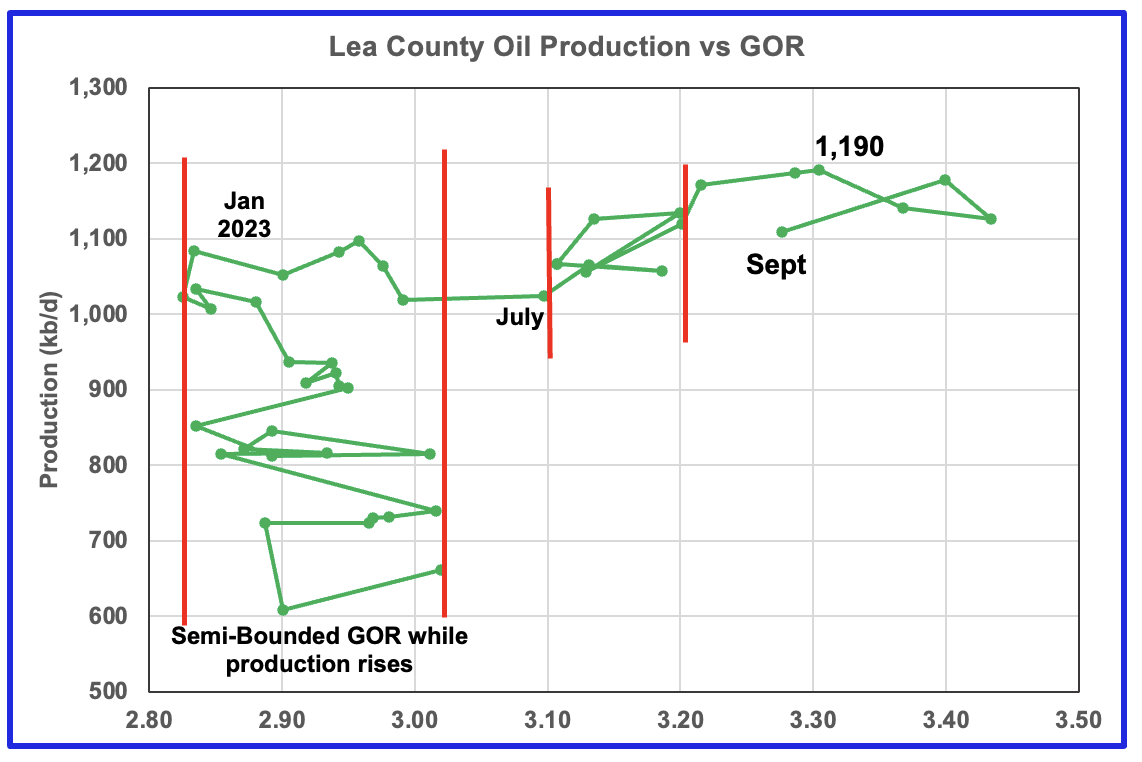
After much zigging and zagging, oil production in Lea county stabilized just below 1,100 kb/d in early 2023. Once production reached a new high in January 2023, production appeared to be on a plateau while the GOR started to increase rapidly to the right and entered the bubble point phase in July 2023.
Since July 2023 the Lea county GOR has continued to increase as production increased within a second semi-bounded GOR. This may indicate that the recent additional production is coming from a new bench/field since the GOR’s behaviour since August 2023 to March 2024 time frame appears once again to be in a semi bounded GOR phase accompanied with rising production.
The September drop may indicate that Lea county is in decline since the GOR is out of the Second Semi bounded GOR region. Production reaching a new high in May along with a decrease in the GOR in September is an atypical pattern that may resolve itself in North Dakota’s October update.
This zigging and zagging GOR pattern within a semi-bounded GOR while oil production increases to some stable level and then moves out to a higher GOR to the right has shown up in a number of counties. See a few additional cases below.
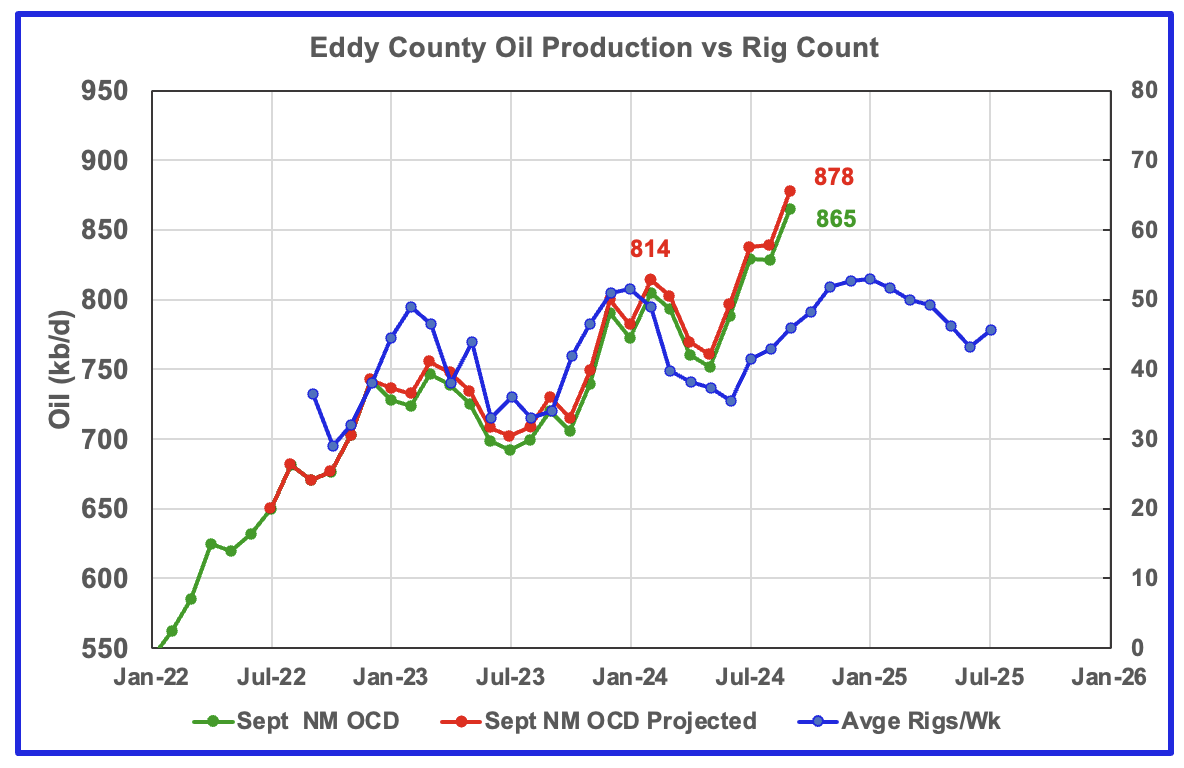
Eddy County oil production first peaked in February 2024 at 814 kb/d. After dropping for three months, the number of wells drilled increased and so did oil production. In September oil production increased by 39 kb/d to 878 kb/d.
The blue graph shows the average number of weekly rigs operating during a given month as taken from the above weekly drilling chart. The rig graph has been shifted forward by 8 months to roughly coincide with the increase in the production graph starting in October 2023.
If production were to follow the rig count trend going forward, production should continue to rise for the next few months and begin to roll over closer to November, provided it continues to track the rig count.
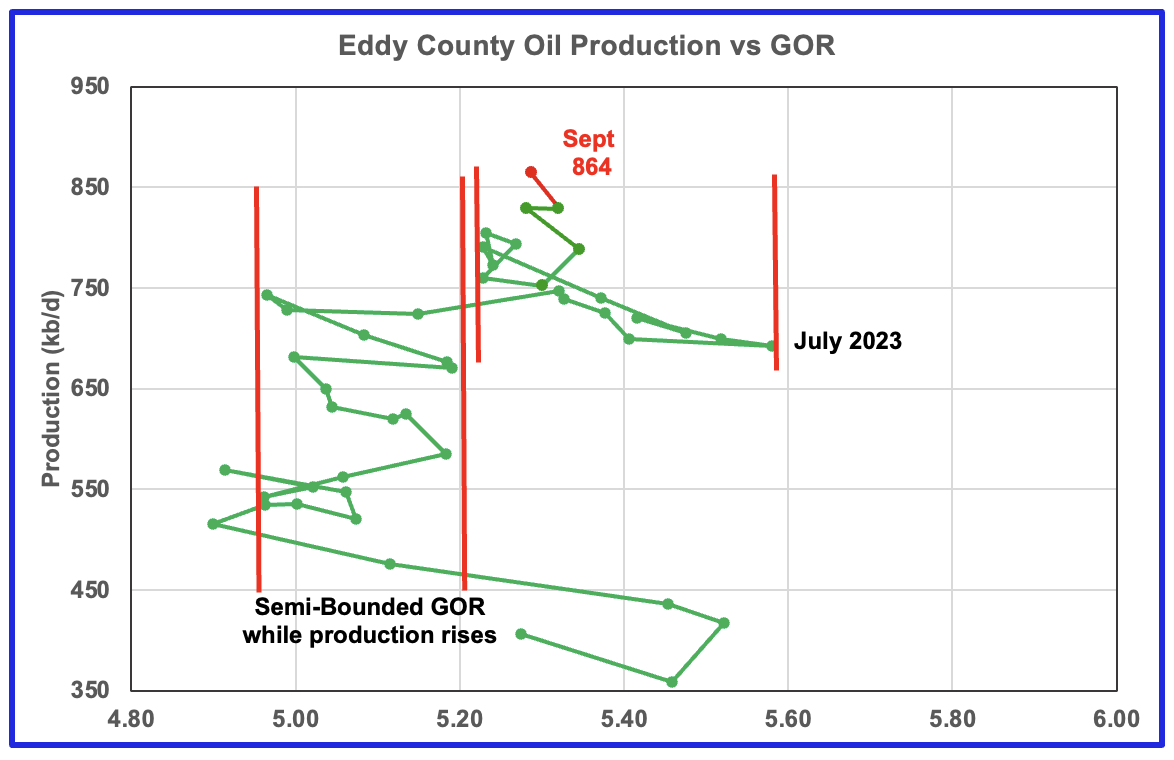
The Eddy county GOR pattern is similar to Lea county except that Eddy broke out from the semi bounded range earlier and for a longer time and then added a second semi bounded GOR phase. For September production continues to increase and stay within the second semi-bounded region
Texas Permian
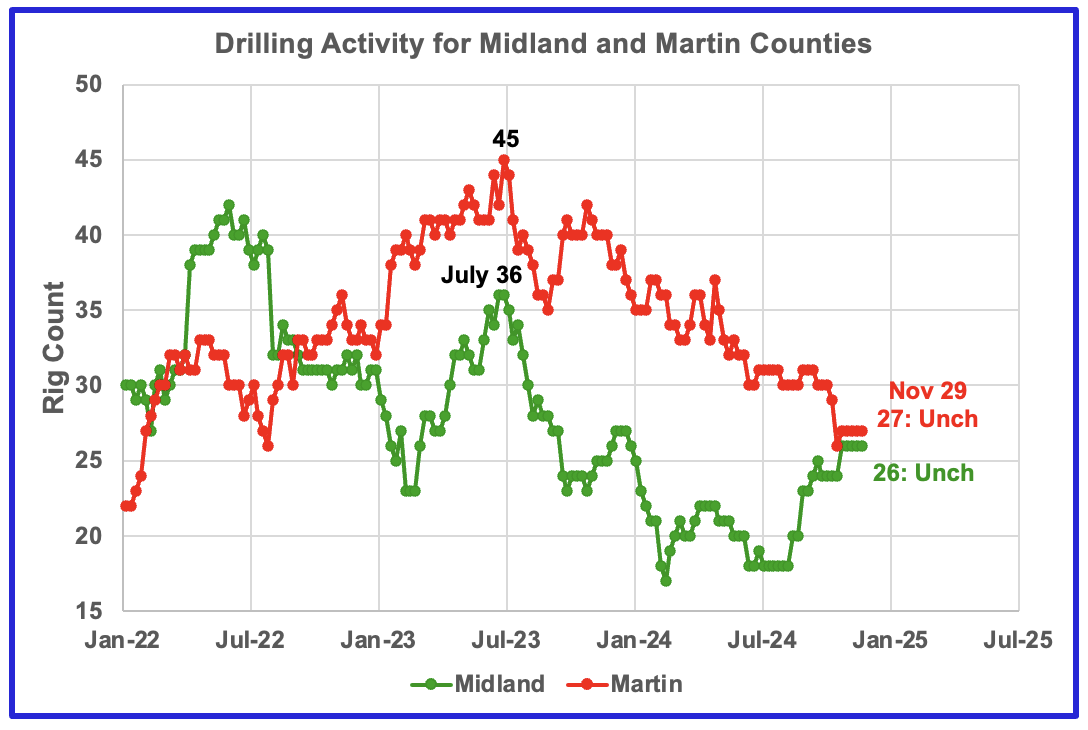
The Midland county rig count has been rising since July and is up 8 to 26. The opposite is true for Martin county. On November 29, 27 rigs were operational, down from 45 in July 2023.
Texas County Oil Production
The Texas RRC made significant revisions to its production data in their October report and the projections presented in this section in last month’s post were not shown because those revisions had a significant effect on the projections. For this report most of the RRC revisions have returned to normal so that projections can be made again. However in a few cases the projections are still questionable.
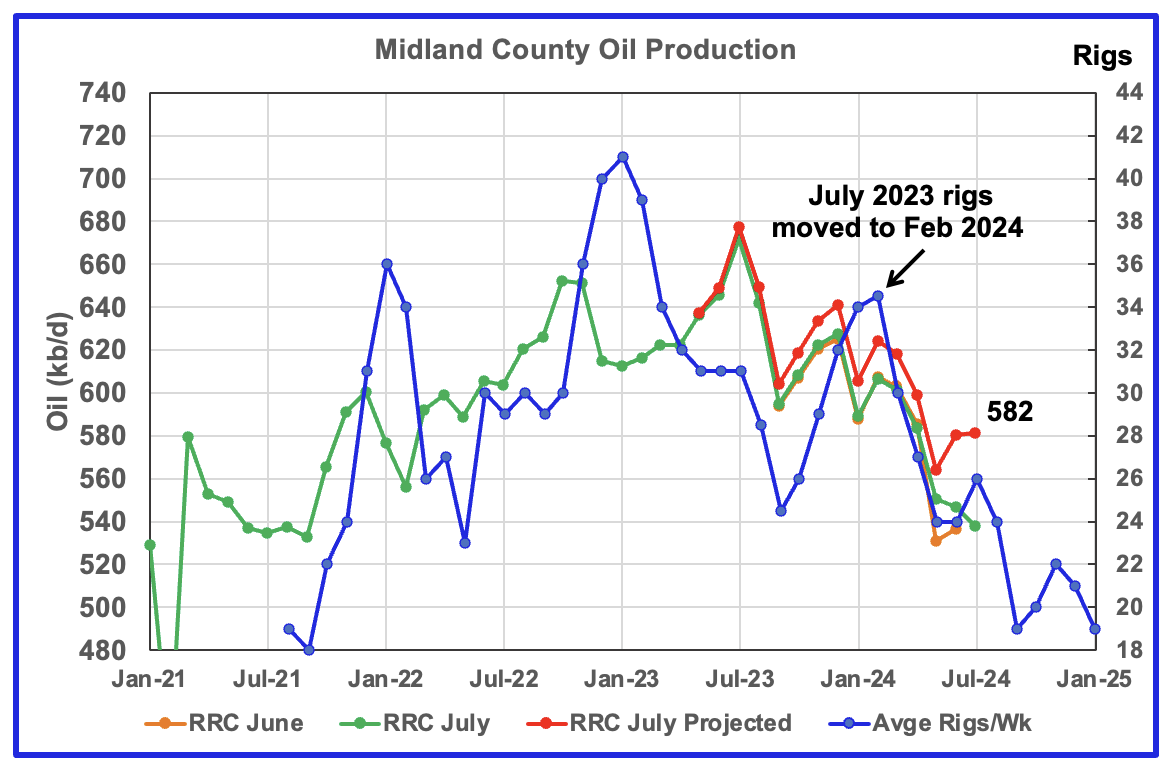
Midland July oil production chart for comparison with September chart below.
For many months in previous posts, Midland county production has been declining. The revisions in the RRC September update have turned the decline into rising production in the next chart.
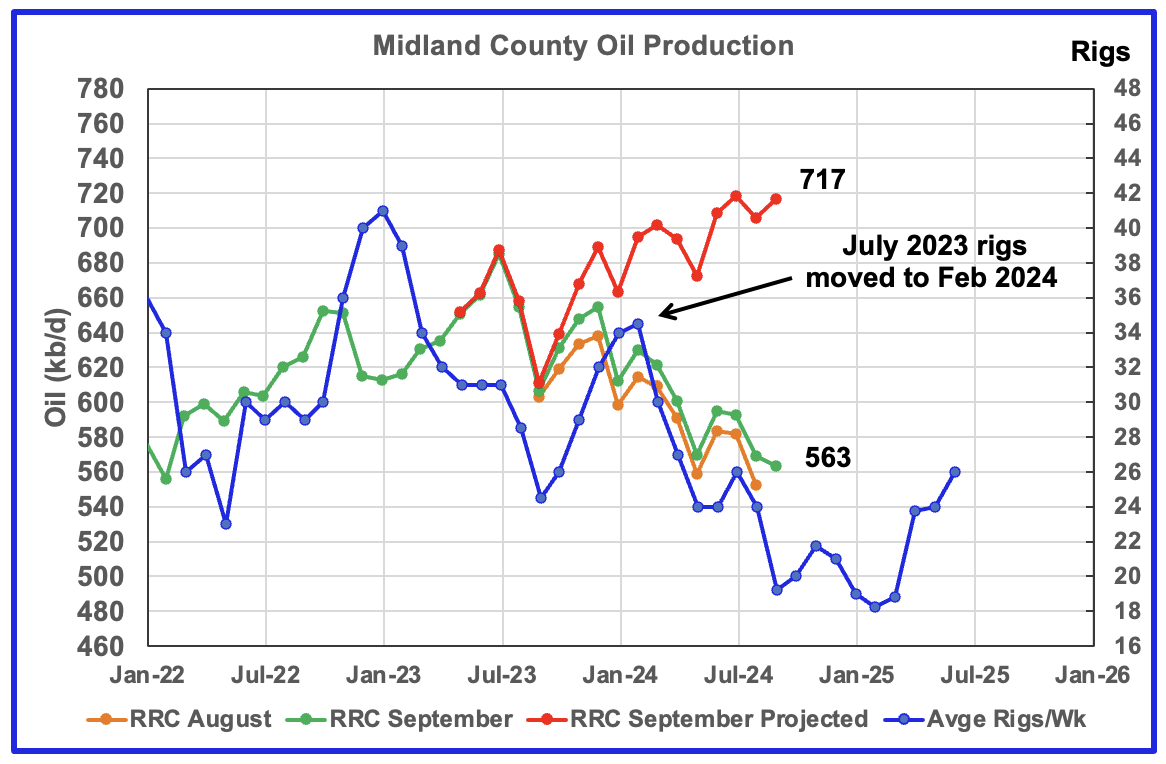
The orange and green graphs show the production reported by the Texas RRC for August and September.
Midland County’s slow and steady declining oil production phase started in August 2023. The green graph shows September’s preliminary production as reported by the Texas RRC. Midland county’s September preliminary production reversed the dropping trend that started in August 2023 and increased the projected production to a new high of 717 kb/d. This is not real and credible. The increase is due to revisions to past production that is causing a significant error in the projection.
The orange and green graphs show the production reported by the Texas RRC for August and September.
The blue graph shows the average number of weekly rigs operating during a given month as taken from the weekly drilling chart. The rig graph has been shifted forward by seven months. So the average 34.5 Rigs/wk operating in July 2023 have been moved forward to February 2024 to show the possible correlation and time delay between rig count, completions and oil production. If the seven month shift in the rig count is approximately correct in that oil production can be tied to the rig count, oil production in Midland county should increase for a month or two before resuming its decline, according to the preliminary August and September data.
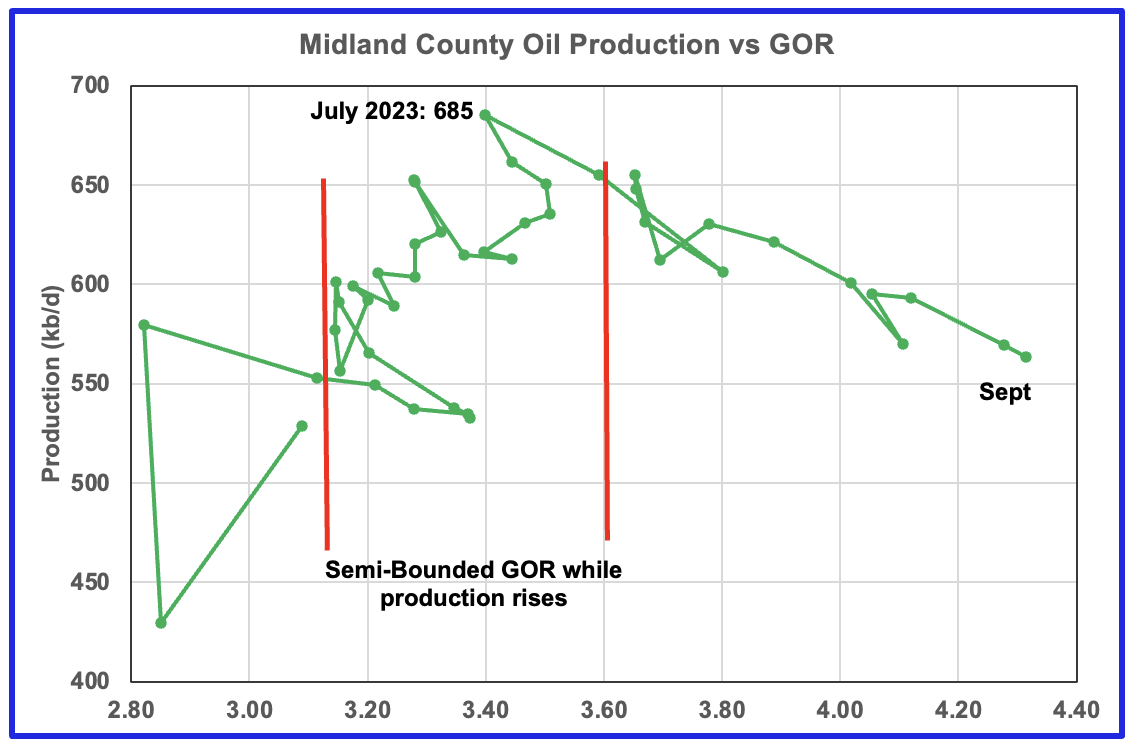
The production revisions do not affect the GOR. For September the GOR ratio continues to increase.
With Midland county deep into the bubble point phase, oil production has dropped significantly from July 2023 as the GOR continues to increase. The oil production and GOR shown in this chart is based on the RRC’s preliminary November production report. Note that while the last few months are subject to revisions, the July 2023 production has been steady for a number of months.
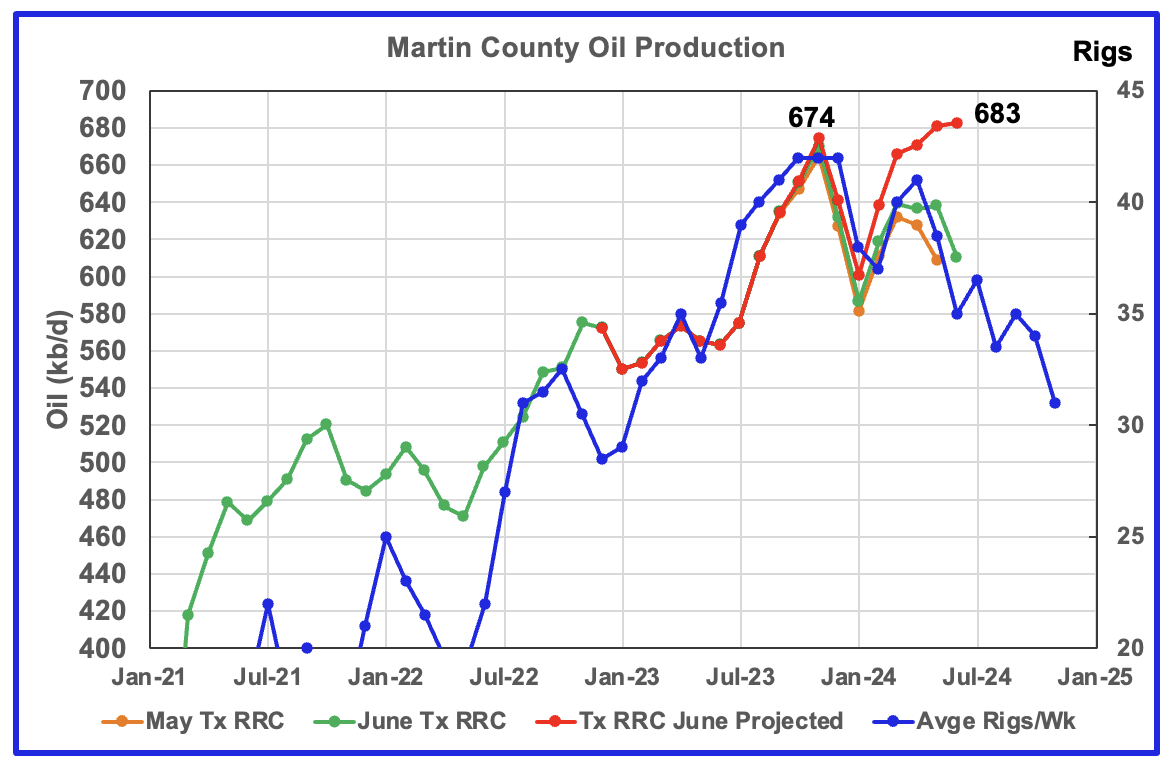
Above is the Martin county oil production chart posted in June. It was the second month that was hinting at a production peak for Martin county. Also it was the first month in which the GOR moved out of the semi-bounded GOR region. The subsequent July and August charts were affected by significant revisions to the earlier production data and as a result the projected results were not credible. This chart has been posted to compare with the September oil production chart below which appears to confirm that Martin county has entered the declining phase.
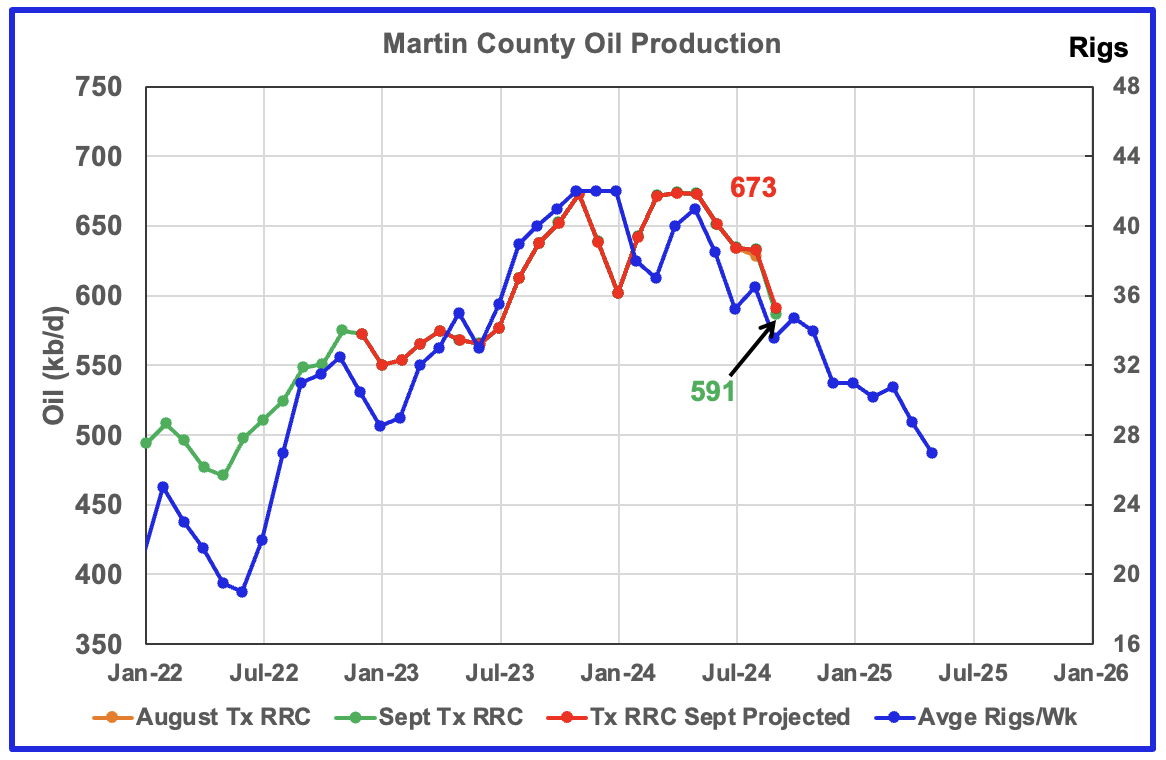
Martin County has entered its declining phase. Martin county oil production dropped by 42 kb/d in September.
Texas’ RRC oil production for Martin County was showing initial signs of peaking in November 2023 but was then followed by declining production into January 2024. Since June, production has been tracking the decreasing rig count. While March, April and May production was flat, June saw the beginnings of declining production.
The red graph is a production forecast which the Texas RRC could be reporting for Martin county about one year from now as the Texas RRC reports additional updated production information. This projection is based on a methodology that used August and September production. The green graph shows oil production reported by the Texas RRC for September and September production is barely visible at 591 kb/d.
The blue chart shifts the rig count ahead by 6 months. Note the three flat spots in the November, December and January rig count and similar flat spots in production a few months later.
A few more months of good data is required to conform that Martin county oil production is in decline.
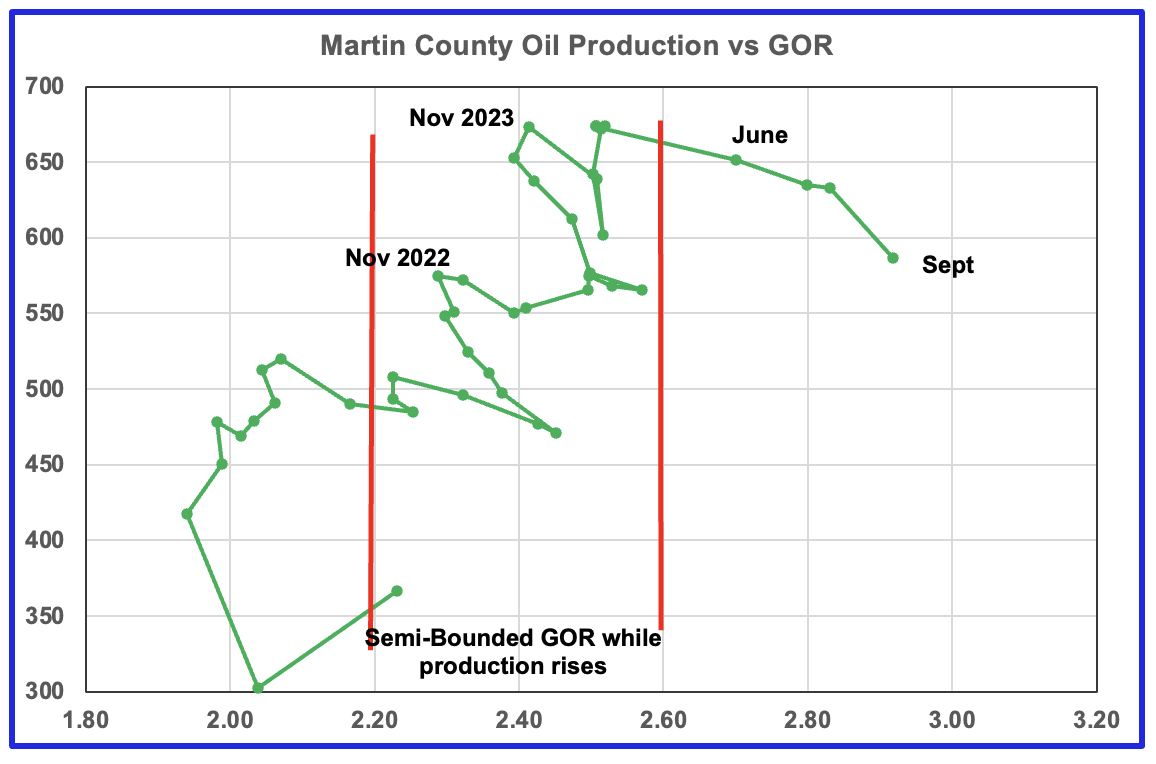
Martin county’s oil production after November 2022 increased and at the same time drifted to slightly higher GORs within the semi bounded range. However the June GOR saw its first move out of the semi bounded region. September’s preliminary gas and oil production indicates that production was lower than August and the GOR has continued to move to higher values.
Martin county has the lowest semi-bounded GOR of the four counties at a GOR of close to 2.60 but for September it has jumped to 2.92 and clearly out of the semi-bounded region. Martin County has now entered the bubble point phase that should result in a dropping oil production trend.
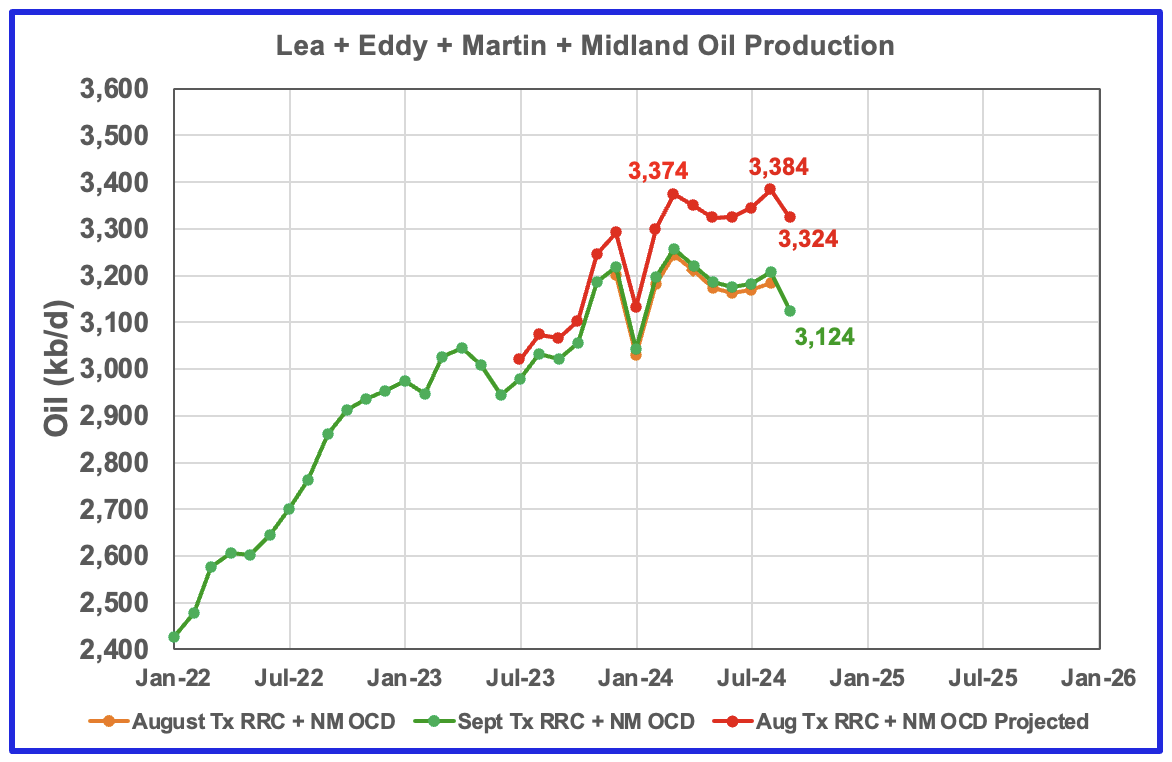
This chart shows the total oil production from the four largest Permian counties. Assuming that current September Permian production is close to 6,400 kb/d, these four counties account for close to 50% of the total. If their combined production has peaked, the Permian has peaked. A few more months of data is required to determine if the Permian has peaked or is on a plateau.
September production dropped by 64 kb/d to 3,324 kb/d. The August and September initial production data is shown in the orange and green graphs respectively. The red graph uses the August and September data to project an estimate for the final September production. The decrease in September is due to the drops in Lea and Martin counties which overcame the incorrect Midland rise.
Findings
– Lea County oil production is following the rig count graph and may have peaked.
– Eddy County oil production initially peaked in February 2024 but has now started a new increasing phase as it follows the uptrend in the rig count and it has exceeded its previous February peak.
– Midland county peaked in July 2023.
– Martin County has entered its declining phase.
– Three of the four largest Permian oil producing counties have now entered their declining phase. It will take a few more months to confirm this forecast.
A note on assumptions. In the above charts of production vs rig count, the rig count has been shifted forward by 6 to 9 months and the assumption is made that production follows rig count. The underlying assumption for doing that is that no more or very few DUCs are being used. Also implicit in making the above calls is that the drillers and frackers are using the latest technology, i.e. 3 mile laterals, max proppant and chemicals in new wells and some refracs. I have no basis for assuming that all drillers are using maximum/latest technology.
Texas District 8
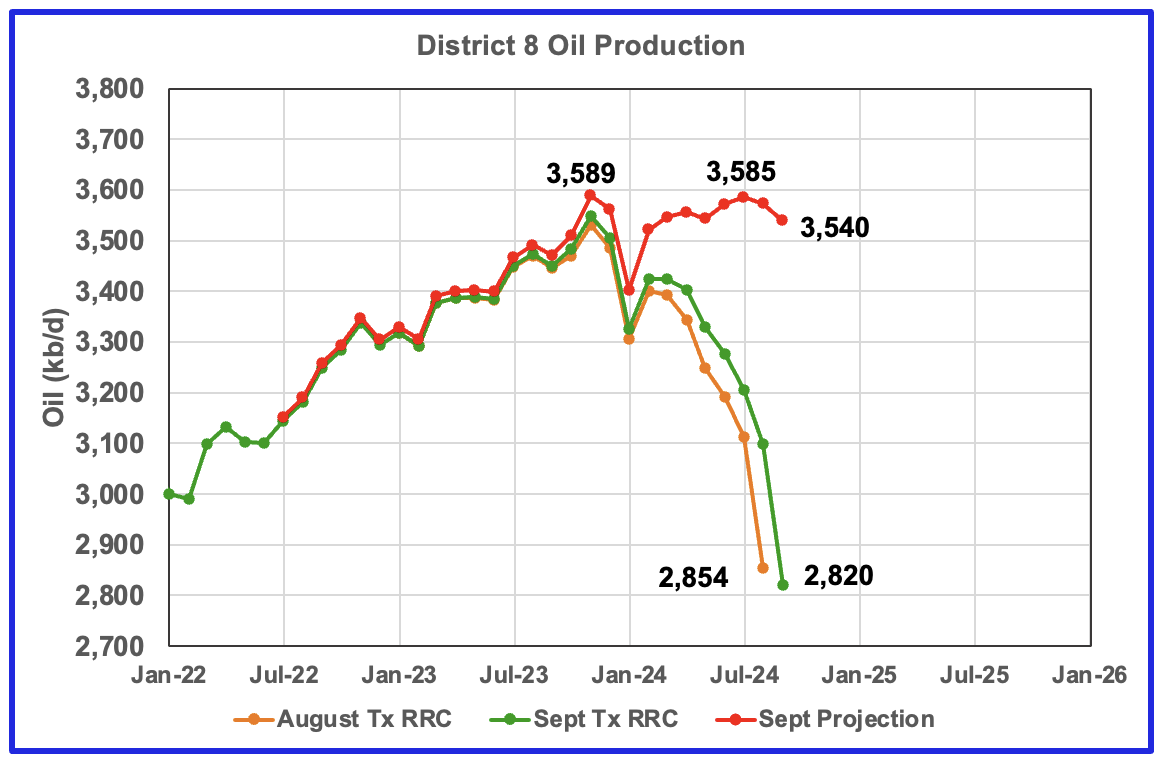
Texas District 8 has peaked.
Texas District 8 contains both the Midland and Martin counties. Combined these two counties produce close to 1,200 kb/d of oil. While these two counties are the two largest oil producers, there are many other counties with smaller production, such as Reeves #3, Loving #4 and Howard #5 that in total produced 3,589 kb/d of oil in November 2023. Essentially the Midland and Martin counties produce close to 1/3 of the District 8 oil.
This chart shows a projection for District 8 oil production. The red graph, derived from the August and September production data indicates that oil production in District 8 has peaked. September production dropped by 33 kb/d to 3,540 kb/d.
The orange and green graphs show the production reported by the Texas RRC for August and September. Note that the last month in the September production graph is lower than the last month in the August production graph. This is why the projection shows September’s production is lower than August’s.
District 8 accounts for more than 50% of Texas production. With September’s production projection being almost the same as November’s 3,589 kb/d, it is difficult to understand how the EIA’s Texas production has continued to increase since February. However July saw the first drop in the EIA’s Texas oil production since January. Has District 8’s dropping production trend finally started to show up in Texas’ overall production? The next few months will tell the tale.
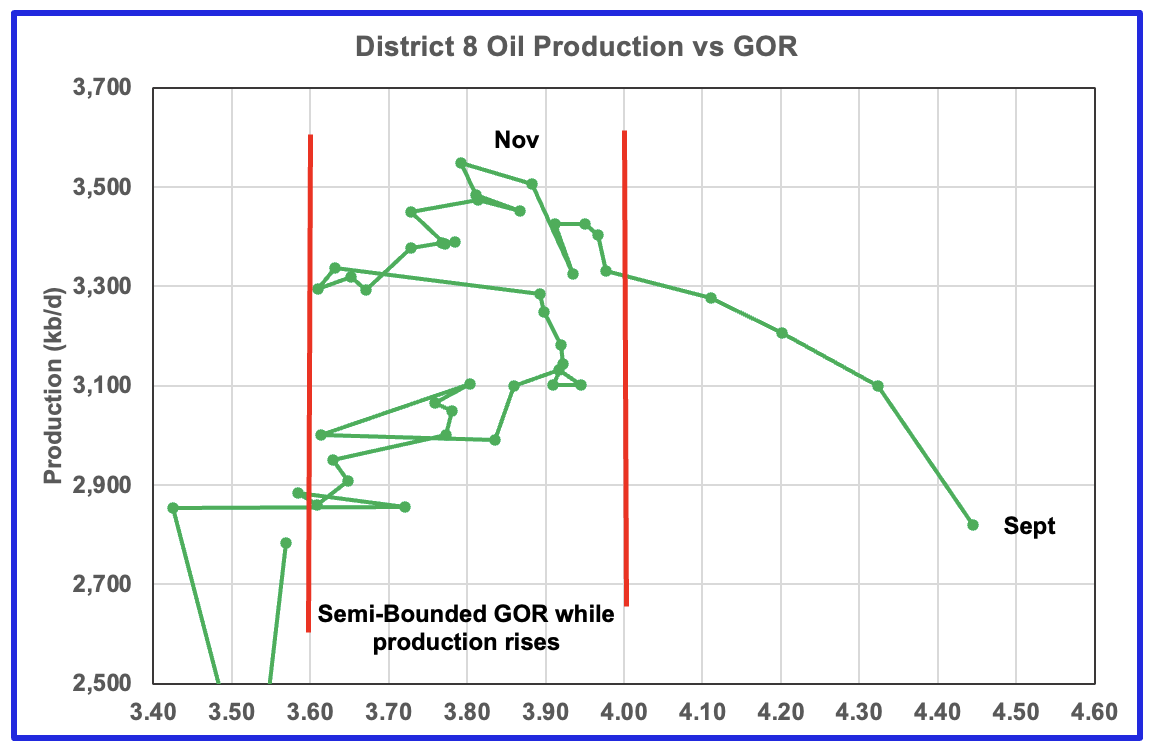
Plotting an oil production vs GOR graph for a district may be a bit of a stretch. Regardless here it is and it seems to indicate many District 8 counties may well be into the bubble point phase.
Oil Production and GOR Charts for the Next Three Biggest Oil Producing Counties in Texas
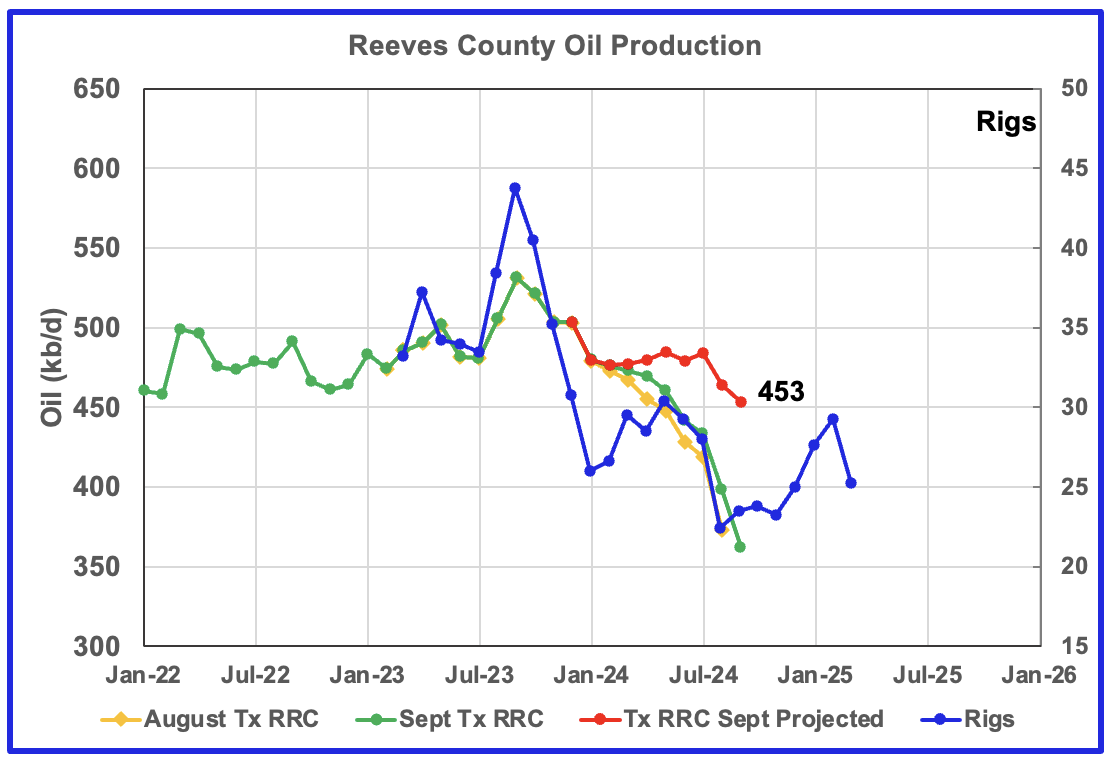
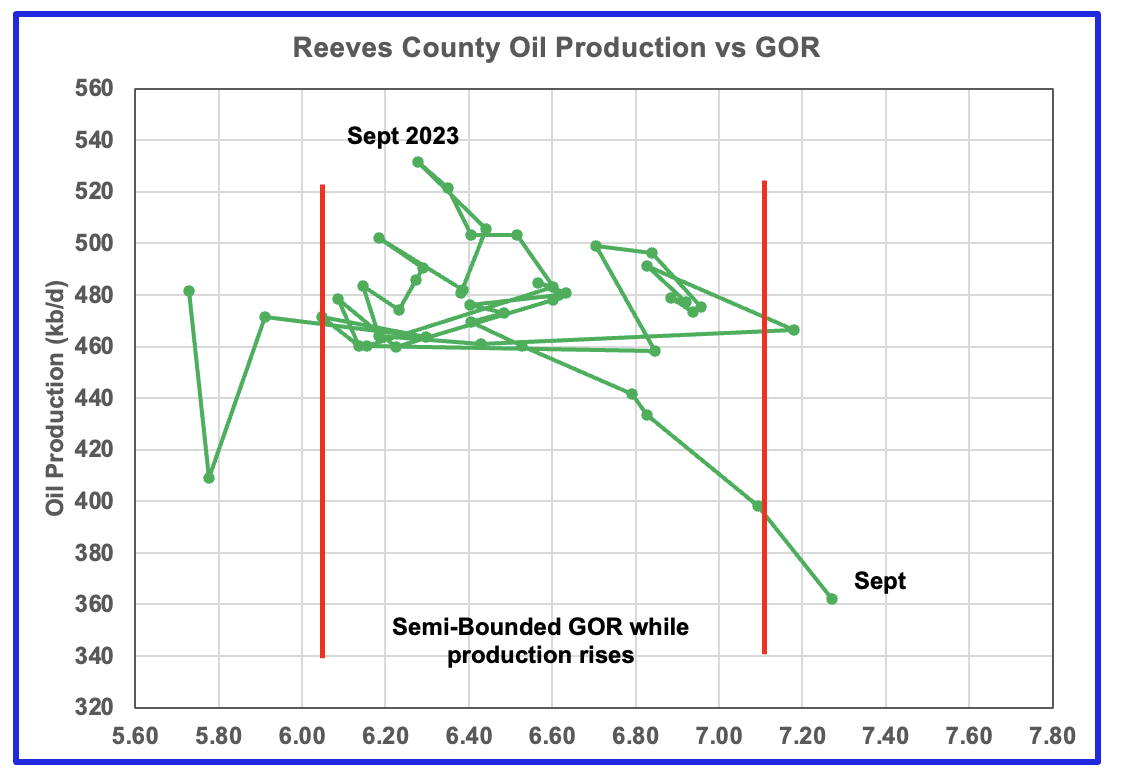
Reeves county appears to have peaked. Note the rapid movement of the GOR from September 2023 to September 2024 to higher GORs and dropping production.
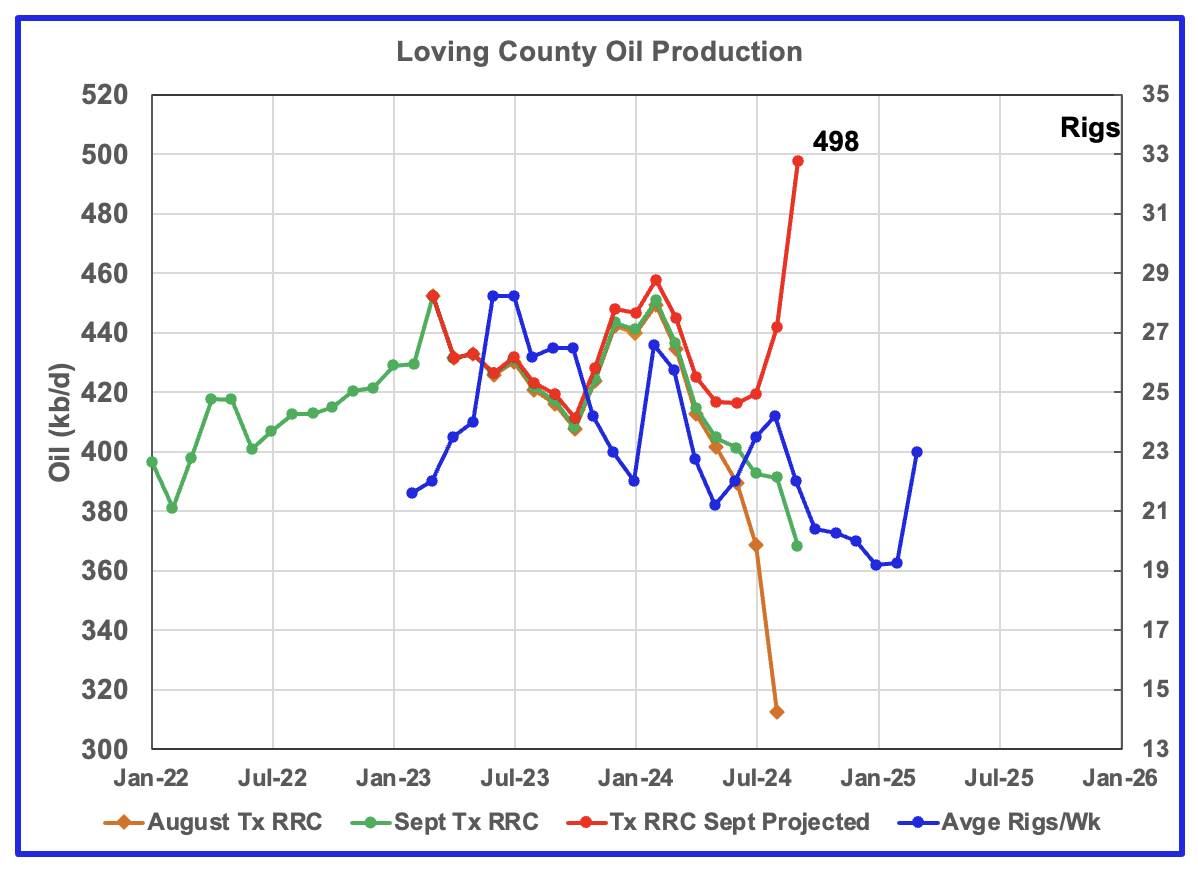
The rise in production over the last three months is due to large revisions to the last three months. Note the large gap between the green and orange graphs over the last three months. There could be an increase in production due to the increase in the rig count from June 2024 to August 2024 but not that much. I think Loving oil production peaked in February 2024. Let us check back when the October data is released.
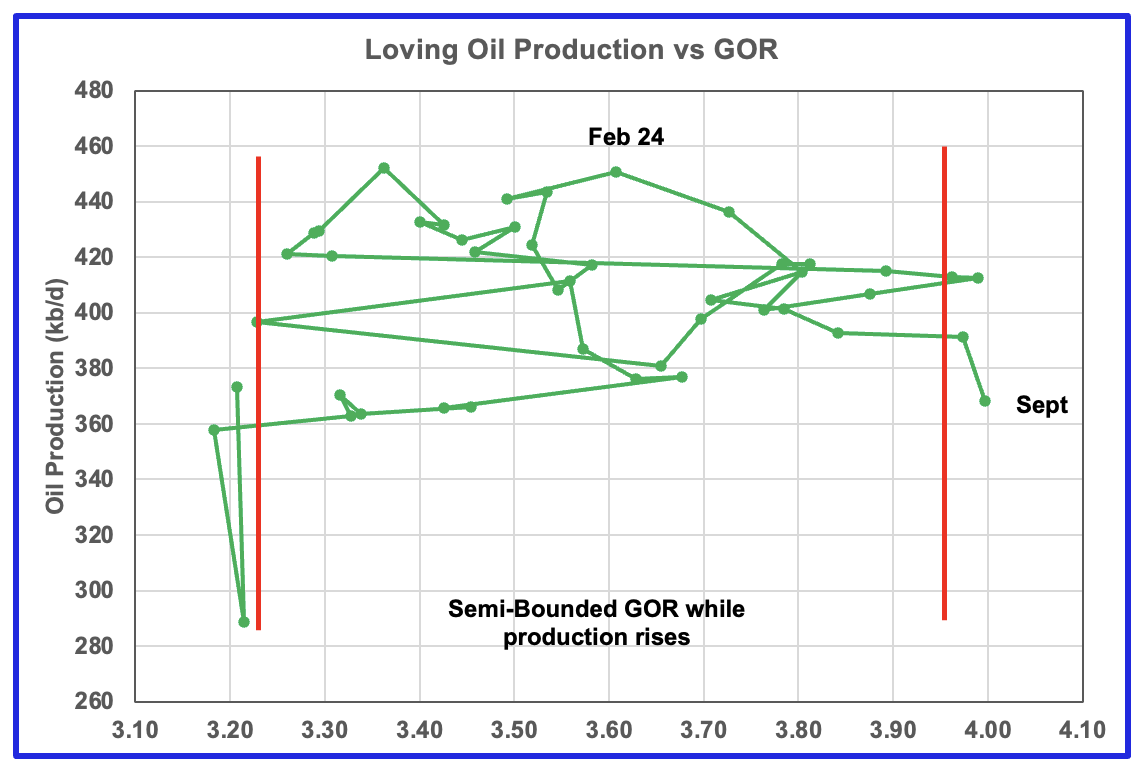
Note the large increase in the GOR from February 2024 to September 2024.
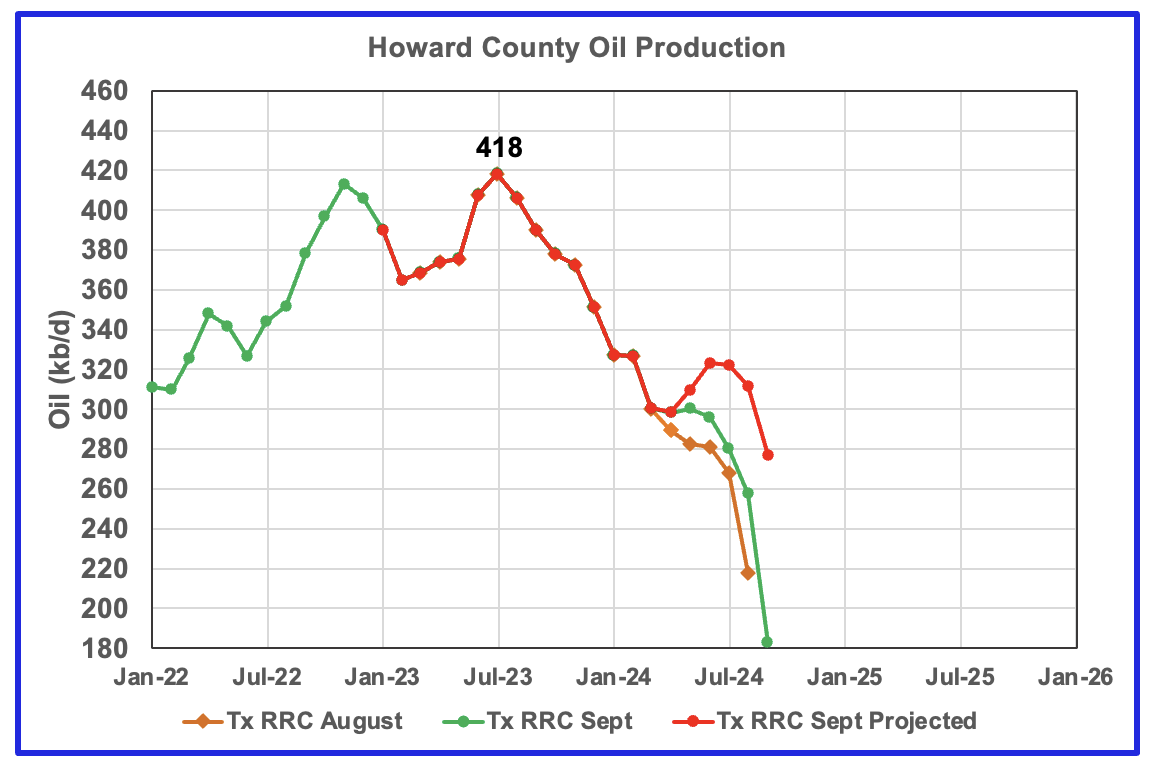
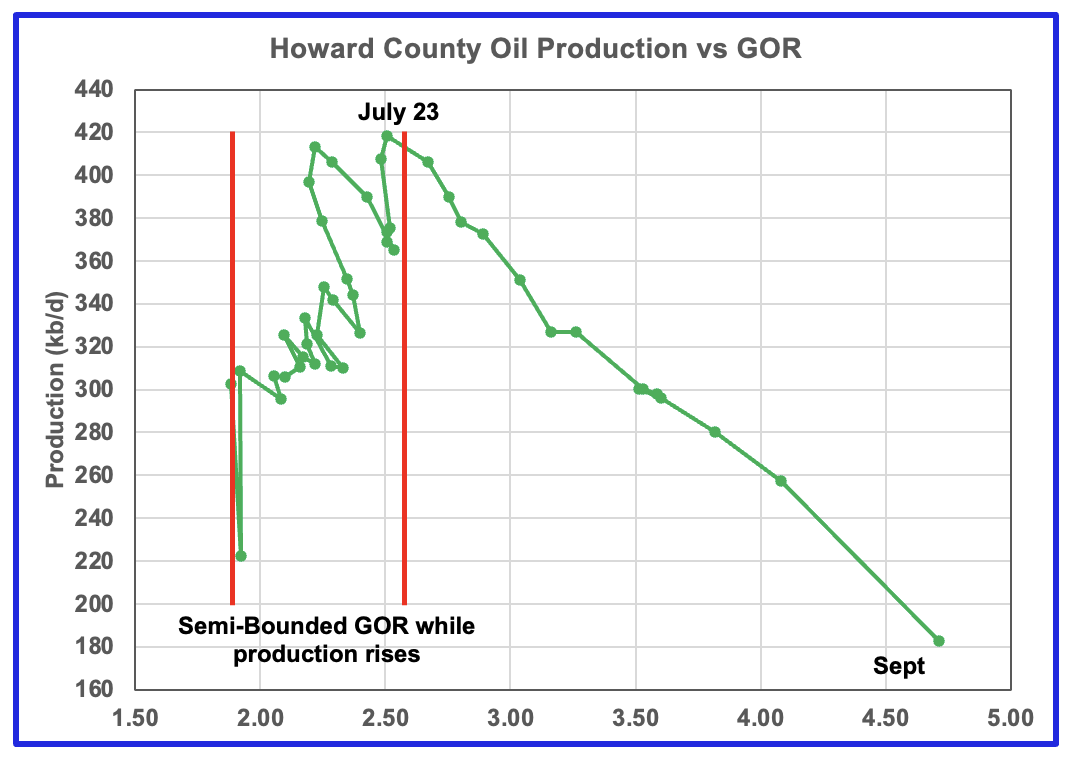
Howard county oil production peaked in July 2023.
Horseshoe Wells
According to this article: Matador Resources drills pilot project of U-shaped laterals in Loving County
In loving county where well laterals are limited to 1 mile, they turn the drill 180° to convert into a 2 mile lateral.
Dallas-based Matador Resources said last week it drilled a pilot project of two wells on its Wolf acreage in Loving County using a “horseshoe” design. Matador drilled a two-mile lateral on a section only large enough for a traditional one-mile lateral. The U-shaped lateral drills out part of the wellbore, makes a 180-degree turn, and drills back toward the rig to double the lateral length.
Glenn Stetson, executive vice president, said Matador experienced successful development on surrounding acreage. Matador expects to save $10 million with the two U-shaped laterals compared to four one-mile laterals on the same acreage. Matador expects to average 9,800 feet per well this year compared to 8,700 feet in 2020.
According to this article: Shell Drilled a “Horseshoe” Well in the Permian Basin in 2019.

A 3D view of the Neelie 4H well in Loving County, Texas based on publicly available drilling survey data. It is likely to be remembered though as the “horseshoe well” because of its distinctive 180° turn that creates two lateral sections at a depth of more than 11,100 ft. Source: 3Dwellbore.com
Drilling Productivity Report
The Drilling Productivity Report (DPR) uses recent data on the total number of drilling rigs in operation along with estimates of drilling productivity and estimated changes in production from existing oil wells to provide estimated changes in oil production for the principal tight oil regions. The new DPR report in the STEO provides production up to October 2024. The report also projects output to December 2025. The DUC charts and Drilled Wells charts are also updated to October 2024.
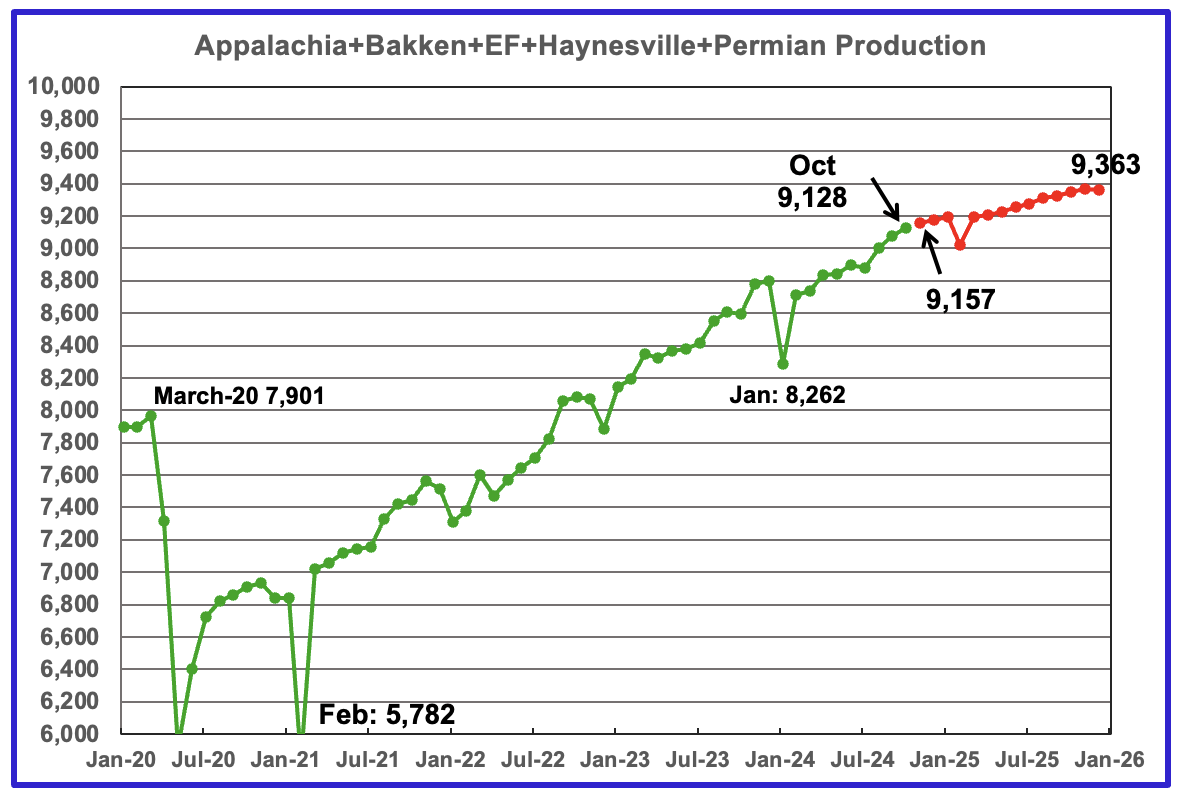
The October 2024 oil production for the 5 DPR regions tracked by the EIA is shown above. Also a projection by the STEO to December 2025 has been added, red markers. Note DPR production includes both LTO oil and oil from conventional wells. DPR oil production for the Anadarko and Niobrara regions is no longer available.
The DPR is reporting October oil output in the five regions increased by 53 kb/d to 9,128 kb/d. Production is expected to grow by 29 kb/d in November to 9,157 kb/d. By December 2025 production is expected to reach 9,363 kb/d. This is 115 kb/d lower than forecast in the previous update.
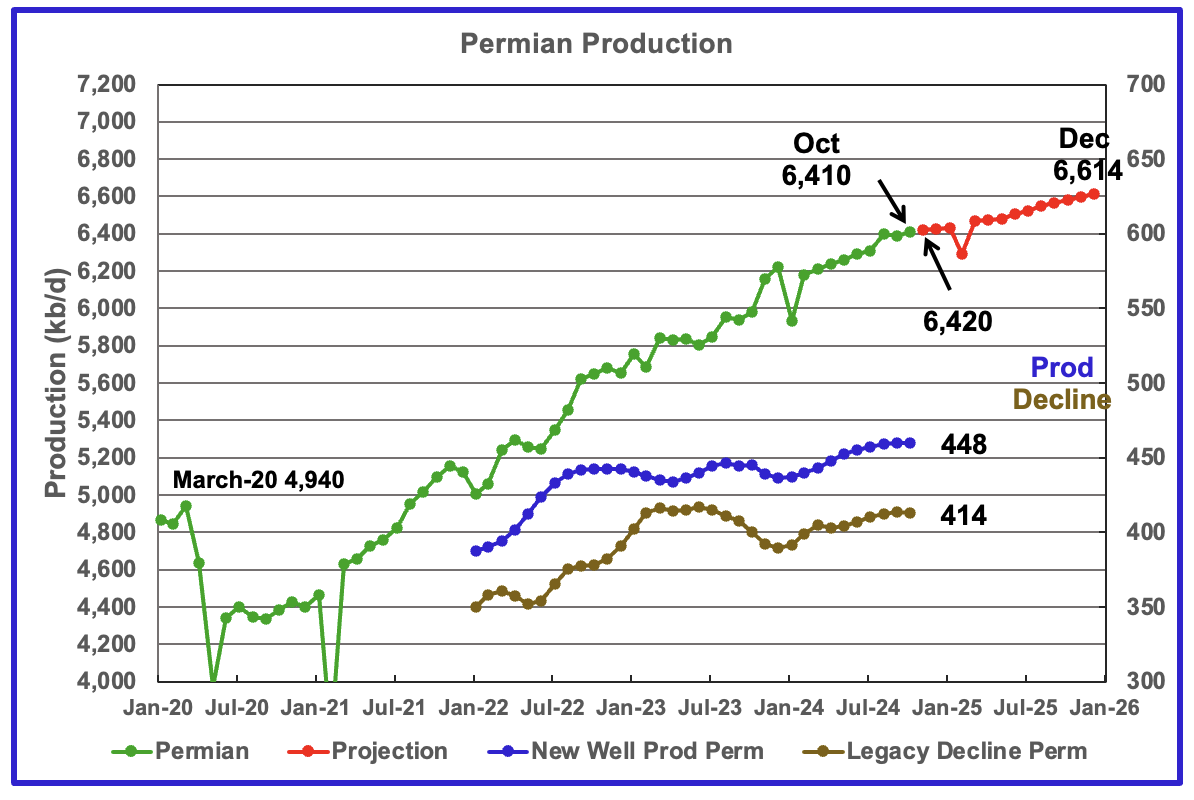
The EIA’s October DPR report shows Permian output increased by 22 kb/d to 6,410 kb/d. By December 2025 output is expected to be 6,614 kb/d.
Production from new wells and legacy decline, right scale, have been added to this chart to show the difference between new production and legacy decline.
According to the new wells and legacy decline graphs October production should have increased by 34 kb/d which is higher than the actual 22 kb/d reported.
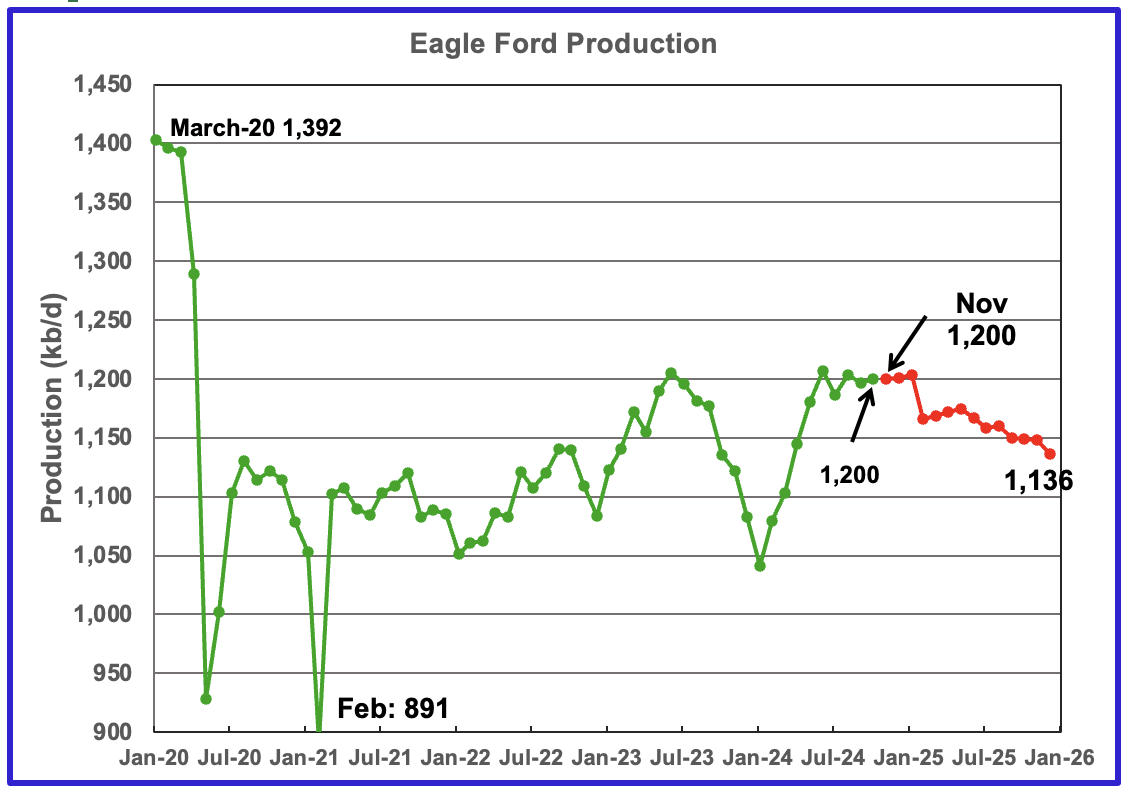
Output in the Eagle Ford basin has been increasing since January 2024 and may have peaked in June 2024. October production rose by 3 kb/d to 1,200 kb/d. Production is projected to decline going forward with output in December 2025 expected to be 1,136 kb/d. November production is forecast to be unchanged from October.
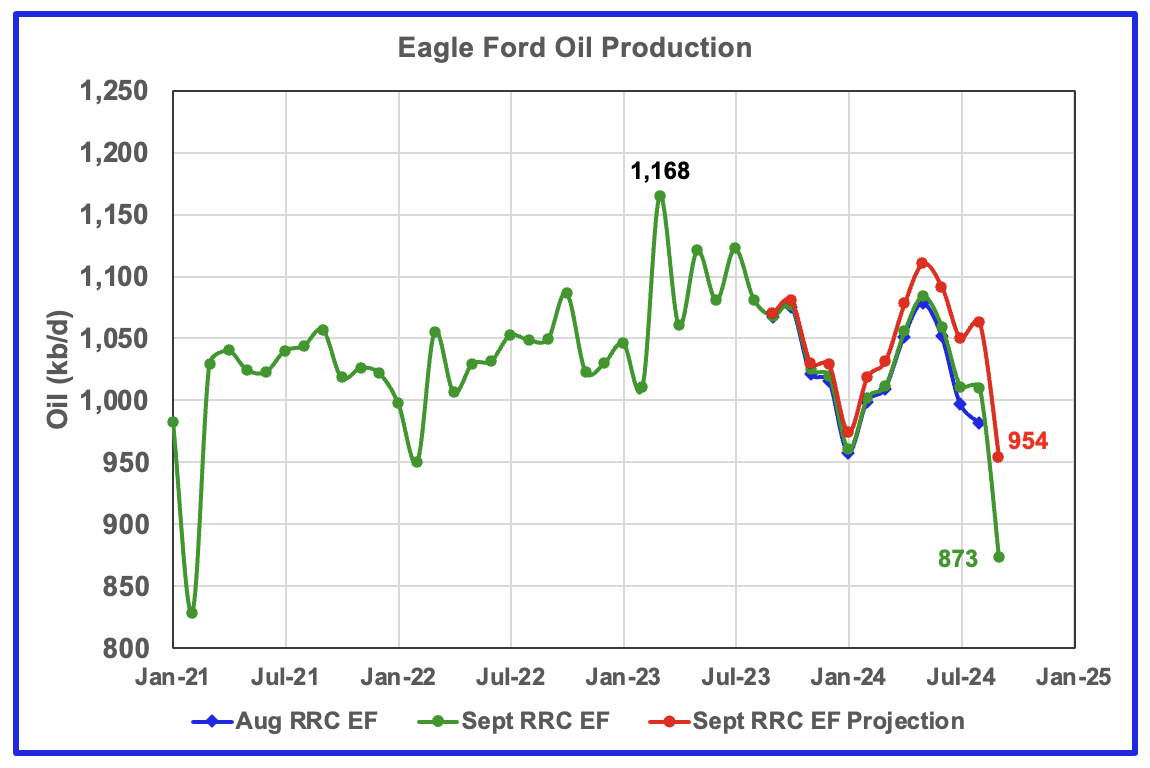
This Eagle Ford oil production chart uses Texas RRC production for Districts 1 and 2. These two districts cover most of the Eagle Ford basin. The red graph is a projection based on August and September production. The latest production data indicates that the Eagle Ford basin is in decline.
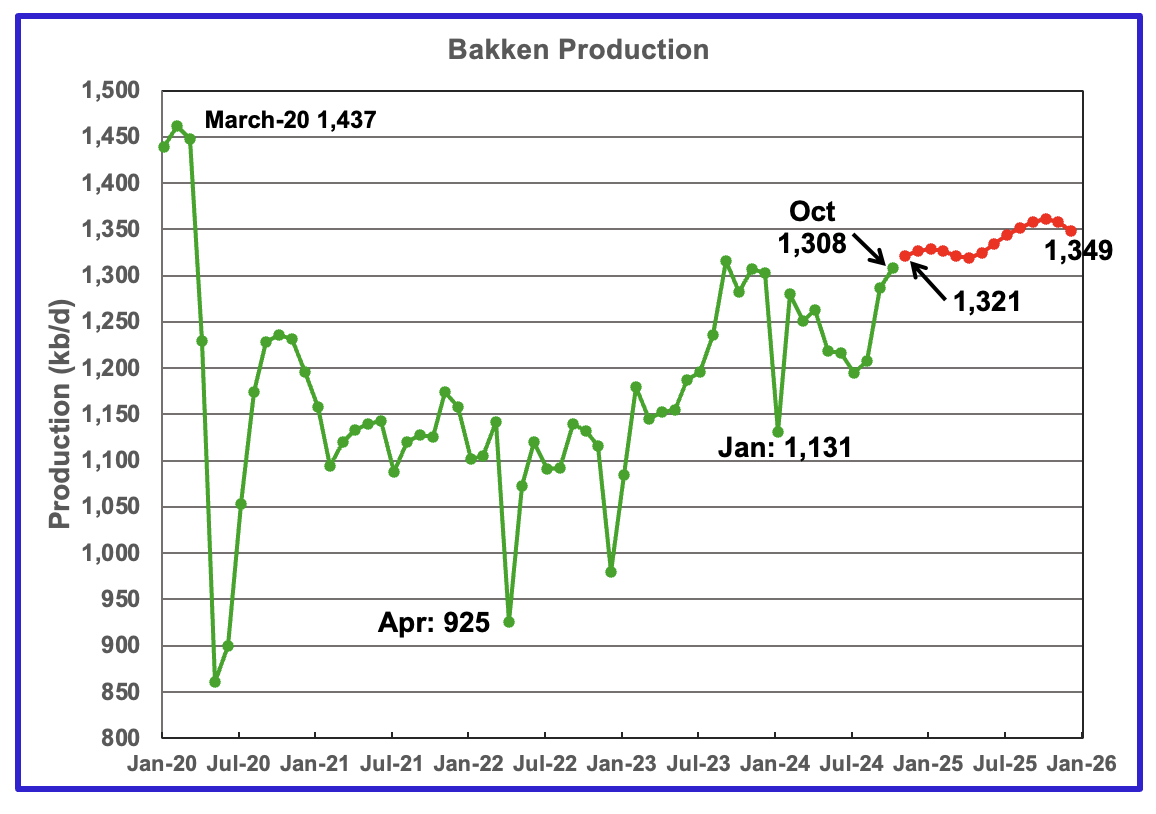
The DPR/STEO reported that Bakken output in October rose 22 kb/d to 1,308 kb/d. The STEO projection out to December 2025 shows output varying between 1,325 kb/d and 1,370 kb/d over the next 14 months.
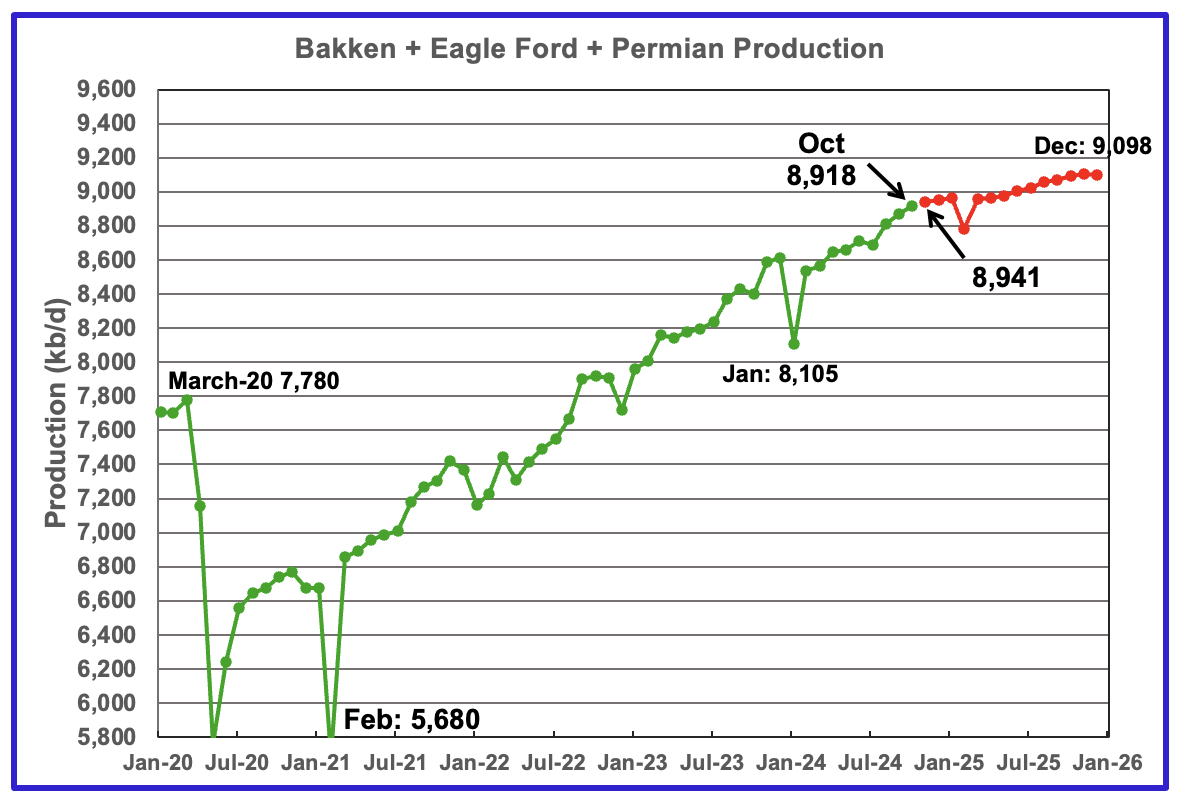
This chart plots the combined production from the three main LTO regions. For October output rose by 47 kb/d to 8,918 kb/d. Production in December 2025 is expected to reach 9,098 kb/d. This is 207 kb/d lower than forecast in the previous report.
DUCs and Drilled Wells
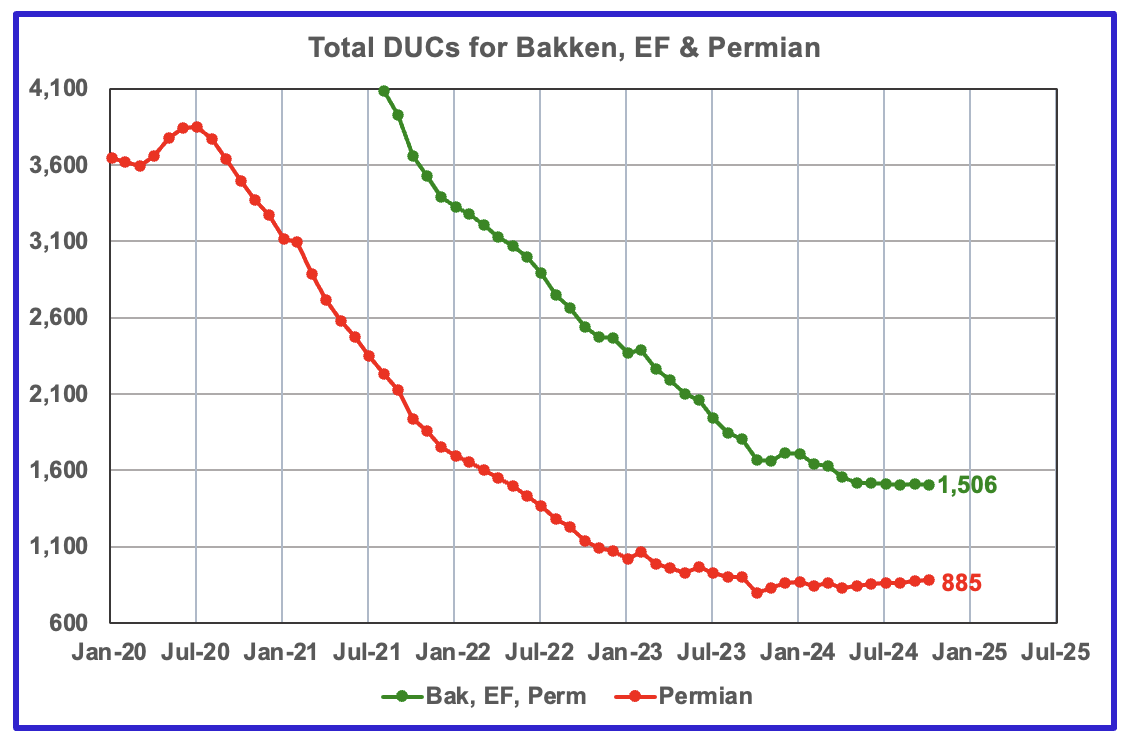
The number of DUCs available for completion in the Permian and the three major DPR regions has fallen every month since July 2020. October DUCs decreased by 2 to 1,506. In the Permian, the DUC count increased by 8 to 885.
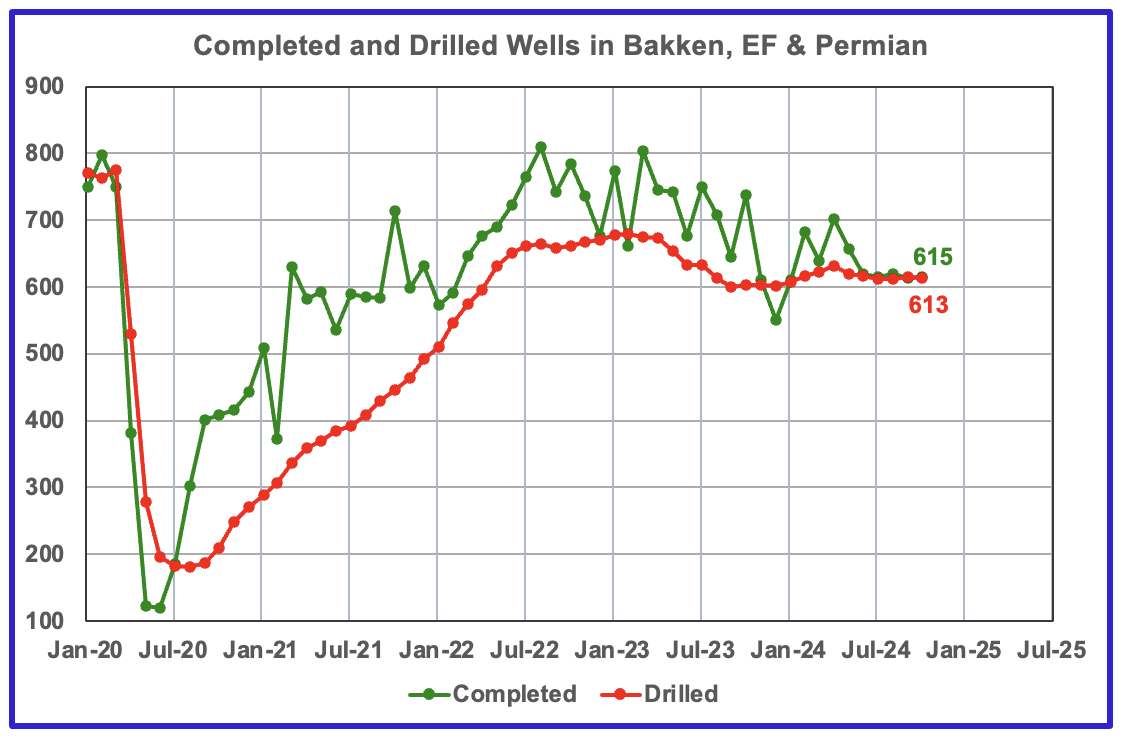
In the three primary regions, 615 wells were completed and 613 were drilled, i.e. only 2 extra DUCs was completed.
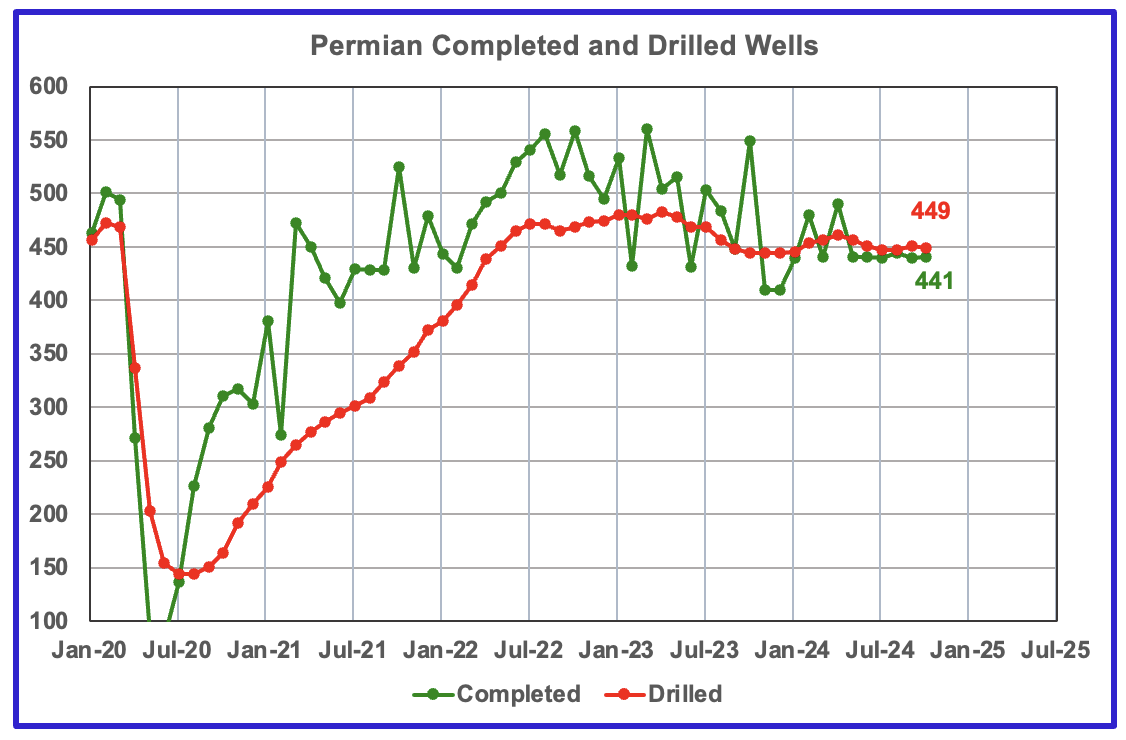
In the Permian, the monthly completion and drilling rates have been both stabilizing in the 440 to 450 range over the last 6 months.
In October 2024, 441 wells were completed while 449 new wells were drilled. This is the sixth month in which the number of wells drilled exceeded the number of completed wells.
On the face of it, Howard County declined 80,000 BOPD in September? Likely to be revised to 40,000 BOPD down in one month. Nevertheless, assuming the latter, it’s a 40% per annum decline rate. Impressive.
David
That is what the red projected graph is showing, i.e. about 6 months from now Howard county will be reporting that Howard county dropped by 40 kb/d in September 2024. From July 2023 to July 2024, production dropped by 100 kb/d or close to 25%, according to the red graph.
Ovi,
Nice post thanks.
I would be careful about declaring a peak in Permian output. This depends on future oil prices and the rate that new wells are drilled and completed. If we assume DUC count remains stable, then completions will depend on the number of new wells drilled (with a lag corresponding to perhaps 8 months from start of drilling to start of oil production from the well), so under these assumptions the rig count will be the key metric. Potentially the Permian rig count will increase in the future (especially in a high oil and natural gas price scenario). If we see future prices increase, we may also see increased Permian output.
Dennis
Thanks
The nice thing about being on this site is that we are not part of the main stream media (maybe someday) and can take a bit of risk in our predictions. At the same time I have couched my words with a bit of caution.
“If their combined production has peaked, the Permian has peaked. A few more months of data is required to determine if the Permian has peaked or is on a plateau.
The early clues that production was peaking in Lea, Midland and Martin started appearing between July 2023 and January 2024 in both the production data and the increasing GOR. Eddy was a surprise but the early indication that production would grow was in the rapid rise of the drilling starting last October. I wish that someone with much better knowledge than I have could explain the source of this new Eddy production, i.e. is it a new bench or a new Tier 1 area within Eddy and how big it is.
I agree that the price for WTI could affect the amount of drilling. However looking specifically at the rig count of the four counties, Midland and Martin peaked in July 2023 while Lea peaked in August 2023. The only exception is Eddy which bottomed in October 2023 and then started its run up to 55 in March this year.
Attached is a price chart for WTI. As you can see WTI was $70/b in July 2023 and reached a high of $93.68/b on September 27, 2023. Those higher prices had little to no influence on the rig count in three of the four counties, Eddy being the exception. However I think that the rig increase in Eddy is more related to finding a new Tier 1 area/bench.
Looking forward to getting new data for the next three to six months to clarify this question of whether the Permian and the US are close to peaking.
Hi Ovi,
I think producers react to longer term prices such as the 12 month average more than daily prices. Here is a scenario with a Permian peak in September 2026 which assumesthe rig count remains at about the current level until April 2036 and then starts to decline. I do not claim that prices will increase, only that it is possible.
Note that the small increase in the Permian scenario shown above suggests a near term peak for the US, perhaps by 2025 due to declining output elsewhere in the US. The world will no longer see much oil output growth from the US, should rig counts remain stable.
Oh cool, that peak oil thing has come about finally.
Yeah, like six years ago last month.
Hi Dennis
Personally I think the Permian will peak closer to September 25. Just guessing but I think your model is using the same well profile for all new wells. With the pressure dropping across these counties, I think the IP will drop with time and move the September 2026 date forward.
Ovi,
I assume we’ll profiles deteriorate over time in my scenario after 2022. The rate that wells deteriorate is of course speculative. You might be right, but note that I have used rig counts out to July 2025 with the 8 month lag so about big drop in rig counts would be needed to make the peak coincide with your guess.
Ovi,
Checked in more detail, the wells are assumed have lower EUR of about 3.5% per year starting in 2023, in August 2024 the model scenario has Permian tight oil output (excludes conventional output in the Permian region) at 5723 kb/d and this increases to 5836 kb/d in Sept 2025 and to 5859 kb/d by Sept 2026. The difference between your guess and mine is only 23 kb/d so either could be right and it is more likely that we will both be incorrect (me for sure, perhaps not you). I think the changes in GOR may n part be due to changes in completion rate, older wells in general will have higher GOR, so when completion rate is lower GOR tends to rise for any given county.
Dennis
Thanks for the clarification.
Permian EUR decreases as shown in chart below for my best guess Permian scenario (URR=49 Gb). In Dec 2022 EUR was 432 kbo and by Dec 2032 the average new well EUR falls to 292 kbo. I assume no increase in lateral length after December 2022, further increase in lateral length will only reduce EUR per acre with unchanged well spacing. Longer laterals result in lower EUR per foot of lateral while maximizing output per dollar of capital invested.
Hi Dennis
How much non used excess capacity in terms of rigs and fracs is there available?
Could there be an increase in drilling and completions even if WTI prices rises?
How long to build new rigs and frac?
If all current fleet is deployed and thinking there is a 10% annual decline in the frac fleet (Source: Liberty Energy), what could the Production outlook look like?
Thanks
Jorge,
My impression is that there is plenty of excess rig and frack capacity in the US, so yes there could be an increase in the completion rate. Note that my scenarios have assumed there is not such an increase, that the completion rate remains steady.
Below is a chart with an assumption of a 10% decline in completions after July 2025 (8 month delay of wells drilled through November 2024, that means first output from wells drilled in Nov 2024 occurs around July 2025) for Permian Basin, peak is August 2025 (similar to Ovi’s best guess) at 5830 kb/d (August 2024 output is about 5723 kb/d based on my model).
Note that I do not think the 10% decline scenario is very likely unless there is a significant drop in oil and natural gas prices.
See this Article from July 2023, I don’t think things have improved much since that time.
https://www.ft.com/content/0cf7beaa-2eb7-462e-af3d-56aa1be466c1
Liberty does claim frack capacity is tight and thinks we will see decline in output if the completion rate does not increase (as of most recent quarterly press release.)
Note the decrease in URR to 38 Gb for the Permian when completions decrease by 10% per year from my best guess Permian scenario which has a URR of about 49 Gb.
Thanks
First, as always excellent work by the crew!
But Jorges comment immediately got me thinking Where? So even if the equipment is there is there actually enough viable acreage availible?
The hot spots seems to have been identified and drilled somewhat successfully at this point but the trillion dollar question is what´s in reality left?
On the other hand, other areas globally for fracking might possibly be viable, but from what I understand results have been not that impressive.
Laplander,
There have been various estimates of drilling locations remaining, not clear there is a great answer to this. There are probably 75k locations left to drill with a wide range from 25k to 100k. Many factors will determine how many of the remaining potential locations are viable. Where to put the produced water is am important factor, the price of oil, natural gas, and NGL is another which will depend in part on pipeline capacity, expansion of LNG facilities, technological development, regulation, and demand for oil (which might be affected by the transition to electric transport).
Many moving parts and any forecast of future output is certain to be incorrect.
Jorge,
An alternative model that has the EUR decrease begin in Jan 2025 at about 2% per year, I assume here that the completion rate decreases at 10% per year starting in August 2025 and this continues until December 2048 after that wells decrease at 24 wells per year until reaching zero. Peak is in November 2025 at 6070 kb/d. As before this scenario seems overly pessimistic to me, but if water disposal becomes more of a problem or if prices fall this could be too optimistic.
I should have put the range at 50k to 100k drilling locations in Permian, though tier 1 and 2 locations might be as low as 25k.
“I would be careful about declaring a peak in Permian output. This depends on future oil prices”
Not true according to Gorozen Q3 report which says that US shale oil has peaked.
Joel,
We will see. I think that analysis is incorrect. Below is the EIA estimate through Sept 2024, it is possible that either analysis is wrong, but we do not know which is correct at this point. I would agree with an analysis that suggests US output will probably peak soon, perhaps in 2025 or 2026, higher prices might delay the peak, currently it does not look like oi prices will be rising soon, so 2025 may be the better guess. Note that I focus on the 12 month average rather than just monthly output.
US C+C Trailing twelve month (TTM) Average
Permian Horizontal Oil Rig Count Shifted forward by 8 Months (Jan 2024 on Chart is Rig count from May 2023). The question is what happens after July 2025 if we see an increase in prices.
Real WTI Spot prices in 2024 US$, trailing 12 month average. From Jan 2005 to Dec 2014 the average real WTI spot price was $116.68/bo in 2024 US$ and from Jan 2015 to November 2024 the average real WTI spot price was $72.13/bo in 2024 US$.
Ovi:
Thanks for the work.
In terms of the “fringe” top states, the results, this month (including the three similar states you noted) were:
OH: 108
MT: 77
KS: 76
LA: 75
I do expect LA to recover back to 85 or so and pass the KS/MT riffraff. Its recent drop is from hurricane effect on instate water offshore wells and maybe even some coastal onshore wells.
OH seems to be pulling ahead of the pack, but it remains vulnerable to a price crash. If oil takes a big drop, OH will drop fast, because its population of wells is mostly shale and mostly newer wells (recent growth). In contrast LA and KS are mostly old/conventional and even a lot of stripper wells.
MT is old/shale, but has some recent growth (so not as old as LA/KS), so it may also be vulnerable to a price crash. MT remains interesting since you never hear about it and I would think it would just be declining. But it (while still very small) has had a trend of increase for a while now and is hitting post Covid records. In contrast, ND (while much bigger overall) still remains below the post Covid record.
Nony
Thanks for the detailed info. It is great that you can explain some of those wiggles in those charts.
Great work Ovi and Dennis!
https://www.latimes.com/business/story/2024-08-02/chevron-in-a-blow-to-california-says-it-is-relocating-to-houston
“California’s declining production trend continues. September production dropped by 1 kb/d yp 280 kb/d. ”
How much does Chevron leaving affect California?
I’m guessing not much except for tax revenue.
Los Angele basin produced over 25% oil in the world ~100 years ago.
Thanks Ovi, 9 months ago you suggested that US production had peaked.
1) Do you believe that still to be true?
2) What is the likely decline for the first 12 months once a clear decline trend is established? 5%, 10%, 20%?
Dennis – Your three scenarios were flat (~120 Gb), medium decline (90 Gb), and steeper decline (60Gb). These roughly correlate with 1P URR for tight oil (60 Gb) and 2P (120 Gb).
Still same values or has anything changed?
Kengeo,
My scenario for tight oil is around 83 Gb for URR, but potentially URR could be 90 Gb or even 100 Gb depending on oil and natural gas prices and technology development. I haven’t really updated the scenarios recently, except the Permian basin.
With the updated Permian scenario presented recently, the peak for US tight oil is 9340 kb/d in March 2026 with Sept 2025 output at 9329 kb/d (just 11 kb/d below peak). Clearly the model will not be that accurate and the difference between Sept 2025 and March 2026 is insignificant.
The annual decline rate of US tight oil gradually increases yearly from 0.4% to 1.34% to 1.87%, etc (March 2027, 2028, 2029) and reaches 4.7% annual decline by March 2035. The maximum annual decline rate is in 2044 at 24%.
About 30 Gb of US tight oil has been produced to date, so roughly 50 Gb of remaining resources by my estimate.
Tight Oil scenario
Kangeo
I don’t recall making that statement so clearly. I do recall saying that the US was getting close to peaking and that was the reason for adding the special Permian section to the US monthly report. At the time my thinking was and still is when the Permian peaks the US will also peak or be very close. In the current post, production charts for Lea, Martin and Midland indicate that all three have peaked.
See articles further down regarding Chevron reducing capex in the Permain
Gorozen’s Q3 2024 report, which came out yesterday, said shale is peaking now. You are in good company, Ovi!
XOM also reiterated CVX’s view that XOM was not going to grow shale like all other producers.
Joel,
I agree that analysis seems pretty sound, maybe Ovi will prove correct. I am not sure they are correct that tight oil output has peaked, perhaps natural gas has we will know more when natural gas prices and oil prices rise. So far for the Permian basin, I still see rising output through September 2024.
Tight oil has also been rising for the past 2 years, perhaps it will stop soon, Ovi might be right about 2025, I think it might be as late as 2027, but higher oil and natural gas prices will be needed.
Joel,
Also consider that the research from the Q3 report you cite suggests that for tight oil the URR is reached at cumulative production of around 30% of URR. As of Sept 2024 US tight oil cumulative output is about 28 Gb, and if the peak is now and is 30% of URR this implies a URR of 28 divided by 0.3 which is about 96 Gb, about 13 Gb more than my best guess. The implies Permian URR for a Sept 2024 peak is about 45 Gb. For the Sept 2025 peak expected by Ovi the URR would be 53 Gb and for my best guess 2027 peak a URR of 67 Gb is implied by this 30% rule. I am not entirely convinced by their analysis because it suggests arbitrary curve fitting without any underlying theory. Often such analyses arrive at spurious correlation which can be found in large random datasets. A fundamental question is why would we use the natural log of annual divided by cumulative production for tight oil but not conventional when doing a “Hubbert” linearization? Note that because the data fits a straight line is not a valid answer, that answer is just curve fitting with no theory and often leads to spurious correlation.
Mistyped in comment above should have said peak is reached when cumulative output is at 30% of URR according to Q3 Gorozen report.
Joel,
As far as the Gorozen Q3 newsletter, it suggests that at peak the cumulative output would be at about 30% of URR. For Permian Model below the peak is September 2025 at 5955 kb/d and cumulative output is 16 Gb on that date with URR of 48 Gb for this scenario (ratio of 33% rather than 30%). I assume the well completion rate falls at 5% per year after August 2024 for this scenario up to July 2041 with completion rate decreasing at 24 per year after that.
I’ve not seen it mentioned anywhere – will Trump’s tariffs apply to oil and petroleum products imports?
John Norris,
No tariffs will not be applied to oil.
Dennis/John
I think it is a reasonable assumption to assume that there won’t be any tariffs on Cdn oil. However I still think there is a small possibility.
US companies own a lot of Cdn oil. I wonder if he could use the threat as away of telling XOM and CVX, Drill Baby Drill. I (meaning T) will holding off the tariffs for a year as long as you can show me that your companies are increasing US oil production.
Ovi,
It will be interesting to watch, Trump doesn’t really have a plan, typically when asked he say we’ll see. The fact is there is not really a plan, though he may try to implement some of the 2025 plan that he claimed he knew nothing about.
Dennis
Is becoming energy independent part of Project 2025?
I have not read the entire report so I don’t know all of the specifics, it is a very large document.
https://www.project2025.org/
The specific chapter is
https://static.project2025.org/2025_MandateForLeadership_CHAPTER-12.pdf
The jist of it seems to be to promote fossil fuel production and to eliminate subsidies for policies that try to address climate change, such as EV rebates, and tax subsidies for wind and solar power while also removing most fossil fuel regulation, also the plan is to allow more oil and gas exploration on Federal Lands and expedite LNG export facilities.
That is based on a brief skim of the Chapter and a far from thorough analysis.
EIA Article on Argentina’s tight oil and shale gas
https://www.eia.gov/todayinenergy/detail.php?id=63924
Dennis
Attached is some news from Chevron to add/modify your Permian model.
Chevron Slows Permian Growth in Hurdle to Trump Oil Plan
(Bloomberg) — Chevron Corp. plans to slow production growth in the biggest US oil field next year in the most definitive sign yet that President-elect Donald Trump faces an uphill battle to ramp up American energy output.
Chevron will reduce capital expenditures in the Permian Basin to between $4.5 billion and $5 billion in 2025, a drop of as much as 10%, the company said in a statement Thursday. Globally, the oil explorer expects to spend about $17 billion compared to $19 billion this year in the first budget cut since 2021.
“Production growth is reduced in favor of free cash flow,” Chevron said in the statement.
Analysts at Goldman Sachs and Truist Securities raised their price targets for Chevron shares after the company announced its plan. The stock fell 1.2% at 9:39 a.m. in New York as oil prices slid for a third day.
Chevron still plans to increase production from the Permian next year, but growth will significantly decelerate from the 15% annual increase since 2021 as the oil driller nears its million-barrels-a-day target.
Chief Executive Officer Mike Wirth last month indicated production from the basin will stop growing and plateau in the late 2020s to “really open up the free cash flow.” The company’s overall US production is likely to increase until then in part due to projects in the Gulf of Mexico over the next few years.
What does this say regarding the ROI in the Permian? Also note they expect to continue to invest in the GOM.
https://www.bnnbloomberg.ca/investing/commodities/2024/12/05/chevron-slows-permian-growth-in-latest-hurdle-to-trump-oil-plan/
https://www.rigzone.com/news/chevron_holds_back_on_permian_tamping_down_expectations_under_trump-06-dec-2024-178966-article/
Ovi,
That seems to coincide with my scenario ( a plateau in output in the late 2020s). I have updated my Permian estimate based on the latest RRC, OCD, and EIA data. See chart below.
Dennis
Late 2020s is what CVX is stating. Hard to believe that. Let’s see what happens over the next six months.
With oil closing at $67.20/b today, maybe CVX is sending a message to OPEC that CVX and others will be reducing their growth rate.
OPEC Output Cuts Turned US into Top Energy Exporter, Rosneft’s Sechin says
RAS AL KHAIMAH, United Arab Emirates, Dec 5 (Reuters) – Igor Sechin, the head of Russia’s largest oil producer Rosneft, said on Thursday that the OPEC group’s decisions to reduce oil output in 2016 and 2020 helped the U.S. shale industry and made it a leading global energy exporter.
Sechin, speaking at a forum in the United Arab Emirates, said Russia and its partners have made the main contributions to the global energy market stabilisation in the past 10 years.
A long-standing ally of Russian President Vladimir Putin, Sechin has previously expressed scepticism about Russia’s cooperation with the OPEC, saying that the United States benefited most from the deal, struck in 2016.29dk2902l
Sechin told the UAE forum that Russia and its partners have helped to stabilise global energy markets.
“OPEC decisions to stabilise the oil market in 2016 and 2020 significantly supported the US shale industry,” Sechin said.
https://boereport.com/2024/12/05/opec-output-cuts-turned-us-into-top-energy-exporter-rosnefts-sechin-says/
Ovi,
I agree late 20s may not be right, especially if oil prices remain under $80/bo, maybe they believe oil supply will become tight and will boost oil prices, I agree mid 20s is a better guess at the current price level and perhaps water disposal issues, and fewer tier 1 and tier 2 locations might also lead to lower output than my best guess scenario, I could see Permian URR anywhere from 30 to 50 Gb. About 14 Gb of tight oil has been produced from the Permian to date and my scenario reaches about 18.5 Gb at the end of 2026.
Ovi,
On the other hand, notice how by my estimate Permian output has increased pretty steadily for the past 24 months. My method takes the percentage difference between statewide Texas and New Mexico data and EIA PSM estimates and assumes the percentage of state output reported for Permian regions will remain the same as data becomes complete. For example if statewide data is 90% of EIA data, I assume the same is true for the Permian region of that state. The EIA PSM estimates have been very accurate historically (just compare 914 estimate from comp stat with state data to confirm this. I see no reason that this will not continue in the future. The last two data points might be revised lower in the future.
Chart below has the new Permian estimate (with about 500 kb/d deducted to account for conventional output from Permian region) with my best guess scenario for the Permian basin, assumes EUR of new wells decreases by 3.5% per year through 2034 with a gradual decrease thereafter as completion rate decreases. The scenario has been modified a bit to try to match output. Peak is 5922 kb/d in Dec 2025, completions decrease from 494 in July 2025 to 483 in June 2026 and remain at 483 per month until Dec 2033 and then decrease by about 5 per month.
The Rig Report for the Week Ending December 6.
– US Hz oil rigs increased by 5 to 439. They are down 20 rigs from April 19 and are up 12 relative to their recent lowest count of 427 on July 24th. Of the five rigs increase, two were in the Texas Permian.
– In New Mexico, Permian rigs were unchanged at 94 while the Texas Permian added 2 to 192.
– In New Mexico, Lea and Eddy were unchanged at 46 and 48 respectively.
– In Texas, Midland added 1 to 27 and Martin dropped 1 to 26.
– Eagle Ford held steady at 40.
– NG Hz rigs were unchanged at 85.
Frac Spread Report for the Week Ending December 6
The frac spread count increased by 5 to 220. It is also down 58 from one year ago and down by 52 spreads since March 8. The increase so early in December is unexpected based on previous year’s Xmas trend.
I just realized I was using an older Permian Scenario, an updated scenario assumes new well EUR starts to decline in Jan 2025 at about 2% per year initially (at 480 wells completed per month for the entire year) and the rate of decrease gradually falls as fewer wells are completed. Total wells completed for this scenario is 114k (with about 50k wells completed so far as of August 2024). URR for the scenario is about 45 Gb (with 13.6 Gb produced as of August 2024). The well completion rate (new wells per month) is shown on right axis. The scenario actually matches the STEO for the Permian region for 2024 and 2025 (500 kb/d is added to the model output to account for conventional output in the Permian region.)
Dennis
Trying to read the orange graph, it looks like the Permian in 2025 will add close to 375 kb/d.
Ovi,
This might be better, model data only. The average annual increase from Jan 2024 to Dec 2025 is about 206 kb/d using OLS on 24 months of the model. From July 2024 to December 2025 the average annual rate of increase is 178 kb/d.
Note that my estimate for Sept 2024 based on RRC, OCD, and EIA data for the Permian tight oil is about 6000 kb/d (about 110 kb/d more than the model) and the December 2025 model is only 100 kb/d above that estimate. Very possible that the September estimate might be revised lower in the future.
If we look at the change in annual average Permian output from 2024 to 2025 (for the model) it is 207 kb/d (2024=5832 kb/d and 2025=6039 kb/d).
Link to spreadsheet with model
https://docs.google.com/spreadsheets/d/1SsnPtS5VRFWb3U4wR6u5lN_XGRyYEe90/edit?usp=sharing&ouid=105320434049434900507&rtpof=true&sd=true
row 5 on output sheet has new wells added each month (adjusted for decreasing EUR from EUR decline sheet). If wells have EUR that has decreased by 95% from December 2024 level then we multiply number of wells by 0.95 to account for lower EUR.
Ovi,
For chart above the Permian output is horizontal well tight oil output only, add about 500 kb/d to compare with my earlier estimate for Permian region output (which in Sept 2024 would include 500 kb/d of conventional output and vertical well tight oil output added to the horizontal well tight oil output in my Permian Model.)
Dennis
Yes. Much better
added link to spreadsheet in previous comment for those who would like to play with my Permian model. Large file, about 5 Mb so you will need to save it to your hard drive and use a spreadsheet, I think it may be too big to work in Google sheets.
For those who do not believe that the fracking revolution in the USA only, delayed peak oil for almost a decade, take a gander at the graph below. Well, perhaps delayed it from 2017 until 2018, but we shall see.
Data is through August 2024
Click on the graph to enlarge
Ron I agree that when tight oil peaks the World will peak (if it did not already in 2018).
The fracking boom was never going to add more the low single digit percentage points to total oil recovery.
A historian writing a book about oil in 2124 would barely mention it.
1. I mean OK. But USA is still part of the world. If world were in decline, what would you think of cornies saying the world is doing fine, if you exclude the region with largest losses? Similarly, it doesn’t make sense to exclude the area with largest gains!
2. It’s not like people expected USA to be the key player, back in 2007 when TOD was running strong. But there’s kind of a long history of new provinces coming into play. (e.g. North Sea) And hard to predict where. That should give you pause from thinking that world overall will tumble after USA peaks. Long, long, longitty, long-long pattern of peakers getting surprised by oil not crashing.
3. There’s a lot of oil in the ME/OPEC that is being withheld to prop prices up. There is so, so, so muchitty-much much oil in SA, Iran, and Iraq.
4. And then there’s Canadian tar sands. Imagine unleashing the beast (e.g. letting Keystone open). That is a huge resource.
5. Or imagine Vz with no sanctions and a good government. It’s not geology holding back Vz. It’s political factors and OPEC cartel. It could do a lot more, just based on “how much is in the ground”.
6. If you look at world less USA, it managed to go up significantly from 2014-2018 (on your graph). Probably did well from 2007 to 2018 also. (If you extend back to when peak oilers were hot and heavy on TOD.)
Nony,
Not expecting a crash, but slow decline as demand falls, middle east nations need higher oil prices, we may find that a lot of oil gets left in the ground. We can wish that Venezuela had a good government, it does not make it so. Canadian oil sands was not unleashed by high oil prices from 2006 to 2015, we may not see that level of real oil prices again, the Canadian government is not predicting big increases from Alberta (but the EIA also did not predict the boom in tight oil). Perhaps oil output will continue to increase forever, I expect it won’t.
So far the middle east has produced about 2.2 Mbpd more than they produced in October 2024, I will believe they can produce more when I see it.
Keep in mind that within a few years of the tight oil peak output will start to decrease steeply as it becomes unprofitable to continue more drilling from non-core areas.
Nevertheless, the entire world, including the USA, peaked, so far, in November2018. And OPEC had more spare capacity in 2018 than they have today.
1. So, big deal. It also peaked in the late 70s and took 10 years to get back. But it did and kept going higher. You have no way of showing that this is the final peak, rather than just one more temporary peak.
2. Also, you told us before that it was 2014/2015 was the permapeak. Remember that?
Nony,
Correct we will only know the final peak has been reached many years after the fact. The centered 12 month average peak in 1979 was not surpassed for 17 years (1996) and there have been several temporary peaks since 1979. Economically recoverable oil resources are not unlimited, demand for oil might determine the peak eventually. My guess remains 2028.
“You have no way of showing that this is the final peak, rather than just one more temporary peak.”
Yes.
And this is absolutely the heart of our tragedy, as I see: It canNOT be predicted; it is strictly a rearview mirror phenomenon, and it takes a long time to be verified–after the fact.
Therefore, preparing for it–or even bracing for the decline–are all but impossible. (See “current events last 50 years.”)
The tragedy is that there are still people in the UK that believe that coal hasn’t peaked for the country, and it’s just a matter of getting it back in production.
“5. Or imagine Vz with no sanctions and a good government. It’s not geology holding back Vz. It’s political factors and OPEC cartel. It could do a lot more, just based on “how much is in the ground”.
Geopolitical constraints and disruptions are big parts of the picture, just like economic factors and of course geology. Those constraints are likely are likely to grow on the oil down-slope, perhaps dramatically.
Spooky chart.
One way of looking at it is that it represents about 11 years of basically flat production.
https://guyanachronicle.com/2024/12/07/regulatory-stability-key-to-unlocking-guyana-suriname-basins-oil-potential-exxonmobil-president-says/
Exxon: Guyana’s suriname basin 1.5 mbpd by 2028 with regional stability.
The Strategic Oil Reserve was tapped by the Biden Admin in response to the tumult associated with the Russian invasion of Ukraine, when oil was selling 95$.
Nov 8th- The U.S. Department of Energy announced that 200 million barrels of crude oil have been delivered to refill the Strategic Petroleum Reserve (SPR)… with a good deal for taxpayers an average price of $74.75. The aggressive buyback strategy has resulted in the purchase of 20 million barrels more than the 180 million barrels sold under the emergency declaration authorized by President Biden in 2022 following the unprecedented Russian invasion of Ukraine.
https://www.energy.gov/articles/biden-harris-administration-makes-final-purchase-strategic-petroleum-reserve-secures-200
How did that happen. Only with government math. The SPR is still way below where it was when Joe drained it to help the democrats in the Congressional elections of 2022. What a bunch of liars the democrats are. The elections are over, they lost. Can’t they even tell the truth now.
I found a chart that gives a longer frame, supporting your notion that the reserve has only been partly refilled.
https://ycharts.com/indicators/us_ending_stocks_of_crude_oil_in_the_strategic_petroleum_reserve
It is a good time now to top it off, I assert.
Also, time to build and open the High Level Radioactive Waste Repository…70 years on.
About half what it was three years ago:
C185 Pilot
The Dems are not lying.
Attached is a link to explain how the math works. In 2015, congress mandated the sale of 358 million barrels from the SPR. The statement below lays out the plan. I think that the sale of the 180 Mb became part of that plan and the SPR today or in a few months will be 20 Mb above where it was supposed to be in FY2031. All further sales have been cancelled.
“From time to time, Congress mandates SPR crude oil sales to pay for other legislative priorities. Since 2015, Congress has enacted eight laws mandating the sale of up to 358.6 million barrels between FY2017 and FY2031. To date, 93 million barrels have been sold. Additionally, Congress required approximately $1.4 billion of SPR oil sales between FY2017 through FY2022, resulting in the sale of nearly 22 million barrels, to pay for an SPR modernization program.
https://crsreports.congress.gov/product/pdf/IN/IN11916
Also see following links on crude oil stocks in SPR
https://www.eia.gov/dnav/pet/hist/LeafHandler.ashx?n=PET&s=MCSSTUS1&f=M
and
https://oilandenergyonline.com/articles/all/congress-calls-additional-spr-sales/
Congress mandated sales would have brought the SPR to about 410 million barrels by 2027, Biden sold some of this oil early (Emergency sales) to counteract high oil prices in 2022, currently the SPR is at about 383 million barrels, so about 30 million barrels (7%) below the target.
According to this article there is no more money authorized by Congress for the Biden administration more oi to refill the SPR
https://www.reuters.com/business/energy/biden-administration-buys-last-oil-emergency-reserve-fund-taps-out-2024-11-08/
Weekly stocks indicate 392 million barrels of crude oil in SPR for week ending Nov 29, so about 18 million barrels below 410 million barrel target (4.4%).
Hickory
The sale of US oil makes Biden the best/smartest oil trader of 2023.
True…now time to refill it.
Hickory
The original idea was that the US has soooo much LTO that they didn’t need the SPR anymore. So let’s sell some of it. T is going to drill Baby Drill and maybe add another million barrels per day. 🤣🤣🤣🤣🤣🤣
Post at Oily Stuff to debunk tweet by Ted Cross at Novi Labs
https://www.oilystuff.com/forumstuff/forum-stuff/drive-by-shooting
As usual the post by this expert at Oily Stuff is spot on.
Thanks Dennis for shearing this link. It seems obvious shale oil need much higher oil price to be profittable. This break even price was 80 usd/bbl WTI but it seems it is increasing as GOR seems to become a increasing challange.
When a shale Area exsperiance 30% drop in production in a year and this can be the reality in Permian in few years I believe not only US have Energy shortage but this will have huge impact on the world oil, gas production that for ceturies have been depleated as a result of underinvestment.
Good read, so wells are currently losing $1,400 per day if we follow the math. Assuming 200 barrels per day per well WTI price is at least $7 under breakeven. I’d guess that $85 oil is coming in several weeks/months…producers likely need $100 to make up margins.
Dennis – could you check my math?
If each U.s. well is losing $1,000 per day (not sure that’s right).
Total daily loss for U.S. producing wells is ~$30 million each day at current oil prices? If WTI is ~$78/barrel then it’s a wash and around $85 there’s a net daily profit of $30 million? Imagine the saudis would raise production if they could like the did 12-13 years ago…
Kengeo,
For Permian basin the average well produces about 432 kb over its life, at $30/b net at a price of $60/b that is $13 million over the life of the well, so if the well capital cost $13 million total (including the cost to plug the well) the well would roughly break even (no profit for the well operator). If the price increases by $20/b over the life of the well ($80/b) and total cost of the well remains at $13 million, then the well would have a net profit of $8.4 million, if prices were $20/b lower the well would lose $8.4 million. Note that there are also natural gas and NGL sales which enter into the equation which were ignored in the simplified analysis. In the Permian basin there has been a lack of natural gas pipeline capacity so smaller producers have seen close to zero for Natural gas prices, often the spot price is negative.
Mike has net revenue at $23/bo for $60/b oil price. For that netback it is only about $10 million of net revenue for the average Permian well, if we exclude natural gas and NGL sales, but note that when we include natural gas and NGL it adds about $8 million in revenue over the life of the well for large oil companies that are able to reserve pipeline capacity for their natural gas. So we end up with a net profit of about $5 million over the life of the well (at $13 million capital cost for well) at $60/b for oil, NGL at 30% of crude price and natural gas at $2.50/MCF.
Cross is well aware that he is leaving out a lot (e.g. OPEX). Yes, it’s still so simplistic of a statement that he will get gigged for it. But he is well aware that he is only listing CAPEX (even says so) and leaving a lot out (even says so). Still it’s such a sketchy explanation that it induces people to slam him.
I would also say that if people are drilling wells, they are probably doing it because they think it is a +NPV investment, even after everything is accounted for. Otherwise you have to believe in the peak oiler cope (which we’ve heard for 15 years now, and even after several bust cycles) that the drillers are just irrational. A simpler explanation is that it makes financial sense to do the project.
” A simpler explanation is that it makes financial sense to do the project.”
The USA economy by way of the economists that advise the federal gov’t are making it plain that financial assistance is provided to the oil industry so that it doesn’t tank. For example after the 2008 market crash, the federal gov’t propped up oil fracking investments via the Energy Improvement and Extension Act of 2008, which offered tax incentives for renewable energy and biofuels. The economy is still based on oil, so that the oil industry was given a reprieve to leach off the green energy incentives.
They also did this during the pandemic via PPP loans, making sure the USA economy didn’t tank.
The oil industry and locked-down businesses happily took the financial assistance, both a decade ago and recently Is there any doubt that this is happening? I don’t know if you are the same Anonymous that is belly-aching about the SPR, which is another strategic investment to protect the economy.
I think we should get rid of the SPR. It is 1970s silliness.
In terms of a strategic reserve, we have the oil itself in the ground…and the ability to pump it. So, if a war occurred and we lost overseas imports, we could make up the difference just by conservation. There are a lot of people that don’t carpool. Could still keep the war machine running fine.
And it costs money to maintain the SPR.
And then periodically, politicians are tempted to release barrels to try to retard price increases. But the market is wise to that and it doesn’t work. It’s not like discovering a new source…just a temporary blip. So prices barely budge.
So, I would just get rid of it. It’s like the export ban or wage and price controls or other 1970s silliness.
Nothing bad will happen. Trust me bro.
You really think that rush drilling could match a speedy deployment of oil from the SPR, now or in 2040? Call me very doubtful on that point.
I do think it would wise to make strict rules on tapping into the SPR, so that partisan political considerations were heavily curtailed. Take the decision away from the President (along with the ability to grant pardons).
You don’t have to do rush drilling. We are already doing 13 MM bopd/day. I donno what consumption of (non NGL) products is. Probably under 15. So, the difference is quite small. Joyriding and soccer moms and the like would have to do without, so the war machine would be supplied. But it’s a very minor issue.
Nony,
US consumed about 14.5 Mbpd of Gasoline, Jet fuel, and diesel fuel on average in 2023. Crude input to refineries and blenders was 16 Mb/d on average in 2023.
https://www.eia.gov/dnav/pet/pet_cons_psup_dc_nus_mbblpd_a.htm
In 2023 about 4 Mb/d of crude oil was exported from the US because refineries are not set up to handle light tight oil, in 2023 tight oul output averaged about 8.5 Mb/d, so about 4.5 Mb/d can be handled by US refineries. This is not remedied by the wave of a wand, it is the reason the export ban on crude was lifted in 2015.
The US imported about 6.5 Mb/d of C plus C on average in 2023.
Many politicians realize that having the SPR is much easier than getting people to car pool and of course we don’t want to encourage people to buy electric vehicles, that would protect the long tem well being of the global ecosystem which to Trump World or Project 2025 is a very bad idea.
Bottom line imports of C plus C were 6.5 Mb/d in 2023 with about 4.5 Mb/d imported from Canada and Mexico, perhaps we would do fine with 2 Mb/d less crude imports, that would only be a 12.5% drop in gasoline, diesel, and jet fuel, nobody would even notice.
Fill it up this year, so that during episodes of great need in the 2030’s or 40’s might be supplied.
Wars and famines can last a long time.
The export ban worked fine for 40 years.
US resources are not the right grade for US refineries which is why we continue to import 6 million barrels per day of crude oil. The SPR is probably about the right size at present, no SPR would be foolish.
I don’t see any reason to quit slowly refilling the SPR at current prices.
I was critical at the time, but this actually has been working out.
Shallow sand,
I agree, but note that this is up to Congress, currently the legislation that has been passed by Congress aims for about 400 Million barrels of Crude in the SPR, we are at about 392 Million barrels currently which is about 60 days of annual average daily crude imports in 2023 (6.5 Mb/d). Perhaps Congress will decide they want to add more oil to the SPR (perhaps 90 days of average crude oil imports would be better which would be an additional 195 million barrels added to the SPR, bringing the total to 587 million barrels.)
EIA article on US Natural Gas
https://www.eia.gov/todayinenergy/detail.php?id=63964
Good interview of Ted Cross (guy Mike was ripping):
https://www.youtube.com/watch?v=t5HUD3gEhQg
He’s actually a reasonably intelligent guy. And a professional in the industry. And he’s not some cornucopian. (I heard a different podcast, where someone gave him an under/over bet on US growth, and the number was small, few hundred thousand, and Cross took the under.)
I also like how direct he is about describing what his company sells. Not BSing or exaggerating.
Think it is too bad things did not work out with Enno and Novi (but hope he made some bank on the deal and learned something…super proud of Enno!)
Nony,
Thanks. I agree very interesting.
Yes Enno is great, I think he just wanted to move on to something new. I am sure he will do well.
Some good analysis, US is peaking and likely ~45% of tight oil has been produced:
https://www.dailykos.com/stories/2024/12/8/2290683/-Revisiting-Hubbert-s-Peak
Great article! Be sure to take the quiz at the end and look at the results…
Ken Geo,
The low model in red for “new wave” oil is about 95 billion barrels, through Sept 2024 about 28 Gb of tight oil have been produced (Jan 2007 to Sept 2024). If the model in the article is correct (tight oil URR=95 Gb) cumulative production as of Sept 2024 would be about 29% of the eventual URR.
Exxon Mobil webcast
https://event.webcasts.com/viewer/event.jsp?ei=1686800&tp_key=1320d23f2e
Event has ended see
https://investor.exxonmobil.com/news-events/corporate-plan-update
Modelling toolkit may be interesting
Exxon Raises Capital Spending as Worldwide Oil Glut Looms
Exxon plans on spending more capital to increase oil production.
Exxon Mobil Corp. will raise capital spending next year as its $60 billion purchase of Pioneer Natural Resources Co. increases its oil-production plans, threatening to worsen next year’s expected crude glut.
Here are some key items from Wednesday’s announcement:
– Guyana’s production will double to about 1.3 million barrels a day by 2030
This figure differs from installed capacity because of output declines in older reservoirs
– Permian output will grow to the equivalent of 2.3 million barrels a day by 2030, up from about 1.4 million now
— Exxon claims to have more than double the number of well locations that break even at less than $40 a barrel than its nearest competitor
— A new proppant made from refining coke will improve recoveries by 15%, Exxon says
Who is right Exxon or Mike regarding well costs and break even?
https://financialpost.com/pmn/business-pmn/exxon-raises-2025-capital-spending-as-worldwide-oil-glut-looms
Ovi,
Note that Exxon gives all of its numbers in barrels of oil equivalent rather than barrels.
Here are two slide decks from presentation. First focuses on upstream sector and second on full corportation.
https://d1io3yog0oux5.cloudfront.net/_85cf201fad96530f99211c985eb36f1c/exxonmobil/db/2261/22347/file/Upstream Spotlight – FINAL.pdf
https://d1io3yog0oux5.cloudfront.net/_85cf201fad96530f99211c985eb36f1c/exxonmobil/db/2261/22346/file/Corporate Plan Update – FINAL.pdf
For past 4 quarters Exxon average sales price for crude was $76/b and for Natural gas was $1.74/MCF. If we assume NGL sells at 30% of crude price, at those prices the average 2022 Permian well has net revenue of about $15.4 million over the life of the well. Exxon claims they have lowered costs with longer laterals and better capital efficiency with improved cube design in the Permian.
In US Upstream operations for first 9 months of 2024 XOM earnings were about $5.17 billion, it is not broken out by basin though, on average assuming no net earnings from natural gas they got net revenue of about $16.09 per barrel for first 9 months of 2024, about 321 Mb produced in first 9 months of 2024 in US.
Note the growth in XOM Permian boe is 0.9 Mboe/d over 5 years so about 180 kboe/d annual average growth for crude, NGL ,and natural gas converted to boe. They do seem confident that they have Permian drilling inventory to last through 2030.
Hey Dennis when you were using opec and eia data to derive net exports. Where you doing production minus consumption like brown or where you doing exports minus imports?
Jacob,
I was doing exports minus imports. Consumption and production data is a bit tricky because there are refining losses and NGL etc.
Best data is at link below in my view.
https://www.eia.gov/international/data/world
I think that method makes the most sense really. As brown numbers often didn’t match actual exports. Asides what use is that figure of the actual amount of oil on the market increases in spite of it?
xom projected growth is over 6 years rather than 5 years, so 900 kboe/d divided by 6 so an average annual increase of about 150 boe/d. Not likely to have a big effect on World Oil Market. With the increasing cut of natural gas in Permian output this might only amount to 100 kb/d of tight oil increase each year. It might also be offset by decreases from other producers.
Was this aimed at me?
Jacob,
No.
I was responding to my own comment where I mistakenly figured 2024 to 2030 in Exxon presentations as 5 years, it is a 6 year span so the 900 kboe/d planned increase in Exxon’s Permian output is 150 kboe/d average annual increase rather than the 180 kboe/d average in my original comment.
Ovi,
Link below to Chevron investor presentation
https://chevroncorp.gcs-web.com/static-files/f3cc9a3b-fdd1-42f0-856e-7cb0ca612d11
Looks like they pan to get to about 1.2 Mboe/d in Permian by 2030, Exxon plans to get to 2.3 Mboe/d so combined (if they hit their plan) this is about 3.5 Mboe/d an increase of about 1.2 Mboe/d over 6 years or about 200 kboe/d annual average increase for these 2 companies in the Permian Basin.
Who is right Exxon or Mike regarding well costs and break even? Is that a gig, Ovi, or do you wish to ask me a question?
250,000 BO, 36 month UR at $60 gross WTI does not equate to $15MM profit, which is precisely what Ted Cross implied in a Tweet. I stood up to that because it is misleading and deceptive. As is THIS click bait, almost equally misleading and deceptive… “but note that when we include natural gas and NGL it adds about $8 million in revenue over the life of the well for large oil companies that are able to reserve pipeline capacity for their natural gas. So we end up with a net profit of about $5 million over the life of the well (at $13 million capital cost for well) at $60/b for oil, NGL at 30% of crude price and natural gas at $2.50/MCF.”
More what ifs, ands and buts at AOB, none of which have anything to do with current reality, reality for the past 18 months, nor probable reality for 2025 and beyond.
FANG, far more representative of the Permian Basin tight oil sector than Exxon, grossed 60 cents per MMBTU for its gas 3Q24, before royalty, G&A, interest expense, taxes and OPEX. Its been paid on weighted average $17 for its NGL’s but as almost any good, up to date analyst knows, NGL volumes are declining because more and more of the stuff is getting shoved over into the oil leg.
Exxon exceeded its production call a few weeks ago for the first time since 2017. Every year since 2017 it’s promised 1 MM BOEPD and every year its crawfished on that call. Now, because its going to essentially rape the service industry in the Permian to drive down costs, so it thinks, its promised over 2.2 MMBOEPD by 2030. Before crawfishing. Actually, given GOR in Saudi America, at 6:1 it will likely meet is guidance. And in the process drive the price of crude oil AND natural gas to extreme lows beginning 2025.
Chevron, by the way, is not representative of the Permian Basin tight oil sector either because of its fee ownerships & <1/16th royalty burdens.
"Mike has net revenue at $23/bo for $60/b oil price. For that netback it is only about $10 million of net revenue for the average Permian well…" That is correct, at $60. I will debate that with any CFO in the country. That calculation was used to show how deceptive Ted Cross's comment was. Associated natural gas at current prices does not add $5MM net revenue to a typical Permian HZ well either, see above.
But wait. This from your esteemed colleague: "In US, upstream operations for first 9 months of 2024 XOM earnings were about $5.17 billion, it is not broken out by basin though, on average assuming no net earnings from natural gas they got net revenue of about $16.09 per barrel for first 9 months of 2024,"
So I suggested $23 net back for a typical Permian pure tight oil player and mighty Exxon, according to your colleague, could only muster $16 net back per incremental BO thus far in 2024….with an average natgas price of $1.74 per MMBTU. Good work, Mikey!
The point in this private enterprise exercise of oil and gas extraction is to make money, not breakeven. NONE of the multitude of what-if scenarios used here generates sufficient profit to ultimately pay down debt and prepared for $40B, min. of retirement and infrastucture decommissioning in the Permian alone.
Every year between now and 2030 the Permian Basin tight oil play has to replace 4.8MM BOPD of annualized decline before it can grow 1 BOPD. This from new wells that are getting gassier, produce more and more water, and less and less C plus C….in a falling product price environment caused by more stupid, unfettered overproduction.
If I may, you smart people over here should spend less time railing on me (and "using" MY work, uninvited) and more time understanding what it is your actually analyzing. Find the remote with the Nony channel on it and delete it; he/she knows nothing about oil and gas, or business, or money; nothing.
I’ve done fits for the oil price and C&C production. Oil price maximum in december 2022, C&C maximum in october 2023. I’m quite sure, that neither the price nor the production will follow the fit, but this illustrates the problem. Low oil prices will cause a further drop in production. Especially, because china has its demand peak in 2025.
Escalation dominance
Ontario premier says US energy exports will be cut off if Trump imposes sweeping tariffs on Canada
https://apnews.com/article/canada-interest-rate-cut-trump-tariffs-c0ef920ffb02ea0531c93516abad64e0
Thanks S. Law of unintended consequences?
“unintended consequences”
Thats a notion that is a little too complicated for 45/47
aka Murphy’s Law.
Trump is Murphy’s law.
Canada isn’t doing very well. 6.8% unemployment. BOC aggressively cutting interest rates. Any reduction or stoppage of the flow of energy will send that unemployment rate higher in Canada.
The guy can talk tough. But he has to keep people employed.
It’s important to remember that Canada computes it’s unemployment numbers different than the US. I can’t remember the details but it’s in the different definitions behind “unemployed”, “looking for work”, “actively engaged in looking for work”
If the US computed their numbers the same way, the US Unemployment rate would be a couple of points higher too.
In the same way, Canada does it’s immigration differently. Both countries have “economic immigrants” who have skills or money to invest, and “family immigrants” who are joining family in the country.
In the US, more than 60% of immigrants are ‘family’ immigrants. In Canada, it’s only 15% ‘family immigrants. Canada has 67% economic immigrants.
Canada cutting off oil exports to the USA would be one of the worst geopolitical decisions in human history.
Canada gets the USA 900 billion a year military for FREE.
Turning that against yourself would be very stupid!
An updated August Non-OPEC and World oil production has been posted.
https://peakoilbarrel.com/august-non-opec-world-oil-production-rose/
A new Open Thread Non-Petroleum has been posted.
https://peakoilbarrel.com/open-thread-non-petroleum-december-12-2024/