By Ovi
The focus of this post is an overview of World oil production along with a more detailed review of the top 11 Non-OPEC oil producing countries. OPEC production is covered in a separate post.
Below are a number of Crude plus Condensate (C + C) production charts, usually shortened to “oil”, for oil producing countries. The charts are created from data provided by the EIA’s International Energy Statistics and are updated to July 2024. This is the latest and most detailed/complete World oil production information available. Information from other sources such as OPEC, the STEO and country specific sites such as Brazil, Norway, Mexico and China is used to provide a short term outlook.
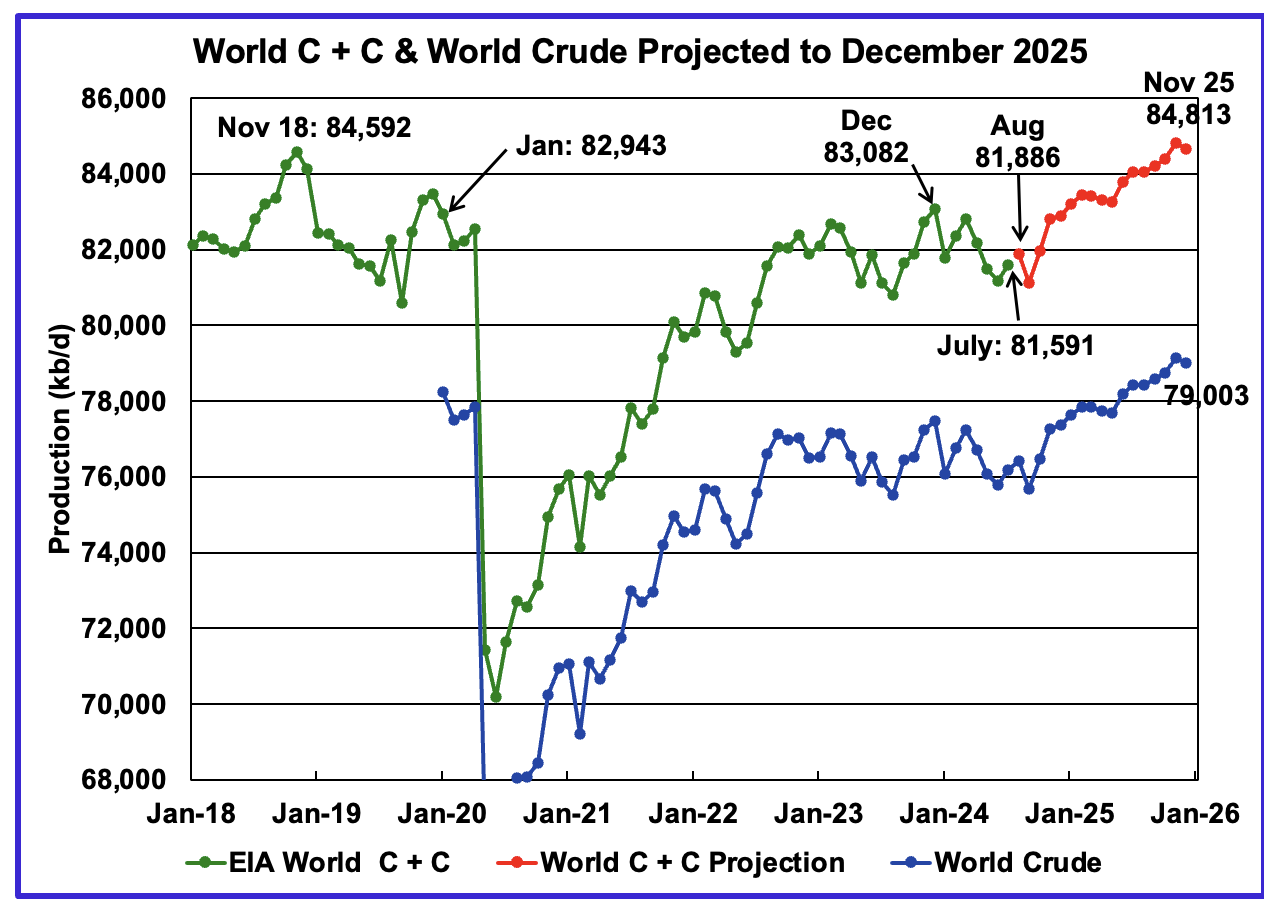
World oil production increased by 406 kb/d in July to 81,591 kb/d, green graph. The largest increase came from Saudi Arabia, 300 kb/d. August’s World oil production is projected to increase by 295 kb/d to 81,886 kb/d.
This chart also projects World C + C production out to December 2025. It uses the November 2024 STEO report along with the International Energy Statistics to make the projection. The red graph forecasts World oil (C + C) production out to December 2025 using the STEO’s November crude oil report.
For December 2025, production is expected to be 84,634 kb/d. It is preceded by a November 2025 peak of 84,813 kb/d. The November 2025 oil production projection is 90 kb/d higher than estimated in the previous post.
From July 2024 to December 2025, World oil production is estimated to increase by 3,043 kb/d. This appears to be optimistic in light of the projected lower demand from China and OPEC’s plan to increase production in the near future, which keeps being delayed.
A note of caution. The November STEO is now reporting/forecasting only Crude oil production which is also shown in the chart. As a result the red C+C graph is a projection based on the crude production graph.

Over the past 10 months, it has been noted that the ratio (C + C)/C was changing MoM, possibly due to the EIA’s new crude reporting format. As a result the six month average ratio of (C + C)/C was used to make the December 2025 projection. Over the last 10 months that ratio has now settled down to 1.067 ± 0.01 with only a small variation. As such going forward the six month ratio will continue to be used to project future production. Based on the current data it appears there is a seasonal variation in the ratio (C + C)/C.
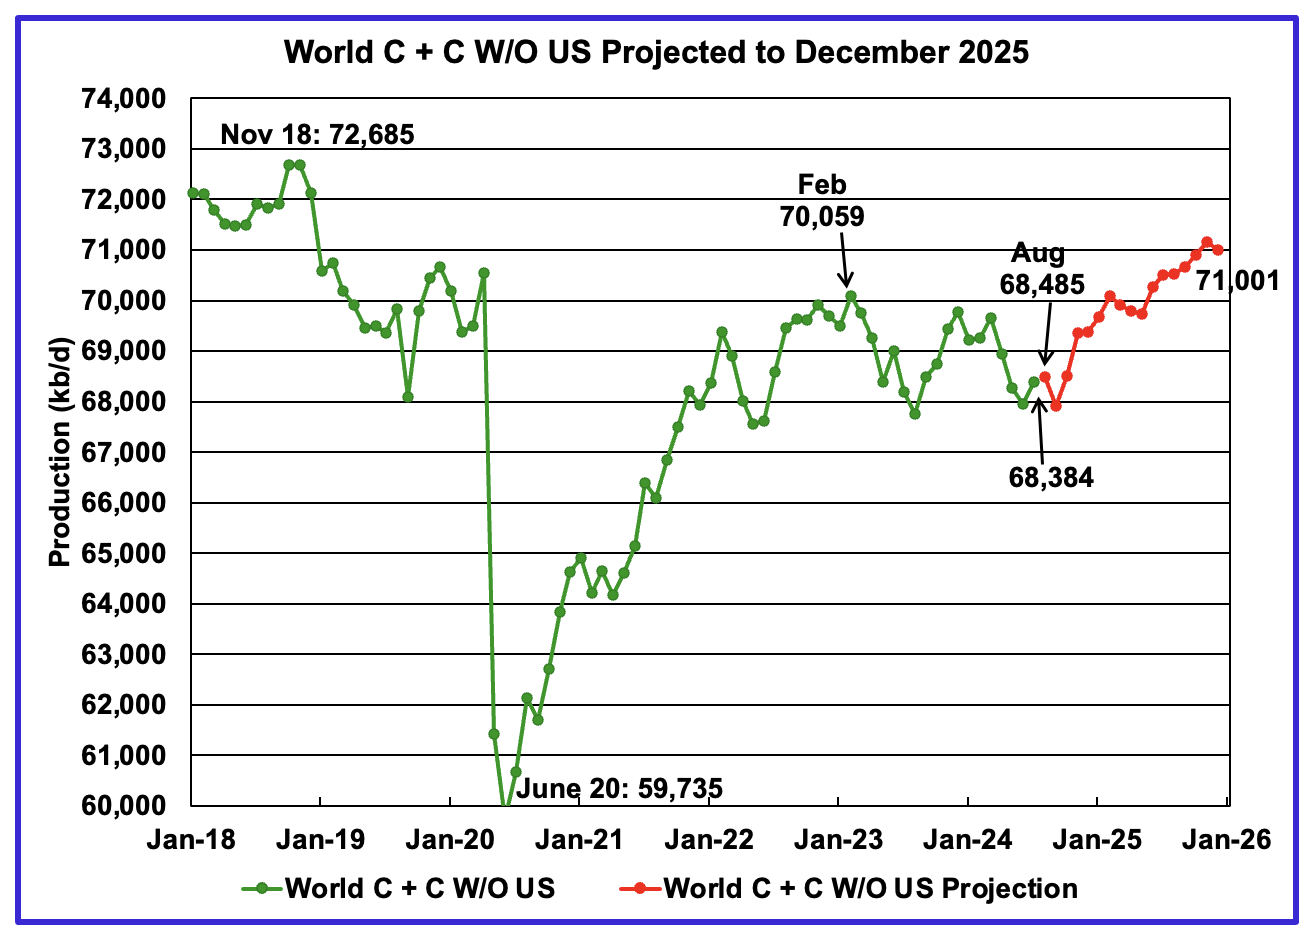
World July oil output without US increased by 440 kb/d to 68,384 kb/d. August production is expected to rise by 101 kb/d to 68,485 kb/d.
Note that December 2025 output of 71,001 kb/d is 1,684 kb/d lower than the November 2018 peak of 72,685 kb/d.
World oil production W/O the U.S. from July 2024 to December 2025 is forecast to increase by a total of 2,617 kb/d.
A Different Perspective on World Oil Production
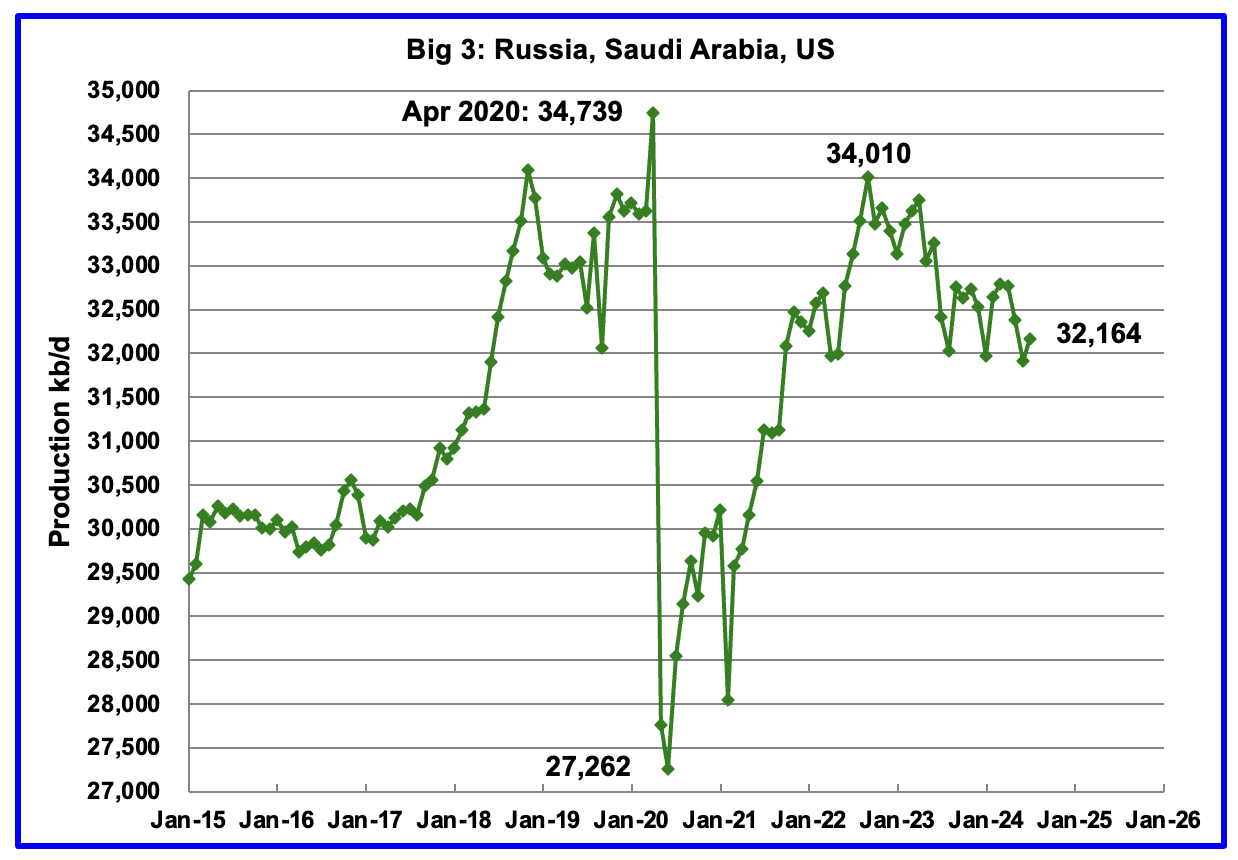
Peak production in the Big 3 occurred in April 2020 at a rate of 34,739 kb/d. The peak was associated with a large production increase from Saudi Arabia. Post covid, production peaked at 34,010 kb/d in September 2022. The production drop since then is primarily due to cutbacks by Saudi Arabia and cutbacks/decline by Russia.
July’s Big 3 oil production increased by 250 kb/d to 32,164 kb/d. July’s production is 1,846 kb/d lower than the September 2022 post pandemic high of 34,010 kb/d. Of the three, the country with the largest increase was Saudi Arabia with a rise of 300 kb/d, see Table below.
Adding in the current Saudi Arabia 1,000 kb/d cut would raise production to 33,164 kb/d, just 846 kb/d lower than September 2022 production. Saudi Arabia along with other countries which were scheduled to reverse their cuts in October 2024 have now delayed them to January 2025 because of lower than expected China/World oil demand.
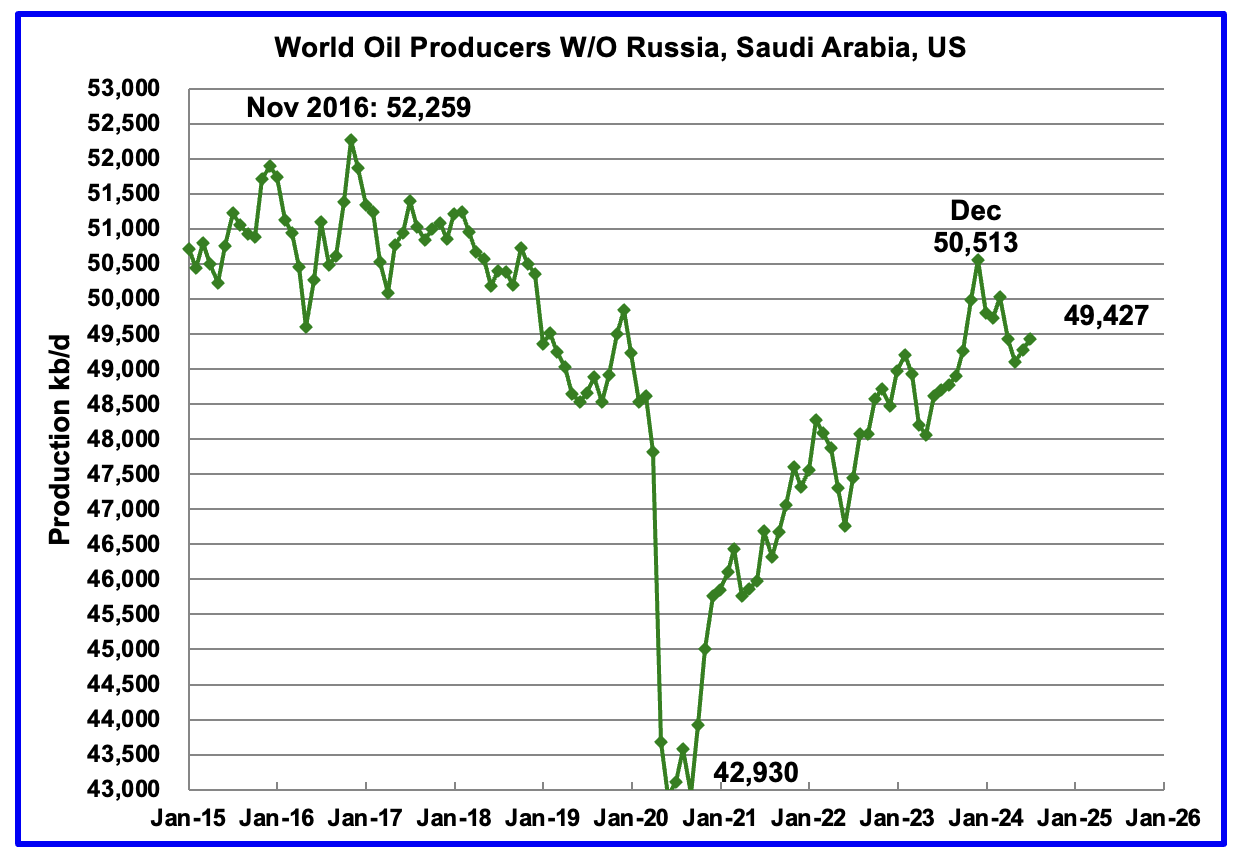
Production in the Remaining Countries had been slowly increasing since the September 2020 low of 42,930 kb/d. Output in December 2023 reached 50,513 kb/d, a new post covid high. However production began to fall in January 2024 but has since reversed. July’s production increased by 157 kb/d to 49,427 kb/d. Of the 157 kb/d increase, Canada contributed 131 kb/d and Iraq added 110 kb/d. The overall drop from December 2023 to July 2024 is 1,086 kb/d.
Countries Ranked by Oil Production
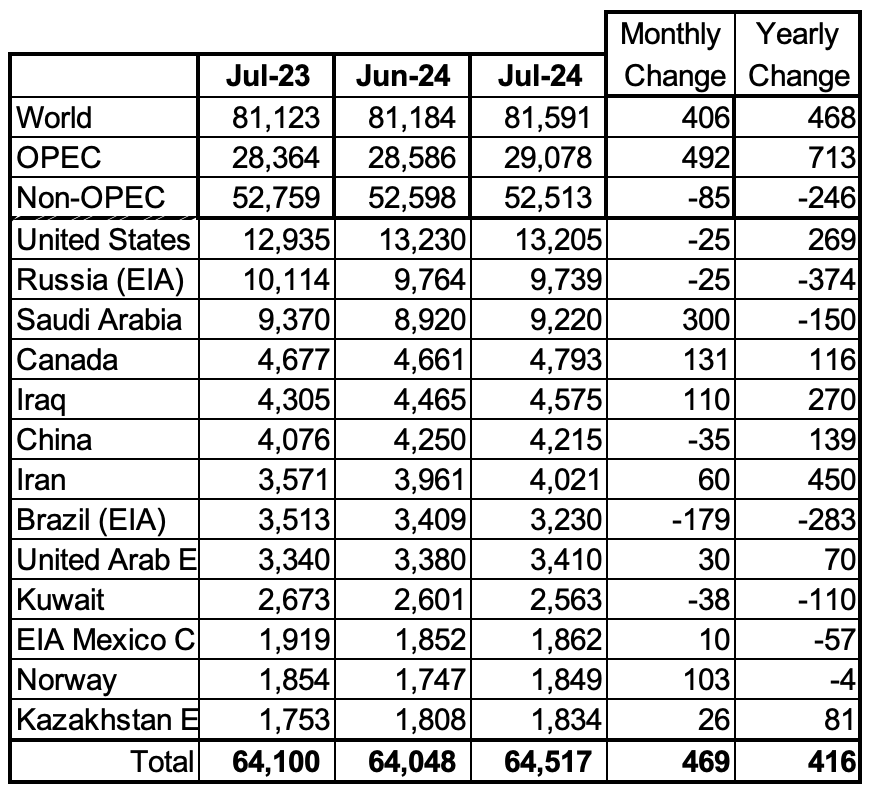
Above are listed the World’s 13th largest oil producing countries. In July 2024, these 13 countries produced 79.1% of the World’s oil. On a MoM basis, production increased by 469 kb/d in these 13 countries while on a YOY basis, production rose by 416 kb/d. Note the large YoY production increase in Iran and Iraq. Will the upcoming more strict sanctions on Iran curb that increasing trend?
July Non-OPEC Country Oil Production Charts

July Non-OPEC oil production decreased by 85 kb/d to 52,513 kb/d. The largest decreases came from Brazil and Guyana while Saudi Arabia’s increase offset those losses. Note that Non-OPEC production now includes Angola.
Using data from the November 2024 STEO, a projection for Non-OPEC oil output was made for the period August 2024 to December 2025. (Red graph). Output is expected to reach 55,292 kb/d in December 2025, which is 1,320 kb/d higher than the December 2019 peak of 53,972 kb/d.
From December 2023 to December 2025, oil production in Non-OPEC countries is expected to increase by 987 kb/d.
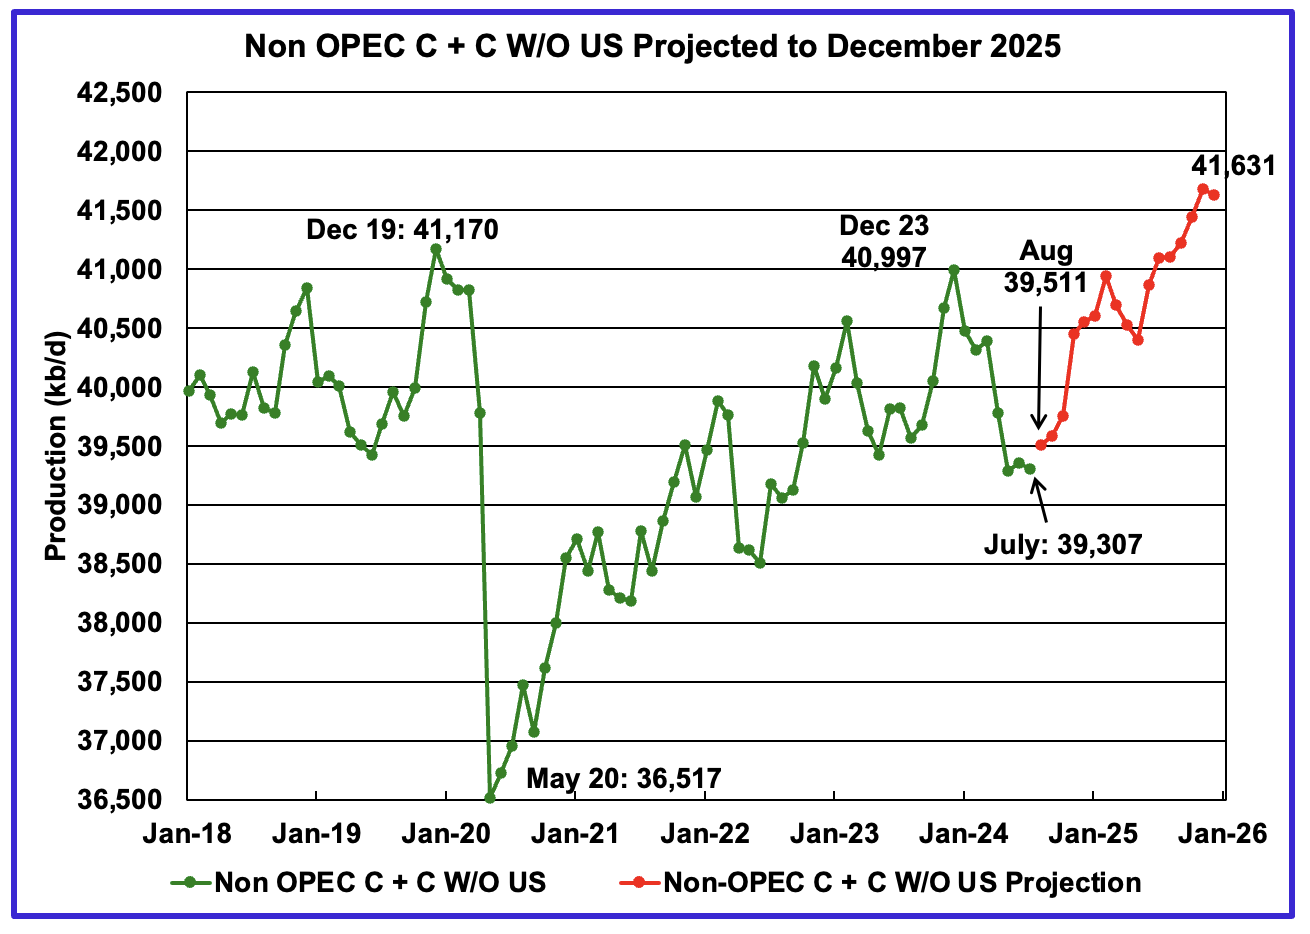
July’s Non-OPEC W/O US oil production dropped by 61 kb/d to 39,307 kb/d. August’s production is projected to rise by 204 kb/d to 39,511 kb/d.
From July 2024 to December 2025, production in Non-OPEC countries W/O the US is expected to increase by 2,324 kb/d. December 2025 production is projected to be 461 kb/d higher than December 2019.
Note that from December 2023 to December 2025, Non-OPEC W/O US oil production is expected to increase by 634 kb/d. These Non-OPEC countries include Canada, Brazil and Guyana, the three countries often noted by the IEA as the countries with the likest ability to increase production to new records.
Non-OPEC Oil Countries Ranked by Production
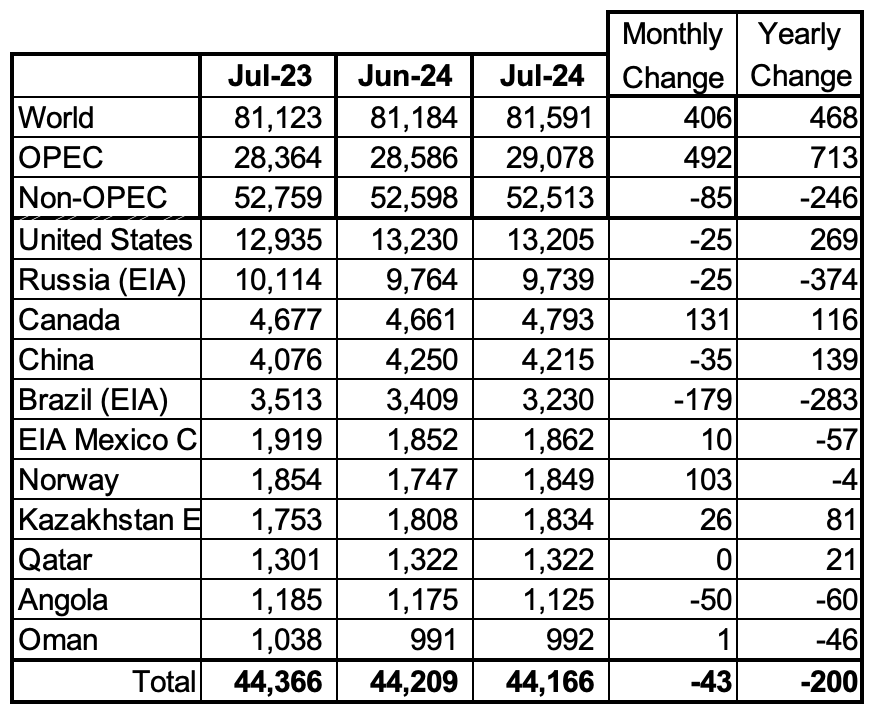
Listed above are the World’s 11 largest Non-OPEC producers. The original criteria for inclusion in the table is that all of the countries produce more than 1,000 kb/d. Note that Angola has been added to this table and that Oman has recently fallen below 1,000 kb/d.
July’s production decreased by 43 kb/d to 44,166 kb/d for these eleven Non-OPEC countries while as a whole the Non-OPEC countries saw a monthly production drop of 85 kb/d to 52,513 kb/d.
In July 2024, these 11 countries produced 84.1% of all Non-OPEC oil production.
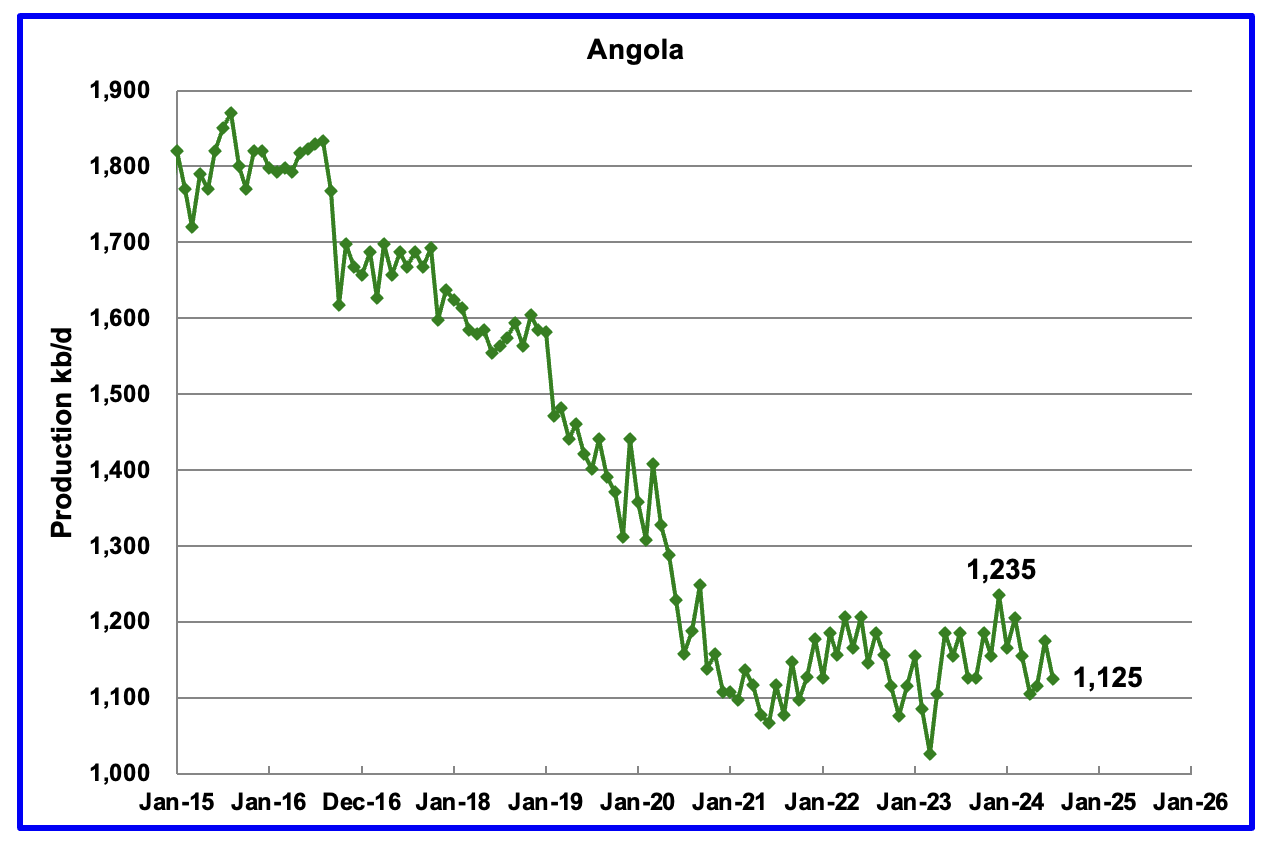
Angola has been added to the Non-OPEC producing countries since they withdrew from OPEC.
Angola’s July production decreased by 50 kb/d to 1,125 kb/d. Angola’s production since early 2022 appears to have settled into a plateau phase between 1,100 kb/d and 1,200 kb/d.
According to this Article, Angola is looking to increase its production and attract more investments. The African oil producer plans to launch additional multi-year oil and gas licensing rounds from 2026.
“Angola intends to replicate its maiden multi-year licensing round for oil and gas acreage from 2026, a senior government energy official said on Thursday, as the country looks to boost production and investment.
The first multi-year auction for 50 onshore and offshore blocks was for 2019-2025, as Angola strives to arrest a steep decline in crude oil production from mature oilfields.”

The EIA reported that Brazil’s July production dropped by 179 kb/d to 3,230 kb/d.
Brazil’s National Petroleum Association (BNPA) reported that production increased in August and September 3,470 kb/d. The BNPA has started reporting Brazil’s pre-salt production again. The September pre-salt graph tracks the crude oil graph. For September, pre-salt production increased by 170 kb/d and reached a new high.
Overall Brazil production after September has to increase by 208 kb/d to exceed the November 2023 high.

Canada’s production increased by 131 kb/d in July to 4,793 kb/d. The increase is primarily due to the return to operations of facilities shut down for maintenance.
Canada’s oil sands have a new problem. The Canadian government is opposed to increasing oil sands production. It will require Canada’s oil and gas industry to cut emissions by 35% from 2019 levels, inflaming tensions with the country’s western provinces and oil companies.
According to this Article, “The plan will be implemented through a cap-and-trade system that sets a legal limit on the sector’s emissions and then lets companies buy and sell a limited number of emissions allowances, Environment Minister Steven Guilbeault announced on Monday.”
Alberta, home of the oil sands will fight this legislation “Alberta’s provincial government will explore legal challenges to the emissions cap and draft a motion under the so-called Alberta Sovereignty Within a United Canada Act, which orders provincial agencies to not enforce or aid in enforcing federal rules deemed unconstitutional or “causing harm to Albertans.”
The province is the home of Canada’s oil sands and produces the majority of its crude.
“We will not stand idly by while Justin Trudeau sacrifices our prosperity, our constitution and our quality of life for his extreme agenda,” Premier Danielle Smith said during a press conference Monday. “I’ll get my justice minister working on it immediately and we will start drafting a motion under the sovereignty act immediately as well, so we are going to act very quickly.”
The Canadian Association of Petroleum Producers said the cap will add an “unnecessarily complex layer on top of an already overly complex web of energy and climate regulations.”
“The introduction of this draft regulation comes with the high probability of negative impacts on the Canadian economy and no guarantee of emissions reductions,” Lisa Baiton, president of CAPP, said in a statement.
TC Energy Corp. Chief Executive Officer Francois Poirier said the measure would act as a cap on Canadian natural gas production, harming “Canadian families and businesses by raising prices on energy.”
The opposition conservative party opposes this plan.
“The shelf life of the emissions cap is in doubt, however, as Canada is due for a federal election by October 2025. Conservative Leader Pierre Poilievre is ahead by double digits in most polls and has promised to scrap many of Trudeau’s climate policies.
“Trudeau wants to suffocate Canada’s energy industry with an arbitrary emissions cap that will devastate Canada’s already broken economy,” Poilievre’s party said in a statement reacting to the plan’s details.”
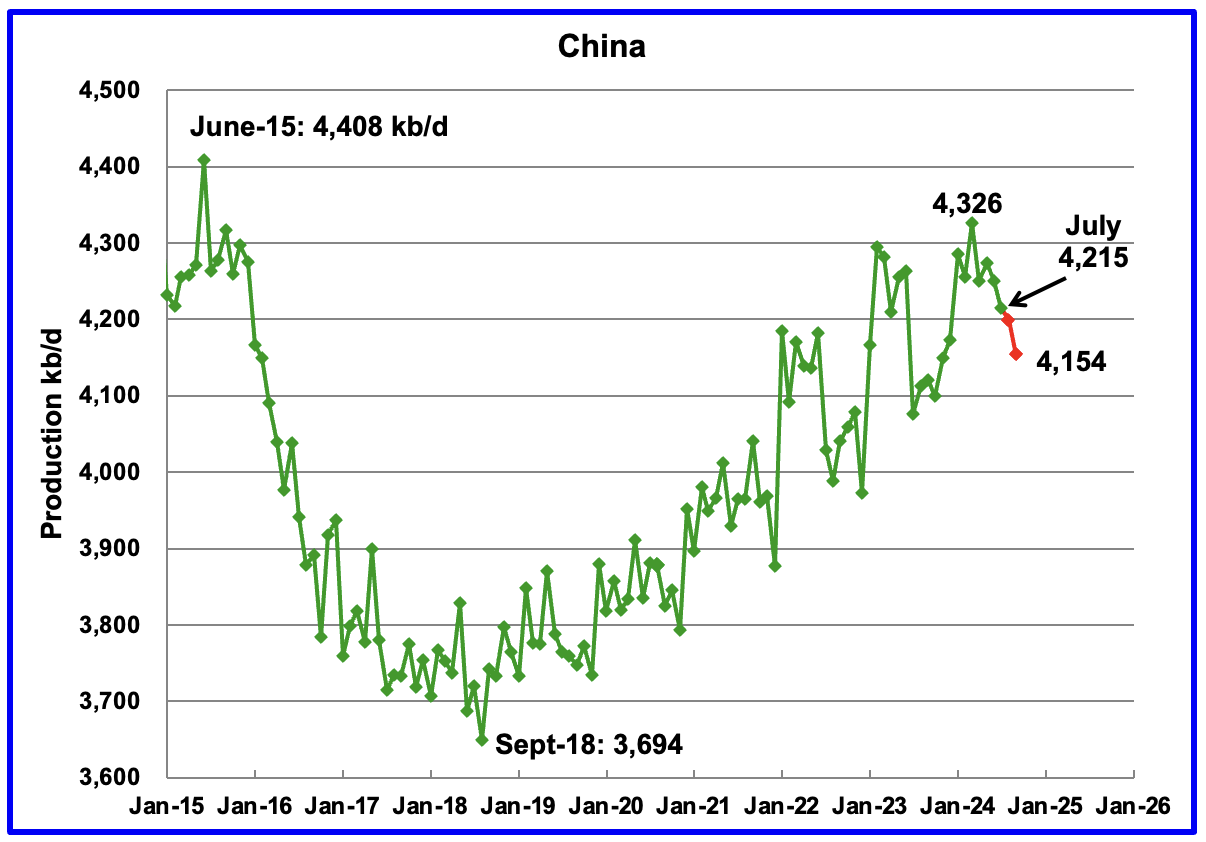
The EIA reported China’s July oil output decreased by 35 kb/d to 4,215 kb/d.
The China National Bureau of Statistics reported production for August and September. September production dropped to 4,154 kb/d.
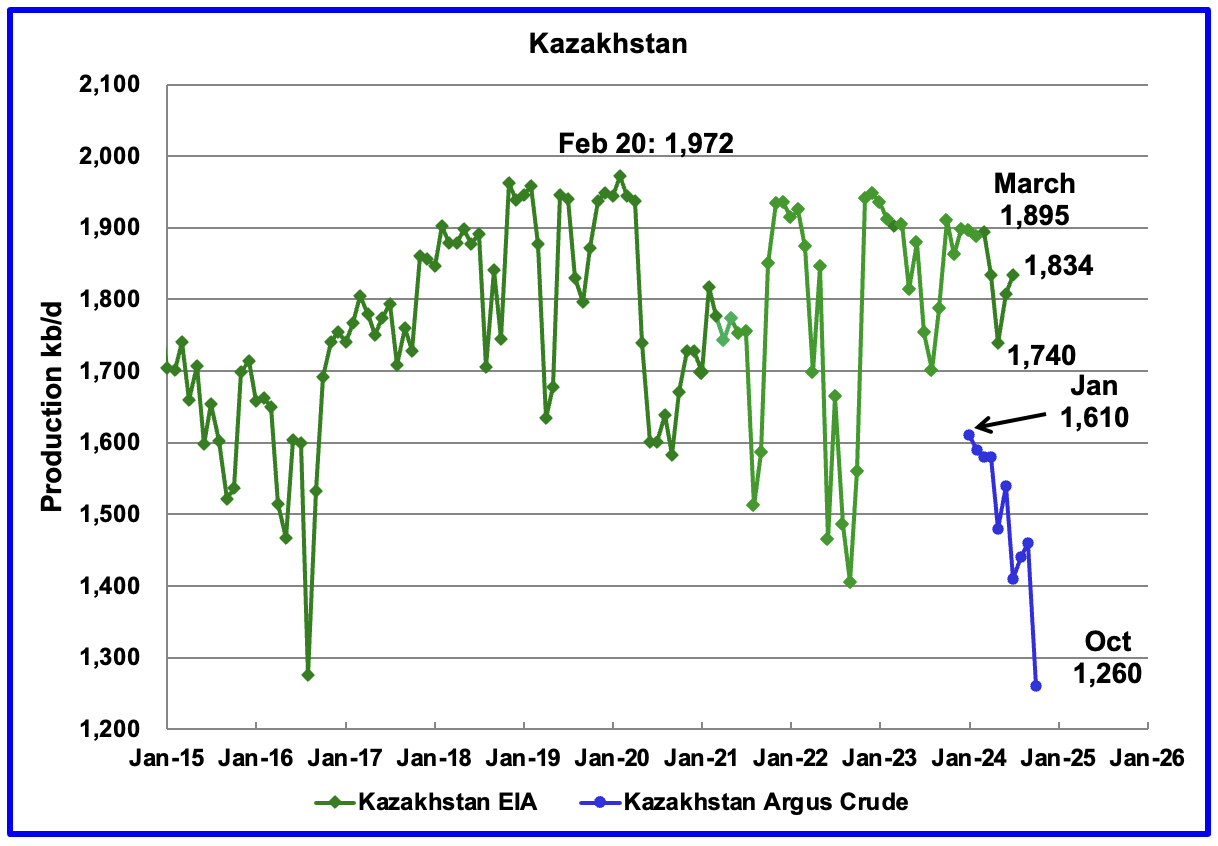
According to the EIA, Kazakhstan’s oil output increased by 26 kb/d in July to 1,834 kb/d. Kazakhstan’s recent crude oil production, as reported by Argus, has been added to the chart. In October crude production dropped by 200 kb/d to 1,260 kb/d.
Since January, Kazakhstan crude production has dropped by 550 kb/d to 1,260 kb/d. Their OPEC production target is 1,470 kb/d. At 1,260 kb/d, Kazakhstan is below target and compensating for its earlier over production.
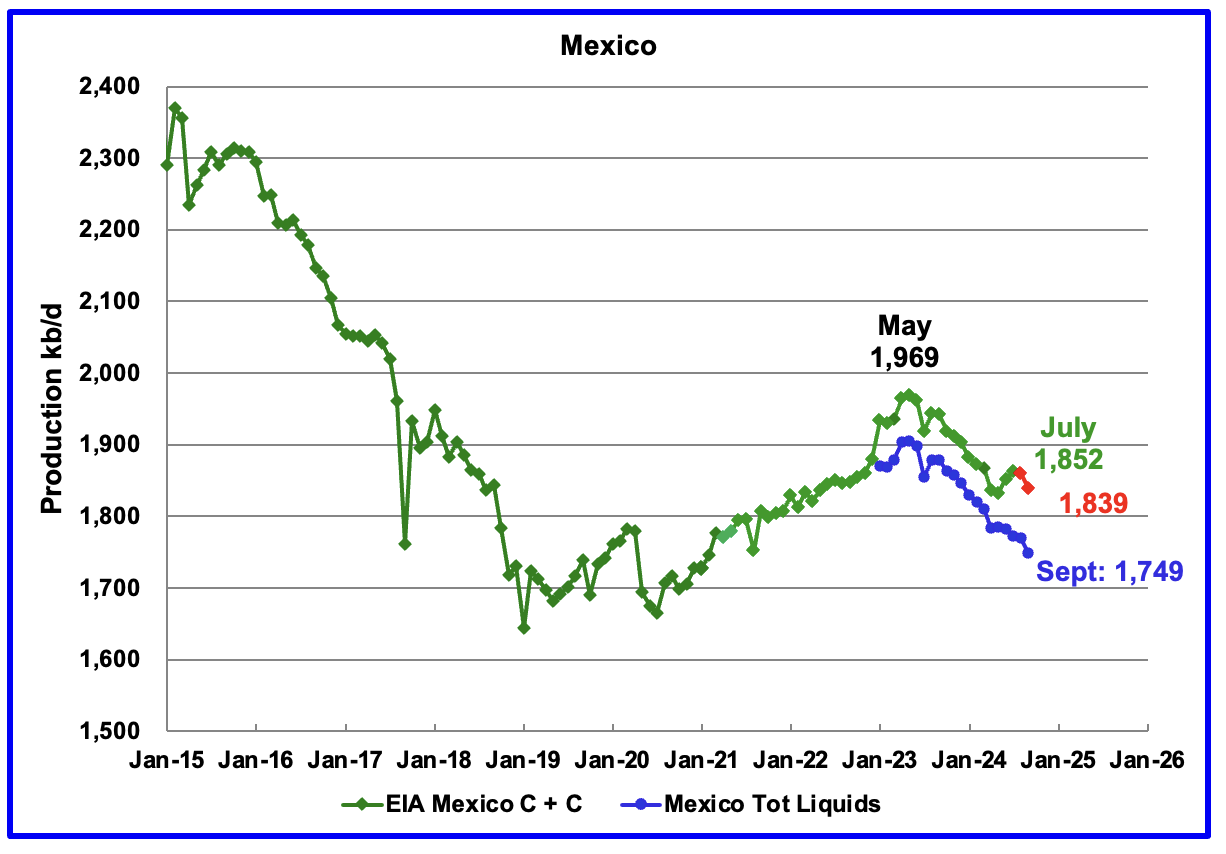
According to the EIA, Mexico’s July’s output increased by 10 kb/d to 1,852 kb/d.
In June 2024, Pemex issued a new and modified oil production report for Heavy, Light and Extra Light oil. It is shown in blue in the chart and it appears that Mexico is not reporting condensate production when compared to the EIA report.
In earlier reports, the EIA would add close to 55 kb/d of condensate to the Pemex report. The gap between the EIA report and Pemex on average has been close to 55 kb/d over the last 6 months. However for June and July, the condensate contribution increased to 70 kb/d and 90 kb/d respectively.
For August and September 90 kb/d has been added to the Pemex report to estimate Mexico’s August and September’s production of C + C, red markers. Note that Mexico’s production has continued to fall every month. The increase in the EIA report for June and July may just be a revision/correction.
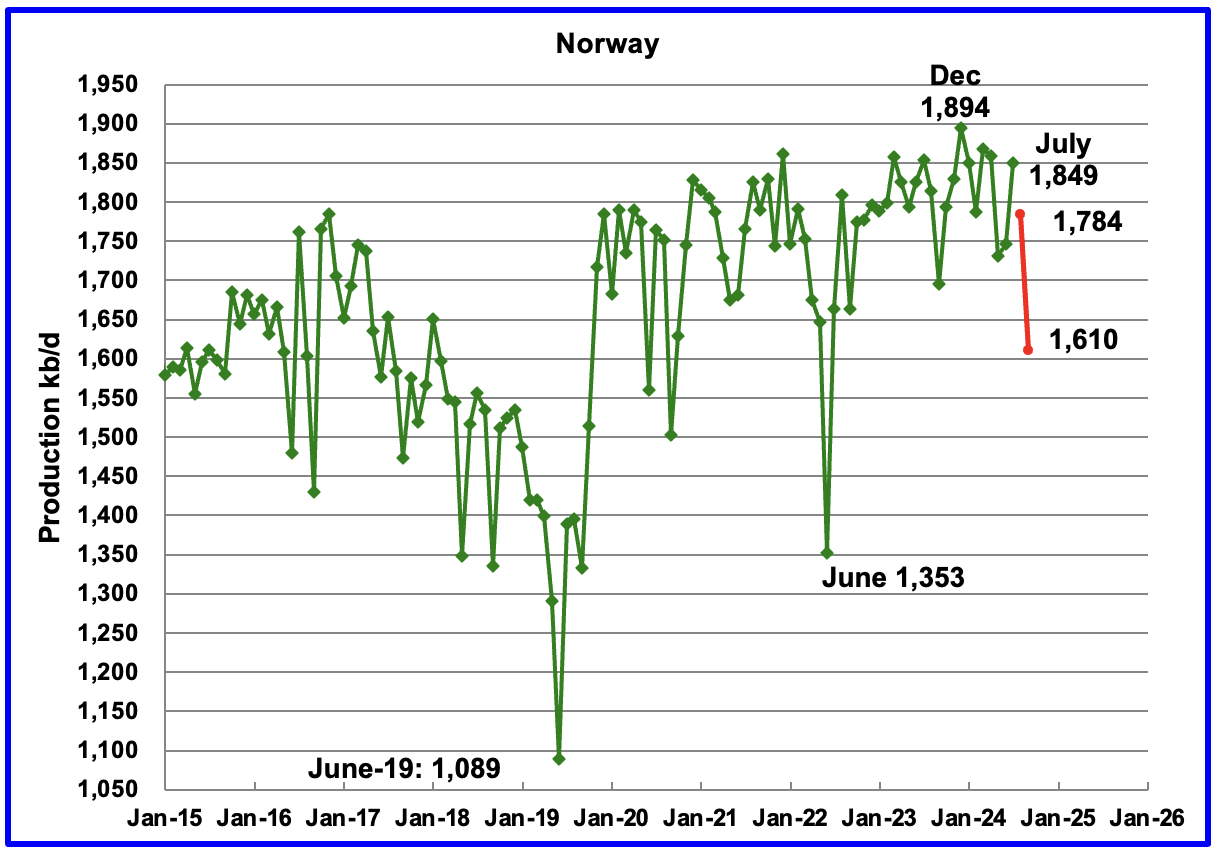
The EIA reported Norway’s July production increased by 103 kb/d to 1,849 kb/d.
Separately, the Norway Petroleum Directorate (NPD) reported that August dropped by 66 kb/d to 1,784 kb/d and September dropped to 1,610 kb/d, red markers.
The Norway Petroleum Directorship stated that September’s oil production was 1.5% more than forecast. This is an indicator that the drop was due to maintenance.
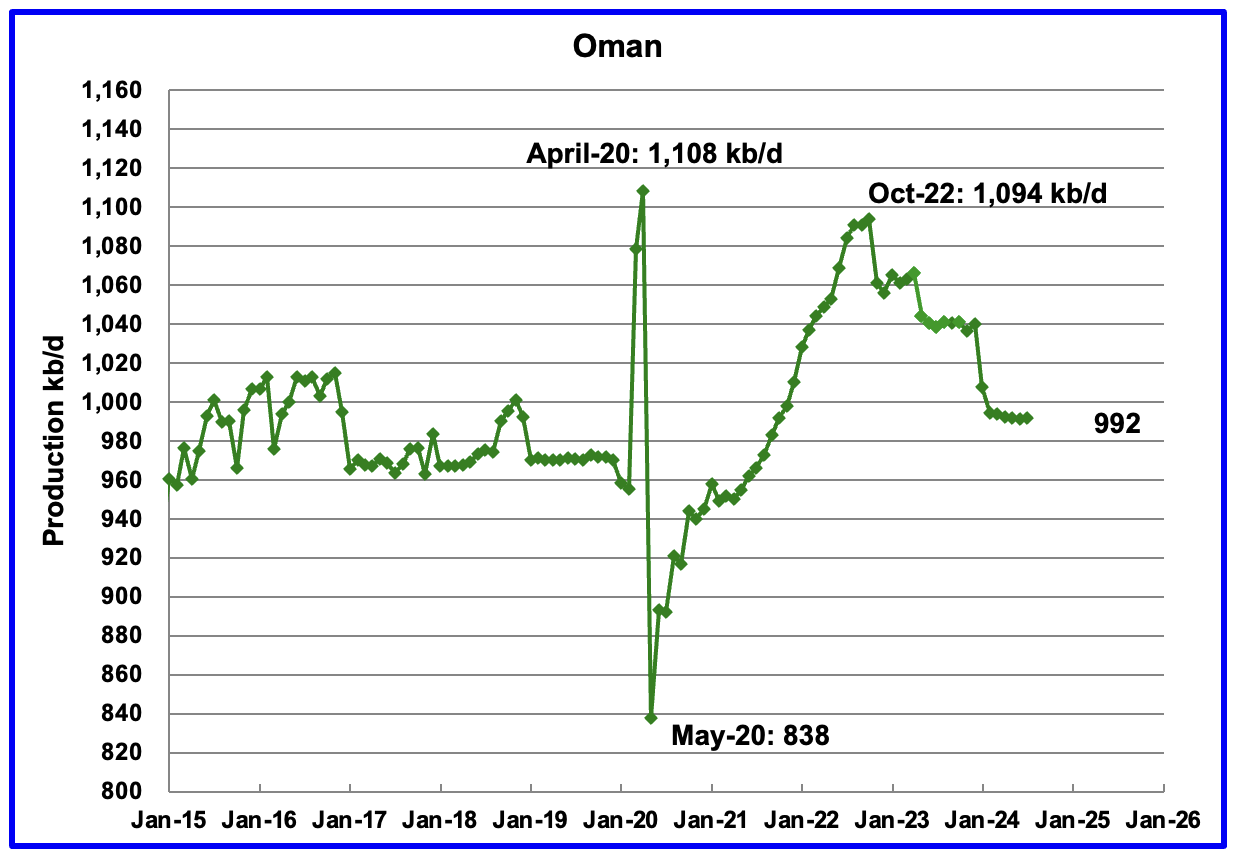
Oman’s production had risen very consistently since the low of May 2020. However production began to drop in November 2022. According to the EIA, July’s output rose by 1 kb/d to 992 kb/d.
Oman produces a lot of condensate. The OPEC MOMR reports that crude production in June was 766 kb/d, 225 kb/d lower than the EIA’s C + C.
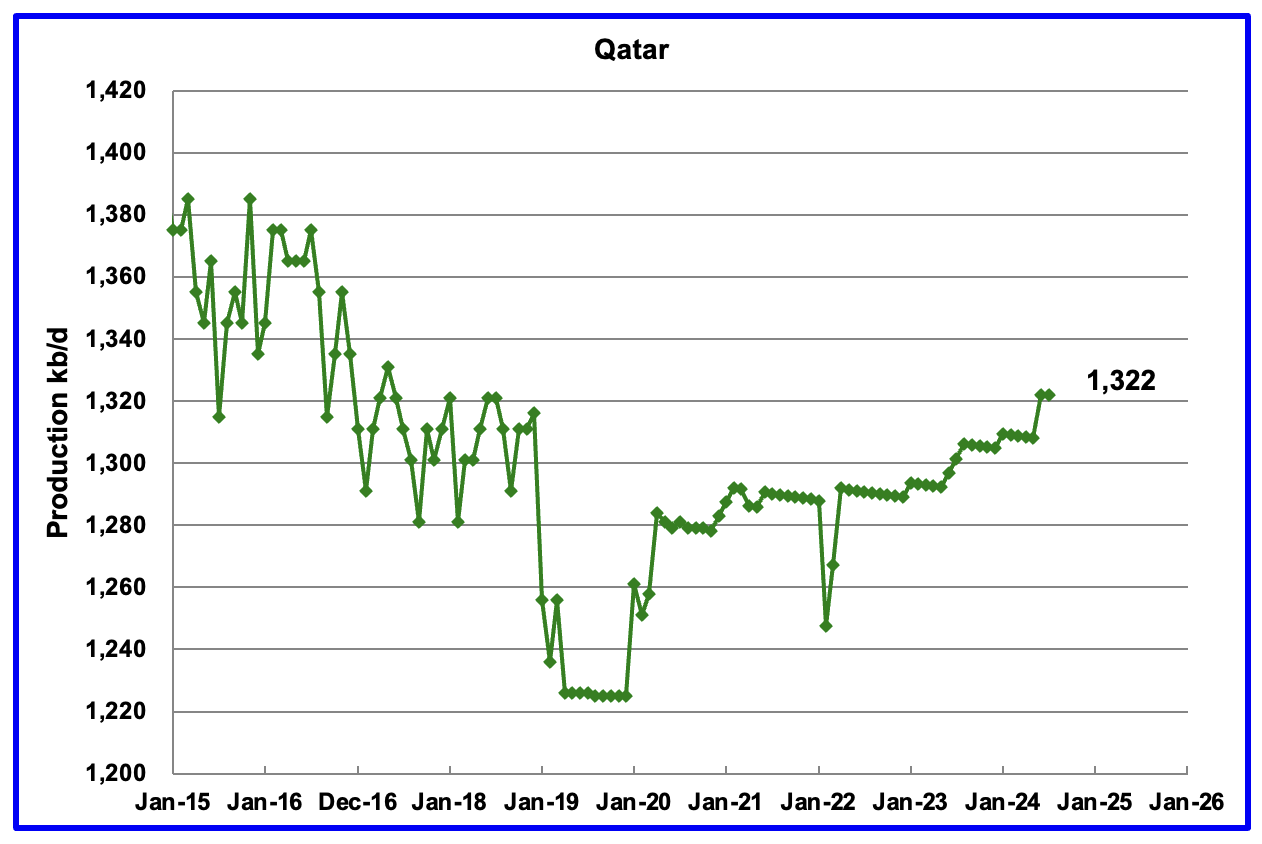
The EIA has been reporting flat output of 1,322 kb/d for Qatar since early 2022. However the current July update has revised down all of that production data. Qatar’s July output was reported again to be 1,322 kb/d.
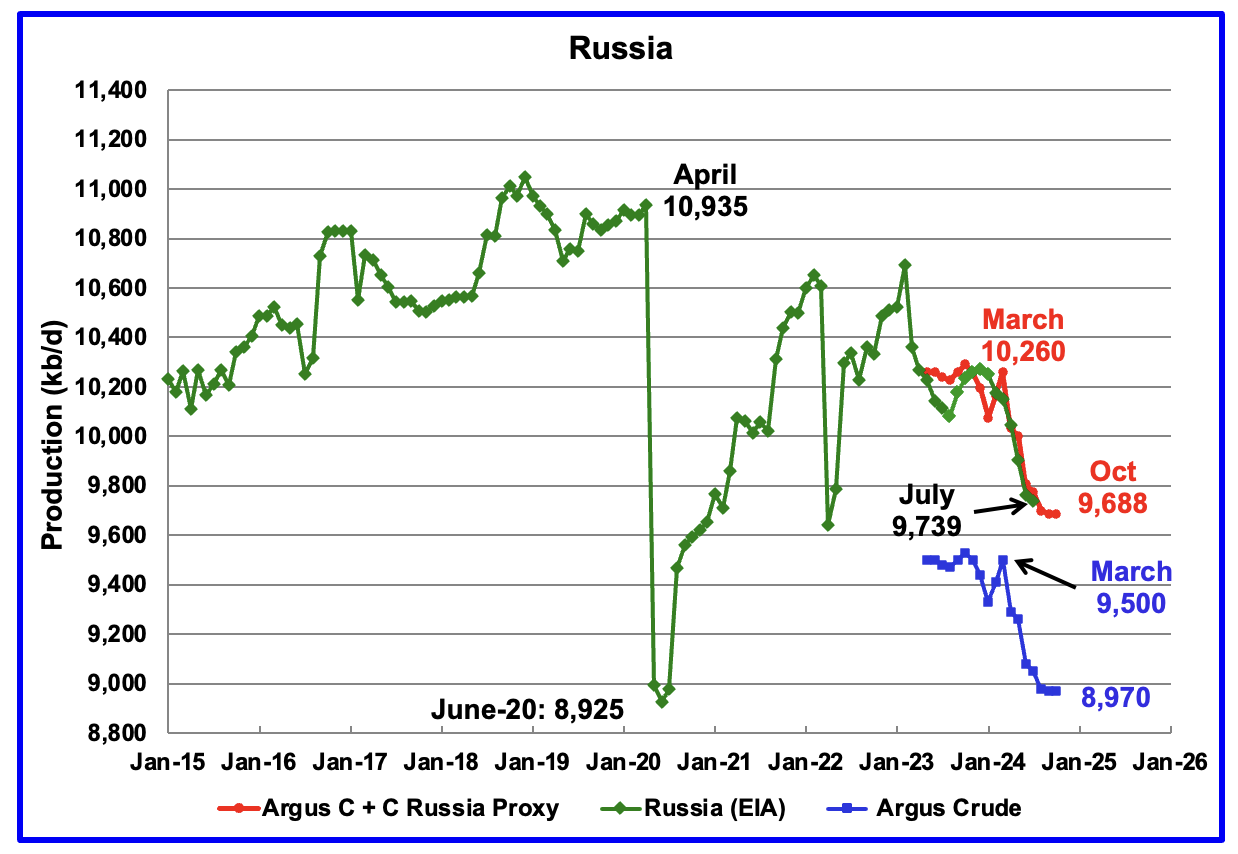
The EIA reported Russia’s July’s C + C production dropped by 25 kb/d to 9,739 kb/d.
Using data from Argus Media reports, Russian crude production is shown from May 2023 to October 2024. For October 2024, Argus reported Russian crude production was 8,970 kb/d, unchanged from September, blue markers. Adding 8% to Argus’ October crude production provides a C + C production estimate of 9,688 kb/d for Russia, which is a proxy for the Pre-War Russian Ministry estimate, red markers.
According to Argus, Russian crude production of 8,970 kb/d is in compliance with their OPEC target of 8,980 kb/d. However Platts is reporting Russian production of 9,030 kb/d which is 52kb/d higher than the quota of 8,978 kb/d.
In pre-war times, the Russia Energy Ministry production estimate used to be 400 kb/d higher than the EIA estimate. For July, the Argus proxy estimate is just 35 kb/d higher.
Can we believe the Russian production numbers? What are their sources of information?
According to this Article Russian September production was “8.97 million barrels a day last month, the people said on condition of anonymity because the figures aren’t public. That’s down about 13,000 barrels a day down from the August level.”
The last two paragraphs, shown below, provide some insight on why it may be necessary to take the Russian information with a grain of salt. Since the data is classified, are these official sources providing information with the approval of higher ups that is designed to put Russian oil production in a more favourable light
“Russia has classified official output data amid Western sanctions over the Kremlin’s invasion of Ukraine, leaving oil market watchers with just a few gauges, such as seaborne oil exports and domestic refinery runs, to follow trends in the industry.
Earlier this year, Moscow also changed the way it reports data used to compile OPEC+ production estimates, making an independent assessment of its compliance with output cuts more difficult. The Energy Ministry now reports the data in barrels per day and appears to be using a ton-to-barrel ratio at the lower end of the traditional conversion factors used by analysts for Russia’s crudes.“
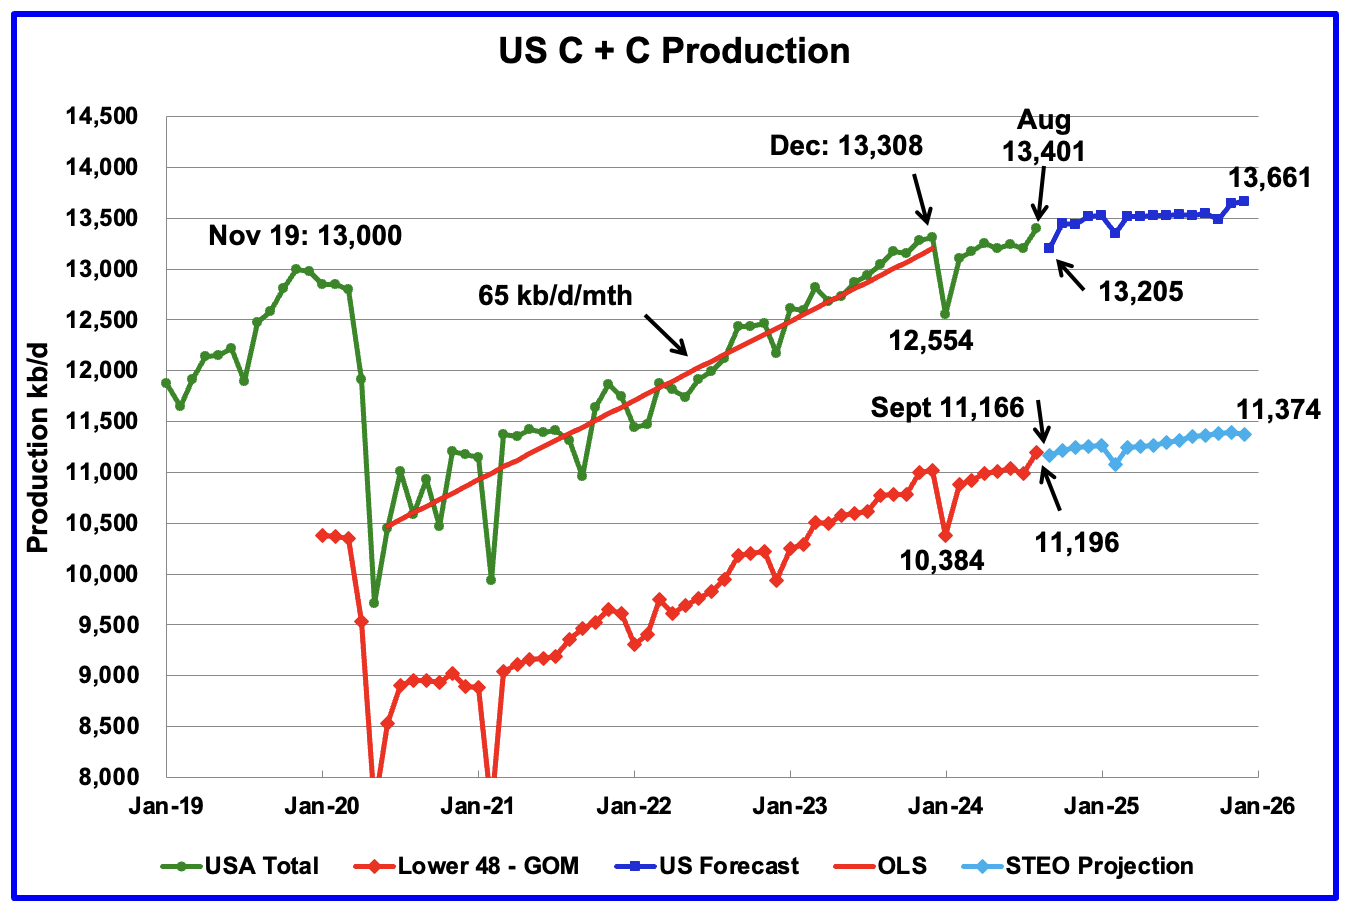
The November EIA/STEO has made a small change to US oil production from its previous forecast posted a week ago. The EIA continues to forecast flat US oil production from November 2024 to October 2025 but has lowered December 2025 production by 51 kb/d to 13,661.
From August 2024 to December 2024 oil production is estimated to increase by 260 kb/d. Production growth slows after November 2024.
As always, excellent work!
From my view, from the executive summary not included, there would in my estimate be roughly be 3000 kb/d coming online in the next year or so covering the different nefarious declines and help reaching a new peak. However, not that many countries seems to be in a position to help in that case, albeit some are rising quite a few are also declining so I would still place my bet on Rons 2018 prediction. Hedge accordingly would be my recomendation, just in case they´re not able.
Laplander,
The long term average annual rate of increase for World C plus C from August 1983 to July 2024 is about 750 kb/d using OLS on all data. Prior to the pandemic (August 1983 to July 2019) the long term average annual rate of increase for World C plus C was 834 kb/d. The actual rate of increase varies year to year.
Laplander
Thanks
I don’t include an executive summary because there is not much change from month to month, almost boring. The charts are like watching grass grow.
As for supply, I think there is at least 3,000 kb/d available for immediate supply. Right now the World is in a demand contained environment. We can expect a demand increase this year and next year in the order of 800 kb/d to 1,000 kb/d. What that means for end 2025 is production in the range of 83,000 kb/d to 83,500 kb/d.
WTI trading below $70/b and a typical backwardation of 15¢ to 20¢ implies that the oil market is well balanced and that supply increases can only come with increasing demand. As you have noticed OPEC has now postponed its proposed production increase by 3 months. Any increase will only depress prices further, which they don’t want. I can see OPEC/Saudi possibly trying one increase in February just to get the markets price reaction and strengthen Saudi’s hand in continuing to push for restraint.
I didn’t want to say so…since you did all that work…and I don’t want to bring you down. But I sort of feel the same way. Like…it’s not exciting or even intellectually interesting except during periods of boom or bust.
I actually think there is more benefit from articles on some of the basics. Like it amazes me that you have many commenters here who have followed oil/gas industry (as amateurs sure, but still reading about it) for 20 years and lack understanding of what NGLs are, or API gravity or the like.
I would at least consider some more general articles (the big picture, even if peaker biased) versus only having the monthly updates. I mean the monthly updates are fine…I’m not saying they should go away. But not be the only content.
For that matter, I do enjoy when you have some “special feature” like talking about Montana or Guyana or what have you. (Make sure to highlight it at the beginning…either place it there or just mention it will be covered. Or else it will just be lost in the weeds.)
Also, there’s a lot of interesting stuff going on outside of oil. Nominally this thread is supposed to cover oil and gas. But we almost never hear anything about natty. Or LNG. Or NGLs.
Then again, if you have people who have been following things for decades and still haven’t learned some of the basics, what is the hope they will learn it now? They just want to hear what they want to hear. Like MSNBC (or Fox) viewers who just want to hear what they want to hear…and consume content that tells them what they want to hear (not what informs).
I have friends working at my old job working on hydrogen storage, bipolar plates for both electrolyzers as well as the other way around, i.e. fuel cells, But as a collegue from the same company said, we might be just as happy, or more, to just live with less unnesessary stuf…
Nony,
There is usually a brief mention of natural gas and LNG in the STEO post, and NGL is included in MOMR report as the numbers are total liquids which includes NGL. When tight oil economics are discussed I bring NGL revenue into the discussion as it is part of the economics of any well. The focus of many reports (IEA Oil Market Report and OPEC’s MOMR) tends to be oil and as the name peak oil implies, the concern is mainly the availability of oil. I would agree natural gas is important, but there tends to be less reporting and information readily available especially at the international level where information tends to be reported annually. The NGPL information is available monthly.
World Dry Natural Gas from EIA.
Natural Gas Plant Liquids for World in kb/d
Based on EIA data from 2000 to 2023 the average cubic foot of natural gas is becoming wetter especially since 2010 (more NGL per cubic foot of dry natural gas produced.) The chart is for World natural gas and NGL. The extra liquids helps the profitability of the natural gas as the NGL is more expensive on an energy equivalent basis (more money per MJ).
Nony,
Good to see you still posting … offering fact-based info that runs somewhat contrary to the overall narrative (aka peak oil) on this site.
You may – or not – be aware that Cummins has just started all out production on its 15 liter engine natgas-fueled engine at its Jamestown, NY plant.
Introduced ~3 years ago in China, this engine is a big reason why currently one in five heavy duty trucks sold in China is fueled by natty (over 100% increase YOY).
A large West Coast distributer has said that he would immediately pull his 4,000 diesel fueled big rigs off the road in California when the 15 liter natgas engine became available due to its economic and environmental impact.
Near future will greatly employ – and be influenced by – abundant, low cost natgas. Electricity demand from AI being just one of these applications.
(You have obviously been following the oil production build out in the Buckeye state. Are you also following the ever growing footprint of the Utica in the Commonwealth? The march across the Northern Tier continues apace. The few Deep Utica wells just east of Pittsburgh are nothing short of colossal … semi-dwarfing the already prodigious output from the Mighy Marcellus wells on the same pads. Anyone not recognizing that a century’s worth of supply is available is simply not paying attention.)
X15 Cummins- “Back of cab natural gas fuel delivery systems can hold up to a 175 diesel gallon equivalent (DGE), which equates to a range of around 800 miles. Range is of little concern, even with 1,400 places to fill up. Saddle tanks could can add up to 60 more DGE, and there’s plenty of room along the rails for them.
You do give up some miles per gallon in the switch from diesel to natural gas: from around 7 mpg to roughly 5 diesel gallons equivalent per mile. But, according to the DOE, a gallon equivalent of CNG is $2.90 compared to $4.07 for a gallon of diesel. National fuel retailers, too, are also fairly aggressive with pricing to lock in CNG contracts, so there are further discounts out there and savings to be had.
It takes about 30 minutes to fast fill the tanks to 80%. Fast fill creates heat and pressure inside the tank. Once the heat dissipates, the pressure drops, leaving room for more fuel. Still, 80% capacity enables a range of up to 640 miles. A complete slow fill is typically done overnight. ”
https://www.ccjdigital.com/test-drives/article/15679119/test-drive-peterbilts-579-with-cummins-x15n-nat-gas-engine
Hickory,
While I no longer give much time/attention to all things hydrocarbon, I have briefly looked into recent developments regarding methane storage.
Absolutely fascinating.
Last time I looked, the ‘sub category’ of using porous/flexible polymers for adsorbtive purposes (that’s with a ‘d’, not ‘b’) seemed to be in the ascendancy.
(I believe Ovi had some long ago exposure to this approach.)
Now, it seems like something called Reduced Graphene Oxide-Based Aerogels has ‘taken the lead’ in cutting edge adsorbtive capacities.
If my understanding is correct, a single gram of this stuff can have a surface capacity of 2 to 4 football fields … the entirety of which can store methane.
The fuzzy heads always keep on accomplishing some amazing feats.
I think the big issue issue is distribution, not engines. There are plenty of city buses running on natty (or propane) and have been for a while.
Nony,
Initial (ongoing, actually) build out would likely focus on high traffic, strategically situated locations on the interstates.
More locally – such as in, possibly, California – more numerous filling stations would appear.
I am not sure if the big rigs will hold LNG or CNG ‘tanks’, (I suspect LNG), but striking advancements continue to arise in this realm of hardware distribution.
CG,
It’s not a new idea to run vehicles on natty. Remember the Pickens Plan? It’s almost 20 years overdue from the hype.
Phone me if this ever really amounts to much. Not just act like this is some new thing, or that it’s really taking off. I won’t buy it until it really has major uage.
“From July 2024 to December 2025, World oil production is estimated to increase by 3,043 kb/d. This appears to be optimistic…”
Good sentence for connoisseurs of understatement…
Some guy,
I agree the estimate looks optimistic. From July 2022 to July 2024 the average annual increase in World C plus C was about 96 kb/d using OLS on EIA data. From Dec 2021 to Dec 2023 the average annual rate of increase was 1220 kb/d, so that seems more reasonable than 3043/1.5=2029 kb/d. Note however that the OPEC big 4 is holding back about 2000 kb/d of output and we are likely to see at least 1000 kb/d per year from the non-OPEC plus big 6 (Argentina, Brazil, Canada, Guyana, Norway, and US) so if the demand is there there may be supply to meet that demand at the appropriate oil price level. Also the STEO estimate has been being revised lower month by month as demand estimates have been gradually reduced over time.
Argentina is also growing fast,
https://www.linkedin.com/pulse/low-gor-black-shale-oil-continue-rise-sheng-wu-wjh5c/
Sheng Wu
Nice increase over the last four years. For 2024 production has been flat and is possibly in a plateau phase.
yes, looks like the conventional oil and gas are in terminal decline in Argentina, while Vaca Muerta shale oil and gas are picking up more consistently,
https://app.powerbi.com/view?r=eyJrIjoiNDQ1OGQ4MGMtYmQyYi00NzYxLWFlNTMtOGI0ZjRhZGE4NTBkIiwidCI6IjVmMThiN2ZhLTdmMmQtNDQ5ZC1hZjhkLTliZTNiM2ViZmFhYSJ9
Interesting scenario you point out regarding Canadian production. Any idea what the Canadian domestic consumption level is?
Hickory,
EIA estimates 2599 kb/d for July 2024 Canadian refined petroleum products consumption and 2407 kb/d (average) over most recent 12 months (August 2023 to July 2024). The highest trailing 12 month average was in March 2019 at 2585 kb/d.
https://www.eia.gov/international/data/world/petroleum-and-other-liquids/monthly-petroleum-and-other-liquids-production?pd=5&p=0000000000000000000000000000000000000000000000g&u=0&f=M&v=line&a=-&i=none&vo=value&vb=230&t=C&g=none&l=249–34&s=315532800000&e=1719792000000&ev=true
Thank you, so roughly 2 Mbpd Canadian export currently.
Hickory
According to Statistics Canada: “Canadian refining of finished petroleum products rose for the third consecutive year, up 3.9% from 2022 to 120.7 million cubic metres in 2023—a return to pre-pandemic levels.
Canada is not ranked among the top refiners of petroleum products in the world. Nonetheless, Canadian refineries could have filled 48,000 Olympic-sized swimming pools with their 2023 production.”
Using 6.3 barrels per M3, that comes out to 2.08 million barrels per day of Refining capacity.
Also attached is another Cdn source that states
Net Production 2,041,797 b/d
Exports 344,765 b/d
Imports 133,186 billion/d
Consumption 1,440,287 b/d
Those numbers don’t seem to balance and the consumption is different than reported by the EIA. I wonder if refined products might exclude products like asphalt.
Not clear how the EIA comes up with 2.4 million barrels per day of consumption.
https://www.statcan.gc.ca/o1/en/plus/5812-canadian-petroleum-product-refining-returns-pre-pandemic-levels-refined-petroleum
https://energy-information.canada.ca/en/subjects/refined-petroleum-products
Ovi,
Note that EIA includes LPG( not part of refinery output) in their consumption estimates and may also include consumption in the refinery process. In short the US measures differently.
As I´ve mentioned before, would be very interesting to see an update of Westtexas ELM charts, or that statistics site that had those great charts?
For preferance measured on MJs too, just for fair comparison.
After some thinking I remembered it was mazamascience, but it seems to be dormant now, unfortunatelly. Hopefully someone will continue that work.
And came to think of it, an Export Capacity Model would also be very interesting, in MJs, might need another acronym though since ECM is taken already by the automotive industry.
I have just done these posts:
US crude oil imports by gravity and country of origin (part1)
https://crudeoilpeak.info/us-crude-oil-imports-by-gravity-and-country-of-origin-part-1
US crude oil imports by gravity and country of origin (part2)
https://crudeoilpeak.info/us-crude-oil-imports-by-gravity-and-country-of-origin-part-2
US is still importing crude oil from the Persian Gulf, 540 Kb/d in the last 12 months
1. You are actually one of my favorite peak oilers.
2. You have Brazil listed in the area chart for Africa (and SA). No big deal…just FYI.
3. From the highest level, what this sort of shows is that the international market works, or works well enough. When different countries grow/decline in production (to included even domestic production), then alternate sources fill in. It’s not like we have to have country X and if it goes away, we just go thirsty. Price differentials move a little and trade flows.
4. Some of the changes in supply are not just because of producer growth/decline, but have to do with political issues. Sanctions on Vz being key one to note.
5. In terms of most efficient transport, we are the “natural” market for Canadian heavy crude and for Venezuelan crude. It is sort of one of those political dislocations that Vz crude is heading to India, for instance. Similarly Europe is the natural market for Urals. But with the sanctions, crude still flows. Just the producers are getting a little less money (having to discount their crude to incent transport to India and China). And some money is being made by shipping companies.
6. I remember having an argument with “Big Orrin”. He said, several year ago that nobody wanted US light crude. And that the this would stop growth in US production. In fact, European consumption of LTO has grown substantially. And it hasn’t even taken a reversal of the global or regional quality premium for 45 API oil. (Still sells at a premium to medium sour.) In fact, WTI almost dominates crude trading at Rotterdam. Sometimes with higher volumes than all of N Sea crude. And US crude is several MM bopd higher than when we argued.
7. There’s also substantial growth in US consumption of LTO. Obviously, imports of light crude have been pushed out. But also more and more medium sour is pushed out. Despite the blogosphere chitchat about “dumbell crude” dangers, it is still very common to blend WCS (from CA) and WTI (from US) and make a medium sour out of them, which matches US refinery kit…and is attractively priced.
8. I don’t expect SA crude imports to go to zero. There is a Gulf Coast refinery JV that they have…and it imports SA crude no matter what (for appearances I guess).
9. The US is also a complex place geographically. E.g. there are no good pipelines to California, from Texas. So California must import from the Pacific. Also, obviously HI imports.
Thanks for your comments
I have corrected the Africa charts
Anonymous,
You make some very pertinent observations with respect to the knowledge and capabilities of many on this blog. Not only are many who are commentating on reservoir properties making broad assumptions that are very often flawed but they are also often at a total loss with respect to crude oil composition and NGL’s. There is too much emphasis on B/D and BOE for my liking. A barrel of oil is very different to a barrel of NGL’s.
Outside of the US many oil products are traded in mass units, which are much more meaningful when making comparisons. The generally accepted metric for crude oil is 7.3 bbl per mt (It can vary from about 6.8 to 8+). For NGL’s the conversions are:
ethane 17.66 bbl/mt
propane 12.4 bbl/mt
isobutane 11.19 bbl/mt
n-butane 10.78 bbl/mt
natural gasoline 9.45 bbl/mt
Then we have the internet experts who having read about crude oil refining on Wikipeadia are able to advise on the refining of LTO .
Those of you who have read a patent will be aware of the term “those familiar with the art”. The snag is with oil refining there are less and less of “those familiar with the art” and they are becoming few and far between.
There are several key parameters that must be considered with any crude oil. These are usually described in the crude assay. and will include:
The boiling range of the key components (cuts)- naphtha (light and heavy), jet kerosine. diesel/ gas oil, atmospheric residue, and the volume% and weight % of each cut.
The PONA analysis ( paraffins, olefines, naphthenes and aromatics).
The density of the whole crude and the component fractions
The sulphur content of the whole crude and its distribution in the components.
The atmospheric residue is normally vacuum distilled into vacuum gas oil (VGO)and vacuum residue.
The Vac Resid is normally characterized in terms of SARA ( saturates, aromatics, resins, asphaltenes)
The VGO is an important feed for gasoline, diesel and lube production. VGO is cracked in either a fluid catalytic cracker for gasoline or in a hydrocracker for jet and diesel and Group 3 lubes.
The naphtha is typically split into light and heavy naphtha. The light naphtha is isomerised and used for gasoline production and the heavy naphtha used for catalytic reforming.
Naphtha also varies. Paraffinic naphtha does not make good gasoline. N&A naphtha is rich in naphthenes and aromatics and is best for catalytic reforming.
Learning the intricacies takes time and really requires exposure to the business by working in the business. From my experience few of the consultants who produce BS studies are learned in the art, and I am being kind.
There is no one refinery configuration. Some of the newer ideas such as crude to chemicals are very difficult to operate consistently. The process plants are so interlinked that one outage can bring down the entire refinery. The Dangote refinery in Nigeria is one such plant and it is only a fuels refinery. The Achilles heal will be the residue hydrocracker which will be very tricky to operate reliably. The same applies to the Petronas Pengerang refinery. On commissioning the residue hydrocracker caught fire and had to be rebuilt.
What about NGL’s?
NGL’s are really a niche that even fewer people understand well. For instance what is Y grade mix? How much ethane is allowed in natural gas (sales gas) ? What is lease condensate? What is the main outlet for ethane, propane and butanes? What is natural gasoline and where is it produced.?
Over many postings I have tried to provide information in a clear and concise way. Clearly I have failed as most on this blog are still making the same mistakes.
Yeah measuring oil production in barrels seems completely flawed.
Thanks,
I and probably many others appreciate these comments without too much bias.
It could be worth to discuss if we have enough refinery capacity in total. But probably there has been overinvestment going on like in most sectors of the global economy the last 10 years (due to in part low interest rates).
We are in a strangely good place right now in the oil market (and LNG, gas…the energy markets are interlinked). I would argue that technology have contributed to a shift in supply and that implies getting more out of established resources as well. At the same time the dollar has been getting stronger, making a lower oil price more feasible elsewhere in the world.
If importing nations get threatened like Japan when embargoed in WW2 when it came to oil, the war option could be there. So I am very happy for every policy that brings stability. There are concerns (not difficult to understand) when it comes to the Trump administration. But in the context of building cushion after cushion after cushion to actually do some energy transition work, a bit of disruption when it comes the supply side of the economy would probably be more warranted than the alternative.
Honestly, I think the meta story is really more one of saying that the system works, not that it doesn’t. There are a vast array of different crude qualities and a vast array of different refineries. And dislocations happen quickly (e.g. fires, hurricanes) and over years (growth, decline of supply and of markets). Even the type of product demanded changes over time. Yet the system of world trade, with ocean shipping still handles it all in the end, with some small geographic and quality arbs (price differentials) to drive those changes.
The whole story that Matt showed is one of they system handling dislocations. So…I would not get so worried about linkages breaking. Especially in oil as opposed to natty. It’s a huge pool of demand and supply and has readily adjusted to things like the growth of shale (and before that the growth of tar sands). And even before that, things like California Kern River, which is 17 API and full of sulfur!
The market functions. You don’t need an “Adjustment Bureau” to keep it on plan:
https://en.wikipedia.org/wiki/The_Adjustment_Bureau
The “Adjustment Bureau” would most likely be a soft one, unless otherwise required. At least politically.
Oil is by definition is a slippery market, so I agree that to control that market would be one of the most difficult tasks; actually almost impossible.
Energy transition “work” is not really well linked with the oil market, but energy in general. How to conserve energy should be tried out in practise and in any case small scale, in order to have some sort of insurance policy. And most governments have plans in this direction, so there is not really much to add to the overall discussion when it comes to that.
“The whole story that Matt showed is one of they system handling dislocations. So…I would not get so worried about linkages breaking. ”
Put me down as doubtful that smooth shuffling of various oil products across the seas will remain a reliable condition over the next 10-20 years. In fact I think that a wise planner would count the opposite as likely.
Replying from the previous post (Dennis):
“ Kengeo,
Conventional oil output (coinciding with USGS definition for non-continuous oil) peaked in 2016 at a cumulative output of 1273 Gb. If we make the (often incorrect) assumption that the peak occurs exactly at 50% of the URR this suggests a conventional oil URR of 2546 Gb, often the peak occurs at cumulative output of less than 50% of URR, for my scenario it is about 45%. As of the end of 2023 about 1450 Gb of conventional oil had been produced. Your estimate of 1950 Gb for conventional oil is at least 850 Gb too low.
The 2P estimate does not include new discoveries, contingent resources or reserve growth, this is a common mistake that people make.”
Your argument might have worked 20 years ago, but reality is that since ~2015 reserve growth has been minimal.
URR for 1P is approximately 1800 Gb, and 2P is 2000 Gb. If you are talking about the US and growth of LTO, that’s fine, but that claim simply doesn’t work on a global scale.
Dennis, Would love to see your current shock model and how the data are fitting, any major revisions underway?
Kengeo,
Compare the 2016 Rystad estimate (reserves as of Dec 31, 2015) with the 2024 report (reserves as of Dec 31, 2023), if we deduct US, Canada and Venezuela from the World total for 2P reserves we eliminate about 99% of unconventional oil reserves (based on USGS definition for continuous resources). In 2015 the number was 552 Gb for World minus (US plus Canada plus Venezuela) and 2023 the number was 640 Gb for 2P conventional reserves, over the 2016 to 2023 period 205 Gb of conventional oil was produced. If there was no increase of 2P reserves due to reserve growth or discoveries over that 7 year period, we would expect 2P reserves to be 347 Gb, but they are 640 Gb suggesting an increase of 293 Gb over 7 years or an average rate of increase of about 42 Gb per year for conventional 2P reserves.
As to how the data are fitting, they fit fine through 2023, the model looks at annual average output so we wont have data for 2024 for a while.
If we use the EIA STEO estimate for 2024 of roughly 82 Mb/d, my shock model from July 2024 is similar, but lower than the roughly 84 Mb/d for STEO in 2025 (shock model guess is 82.5 Mb/d in 2025). Peak is 83.2 Mb/d in 2028 and 2029.
Total 2P URR for C plus C is 2241 Gb as of end of 2023, as I have often pointed out you should not ignore contingent resources as this leads to underestimates, also oil discovery often occurs.
If we exclude 2P reserves of Canada, US and Venezuela at the end of 2023 (98 Gb combined) the conventional 2P reserves are about 2143 Gb, probably 2200 Gb is a good guess as there are some conventional reserves in each of the 3 nations excluded. The exact amount is not clear.
Dennis Coyne
Could you share your expectations for the period up to 2050?
OMAR,
Beyond 2030 any guess is highly speculative. The scenario below assumes demand is relatively low as the transition to electric land transport proceeds which leeds to low oil prices. The extraction rate is for conventional oil only where I define conventional oil as non-continuous oil as defined by the USGS, this excludes extra heavy oil (API gravity of 10 degrees or less) and light tight oil, which are both modeled separately from conventional oil. The extraction rate is read from the right axis and is the percentage of producing conventional oil reserves that are extracted (produced) annually.
By 2050 the guess could vary between 50 and 70 Mb/d depending on the assumptions made. Unconventional C plus C is about 4.6 Mb/d in 2050 for this scenario, in 2023 unconventional C plus C was 12.7 Mb/d.
The scenarios below explore different extraction rate assumptions with the low scenario having somewhat lower extraction rates than the medium scenario (presented above) and the high scenario having somewhat higher extraction rates. The unconventional scenario remains unchanged in each of the 3 cases, variation in the unconventional scenario would add further spread in the results. The high case has extraction rates return close to the 1990 level of 7% and the low scenario has extraction rate increasing to a maximum of 5.22% by 2029 after 2023. The medium scenario has a high extraction rate of 5.98% in 2050 with a 2029 rate of 5.32%. The high scenario has an extraction rate of 5.37% in 2029 and 5.44% at the peak in 2030 at 84 Mb/d.
Thank you very much.
Thanks Dennis –
Please let me know if I got this right, based on your forecast, peak oil can be described as follows:
1.A multiple peak event, 1st peak in ~2019.
2.Dominated by a narrow plateau of peak production lasting more than 5 years but less than 10 years.
3. A broad plateau lasting more than 30 years and less than 40 years, roughly centered at 2024 (ie 2004 to 2044 or 2009 to 2039, or similar). 2024 being the 2nd peak.
4. A 3rd and final peak sometime between 2025 and 2030, likely similar in magnitude to 2019, slightly higher or lower.
5. Decline of ~1.5 mb/d annually from ~2035 to 2050.
6. A URR of ~3,000 Gb, suggesting 51 years of oil is remaining at current production levels.
Lastly, do you still point the finger at Covid as the primary reason the 2018/2019 peak remains?
When I add reserves to produced amounts for varying years, I get 1P peaking near 1800 Gb and 2P peaking near 2000 Gb, this suggests that there is less than 500 Gb of economic oil currently available, which is 3 times less than what your estimate is built upon…when will this 1000 Gb of mystery oil show its face????
It’s worth noting that 5 countries hold a supposed 1,100 Gb of the remaining oil:
Venezuela- 300 Gb
Saudi Arabia – 270 Gb
Iran – 210 Gb
Canada – 160 Gb
Iraq – 150 Gb
Yet, they only produce 1/4 of world production…
How do you reconcile this?
Does it suggest that 3/4 or supply is at near term risk?
For those 5, do you see there production skyrocketing soon to meet demand?
In five years time, when there will be 150 Gb less oil remaining, who is still producing and who is not?
What about 10 years?
What about 15 years when there is ~400 Gb less than present day?
I know you tend to shy away from bottom up analysis, is that still the case?
Uh…four of the five are part of OPEC. Which is a cartel that restrains supply to prop prices up. (Duh.)
Kengeo,
Rystad has 2P reserves at about 730 Gb at the end on 2023 ( July 2024 report), World cumulative C plus C was about 1450 Gb that is close to 2200 Gb for 2P.
My scenarios have URR of about 2900, so about 700 Gb more 2P reserves needed over a 180 year period as 2900 Gb cumulative output not reached until 2200.
About 300 Gb of reserves growth and discovery has occurred over the past 7 years, about 43 Gb per year. My scenario has about 3.5 Gb per year added on average over 180 years roughly 7 times lower than recent rates.
There are plenty of contingent resources and potential discovery to enable this.
Direct quote:
As of January 2024:
“ Rystad Energy also reports proven oil reserves at 449 billion barrels, according to recognized standards. This provides a lower limit for remaining oil reserves if no new development projects were to be approved and all exploration activities were stopped. This is a significant upward revision since 2023 driven by increased onshore infill drilling in Saudi Arabia.”
URR based on proven oil reserves = 1950 Gb
Kengeo,
Proved reserves are a poor measure those numbers are consistent with there being a 95% probability that reserves are larger than that, the 2P reserves are the engineering best estimate where there is a 50/50 chance that reserves will be either higher or lower than the 2P estimate. Think of it like measuring an 8 foot long board with a tape measure and finding that it is 8 feet in length, that would be similar to a 2P estimate. The board might be 8.001 feet or even 7.999 feet, a 1P estimate would be something like 5.5 feet, it would not be close to correct.
Note also the assumption that proved reserves might be a correct estimate if there were no further development of resources (that is no new oil or gas wells were drilled in the future) and all exploration for oil and gas stopped. Do these seem like realistic assumptions?
The 2PC resource for the World was 1224 Gb at the end of 2023, add this to cumulative production (1450 Gb) and we have discovered resources of 2674 Gb. When we add the expected discoveries by Rystad (2PCX=1536 Gb) as of end of 2023 we get a URR of 2986 Gb, somewhat higher than my scenarios.
From
https://www.rystadenergy.com/news/global-recoverable-oil-barrels-demand-electrification
The date for each of the years shown is Jan 1, so essentially if we look at year end instead (Dec 31) we would subtract one from each year.
So if we look at the proved reserve estimate for Dec 31, 2017 for example (388 Gb) and subtract the cumulative production from 2018 to 2023 we would have 179 Gb for 1P reserves at the end of 2023. The number reported is 449 Gb, some 270 Gb higher than we expect (if we were to have ignored contingent resources and future discoveries at the end of 2017).
I keep pointing this out, you don’t seem to understand resources and reserves.
Try this
https://www.spe.org/en/industry/petroleum-resources-classification-system-definitions/
Kengeo,
I do not try to guess future production from all nations in the World. OPEC holds back production so that prices don’t crash. Note that the Rystad 2PC estimate for Venezuela is 26 Gb and for Canada it is 110 Gb. For OPEC 2PC=597 Gb and non-OPEC 627 Gb, OPEC only produces at about 60% of the extraction rate of non-OPEC as of 2023. When OPEC needs to extract at higher rates, I imagine they will do so as long as oil prices are at a level where such production is profitable.
Let me rephrase, I do not try to do a forecast for each individual nation. Generally as nations with smaller reserves run short on reserves I expect their output will fall, then other nations with more reserves will increase output to fill the gap, exactly how it all plays out is impossible to foresee.
U.S. crude oil edges higher but closes below $69 as large surplus expected next year
According to this article: “Global crude supplies are expected to outstrip demand by more than 1 million barrels per day next year led by robust growth in the U.S., according to the International Energy Agency’s monthly market report.”
The STEO just reported that production would be flat next year but the IEA claims US production will experience robust growth next year.
The summary IEA report states:
“Non-OPEC producers will boost supply by roughly 1.5 mb/d in both 2024 and 2025.”
What does the iEA know that the EIA doesn’t?
According to Argus: “On global supply, the IEA has trimmed its growth estimate for this year by 20,000 b/d to 640,000 b/d. But for next year, it sees supply growth accelerating to more than 2mn b/d, led by the US, Canada, Guyana, Brazil and Argentina.
The agency said global observed oil stocks declined by 47.5mn bl in September to their lowest level since January. It also said preliminary data show stocks fell further in October.
https://www.cnbc.com/2024/11/14/crude-oil-prices-today.html
https://www.argusmedia.com/pages/NewsBody.aspx?frame=yes&id=2628562&menu=yes
From the November Oil Market Report from the IEA
World oil demand is forecast to expand by 920 kb/d this year and just shy of 1 mb/d in 2025, to 102.8 mb/d and 103.8 mb/d, respectively.
…
we continue to expect the United States to lead non-OPEC+ supply growth of 1.5 mb/d in both 2024 and 2025, along with higher output from Canada, Guyana and Argentina.
Keep in mind that the IEA focuses on total liquids rather than C plus C, if we use similar numbers from the STEO for the US we have 21.97, 22.61, and 23.07 Mb/d for 2023, 2024, and 2025 respectively for US total liquids annual average output in the November STEO. So growth of 1.64 Mb/d in 2024 and 0.46 Mb/d in 2025, taking both years together the EIA has 2.1 Mb/d of growth vs 3 Mb/d for the EIA estimate so a big difference especially in 2025.
If we assume the EIA estimate is better the 900 kb/d smaller output from the US can easily be made up by OPEC. Note also that the IEA estimates for demand are slightly lower for the World than the EIA STEO estimates of 103.13 and 104.35 Mb/d in 2024 and 2025. If we take the averages it is about 103 and 104 Mb/d for 2024 and 2025. OPEC’s most recent World demand estimate is 104 and 105.6 Mb/d in 2024 and 2025, my expectation is that OPEC will need to revise its estimates, which seem to be what they wish demand was rather than what it is.
Dennis
I have to wonder if that IEA supply growth statement is intended to drive the price of oil down. Clearly they are saying that supply will be greater than demand, even if OPEC stands pat. Recall they represent primarily oil purchasing nations.
Ovi,
Perhaps they are trying to talk prices down, based on the data I see, it seems demand is still pretty soft and supply is adequate, but the data is constantly being revised, so this may be an illusion due to poor estimates.
Simple question here. To what degree can fracked oil production occur in the rest of the world as it has here in the US?
This has been written about extensively. E.g.
https://www.eia.gov/todayinenergy/detail.php?id=11611#
Geologically, there are vast amounts of similar resources in the rest of the world. There are however economic and legal (societal) barriers to development as in the US (and Canada).
So…it sort of depends on what you mean. Near term, of course, the legal/economic barriers are limiting. However, as the peak oilers have often pointed out to us (with depletion), geology is the key variable. So if the oil is there…and it just takes chances in policy, of course that means it can be developed later when/if policy changes. (E.g. if prices skyrocket in an “Oldavi Gorge” peak oiler scenario.)
1. The US (and Canada) has the most professional/trained/efficient industry at drilling and fracking. In fact, it’s cheaper…because of this efficiency and skill. Drilling overseas usually costs more. But this is a relative issue. Many other countries have oil industries of their own. And with sufficient $$ incentive, US labor can be brought in (as is done with a lot of offshore drilling). Furthermore, the industry has gone through a lot of “learning by doing”. So…if overseas drillers drill a lot of shale HZes, they will learn to keep the bit in zone (and other work practices) as they gain experience.
2. The US has very good supporting infrastructure. Especially pipelines. But also roads, railroads, docks, etc. Projects done in remote areas with poor/missing infrastructure are more expensive/difficult/time consuming as the infrastructure needs to be installed to support development. With sufficient economic incentive (and time), many large projects can be facilitated by building the needed infrastructure.
Of course, small fields in remote areas will be difficult to develop and may never justify themselves. But Bakken sized areas will likely justify the cost of developing the infrastructure.
This is not a new problem in the world and the mining industry has had to deal with it also. Consider this project for example:
https://en.wikipedia.org/wiki/Quebec_North_Shore_and_Labrador_Railway
Or many overseas oil/gas megaprojects. E.g. developments of remote natural gas fields, with liquifaction (i.e. a huge and expensive LNG facility) sometimes needed as dependent infrastructure to bring the resource to market.
3. Many areas (especially in Europe) have societal resistance to oil and gas development. Especially “fracking” (that NYT-coined word). Consider for instance that NY state has some very attractive Marcellus shale, just across the border from PA. The same is true for extreme Western MD. In both cases, fracking has been forbidden by law.
In addition the city of Pittsburgh is smack dab in the center of a Marcellus sweet spot, but has not been developed because of political resistance. And it’s not impossible to drill in urban settings, ESPECIALLY give the use of horizontals, which mean less total wells in the field, versus verticals. LA had extensive oil drilling in city limits and still has pump jacks in town. Also, much of Dallas Ft Worth was drilled to exploit the Barnett shale.)
It is DEFINITELY something that the left wing of the Democratic party opposes (recall that both Biden and Harris said during primaries that they were anti fracking, and just backtracked when in general elections). In more liberal states like MD or NY, fracking is banned.
The whole point of this discussion of places where shale development is stopped in the US is to say that it can apply overseas also. Much of Europe is politically further left than the US (their center is our left and their right is our center). Huge hurdles in England have prevented shale testing, because of how expensive they made it. (Similarly in IL, it is not technically banned…but they made the restrictions so huge, that nobody drills test wells.)
But of course, this is not a geological physical limit. In the event of extreme prices and/or war, it’s likely that the liberal distaste for oil and gas development would abate.
4. The US is the only country where landowners own their minerals. Almost everywhere else land is owned by the government. This goes back to the time of kings, where the crown owned mineral rights (somewhat analagous to game animals). Oil and gas development has noise and disruption associated with it. If the financial rewards are going to the country overall, local landowners will oppose development because they suffer the annoyance and don’t get rewarded. In contrast, in the US, when farmers can get millions of dollars in upfront leasing bonuses, along with “mailbox money” checks from royalties…it is usually quite easy to get the resource developed.
Countries with large empty areas (e.g. Canada, Russia, SA, etc.) or with harsh governmental controls (Russia, SA, China, etc.) do find it relatively easy to develop such resources though.
Again, in the case of some future peak oil apocalypse, the resistance of local landowners could be overcome. Either by paying them off or by governmental force.
5. A substantial amount of the shale resource is in the middle east or in other OPEC+ countries. Given they have both lots of cheap gushing conventional resource available…and are restraining production of that resource already (to raise price, by cartel action), it’s unlikely they would develop shale for a long time. Sure, maybe some demonstration projects…but not extensive development.
Thx for response. Takes awhile to process all that.
LEEG,
Some of this depends on price, tight oil is produced in Canada, and Argentina, in 2016 China was producing about 16 kb/d of tight oil.
The IEA looked at this in 2019, they estimated maybe 3.5 Mb/d as peak tight oil output from nations other than the US.
https://www.iea.org/commentaries/could-tight-oil-go-global
Argentina was producing about 369 kb/d of tight oil in August 2024 (Financial Times), Canada produces about 335 kb/d (in 2017 according to a Reuters piece). Based on a CAPP piece it looks like this might have increased to about 500 kb/d by 2023.
Perhaps as much as 1 Mb/d for World tight oil outside of the US as of 2024, if prices for oil were very high (say $150/bo in 2024 US$) this might change. China’s output of tight oil was about 80 kb/d in 2023, so the total for Canada, Argentina, and China was 949 kb/d for 2023, perhaps there is 51 kb/d produced by other nations (not including US, Canada, Argentina and China).
thx, so it would take consistently higher prices to justify the investment?
LEEG,
Yes or a significant technological development that lowered cost to produce tight oil.
tight oil definition is more confusing than “shale oil”, if it is defined as rock permeability under 10mD, then it will include “shale oil” for sure.
The shale oil in China is about 80kb/d (4 million tons a year) in 2023, and there are many tight oil fields in China, with the largest such <10mD tight oil field, Changqing, and it produces almost half a million barrels a day. Changqing also produces about 40kb/d of shale oil now in the Chang7 shale formation.
Shengli in Shandong province had the best shale oil wells matching the best in Vaca Muerta and Uinta, already at over 50KBOPD, they are drilling over 500 wells in 5 blocks by 2025, and will be producing over 200kb per day.
Argentina is slowly ramping up the infrastructure to developed Vaca Muerta. This ramp up will continue for a few decades.
https://buenosairesherald.com/economics/first-rigi-project-to-be-a-ypf-oil-pipeline-in-vaca-muerta
“Vaca Muerta, an area the size of Belgium, holds the world’s second largest shale gas reserves and fourth largest for shale oil. Still a relative frontier in the global energy scene, it has huge promise”
yes, Vaca Muerta as huge potential, much larger than EIA or currently estimated,
https://www.linkedin.com/pulse/low-gor-black-shale-oil-continue-rise-sheng-wu-wjh5c/
Sheng Wu,
The estimates I have seen are around 16 Gb, what is your expectation? In your post you say higher than other estimates, but there is a lot of room between 16 Gb and say 1000 Gb, how much larger?
The USGS TRR estimate for the Permian as of 2018 was around 75 Gb, generally this is dubbed the largest tight oil basin in the World. Do you expect Vaca Muerta will be larger? Note that my expectation is 50 to 60 Gb for URR of the Permian Basin tight oil resource.
LEEG
I am not an expert on this. I can only recall comments I have read.
Most countries own the oil in the ground. The US is different in that the land owner owns the oil. With good financing, good oil pricing and aggressive drillers, that oil will come to the market. US had the perfect setup.
The shale has to be in flat layers so horizontal drilling works.
I have read that China has shale and is starting to explore and produce it.
https://www.youtube.com/watch?v=qtsV8QFtHa0
5 minutes
Chinese shale is second largest in the world….But it is WAXY.
It is also in seccessionist China and the government doesn’t want them to acquire an energy source.
waxy or heavier or less gassy is actually not hidering shale oil, government policy or big oil monopoly is,
https://www.linkedin.com/pulse/low-gor-black-shale-oil-continue-rise-sheng-wu-wjh5c/
https://youtu.be/2wwoUOT4rGE
https://www.linkedin.com/pulse/wax-level-indicator-oil-source-type-sheng-wu-fmzoc/
I don’t really know.
It is odd that China wouldn’t try to develop such a massive resource.
the oil and gas market is a state monopoly in China, all major pipelines controlled by CNPC, China Petro.
private capital like what have invested in EV, battery, solar and wind have great barrier to drill their own wells, let alone to access pipelines.
Yes, in the US nd Canada, the shale oil is won from level thick near horizontal strata. In the UK for example, there are substantial reserves of gas and oil that may be exploited by fracking, but the strata are intensely faulted and folded into anticlines and synclindes etc by lateral earth movements. This makes horizontal dilling less feasible over here than in the North American prairie interior between the Rockies and Appalachians.
Under former President Trump, Iranian oil production tumbled from 3.8 million barrels per day in early 2018 to less than 2 mb/d in late 2020; in contrast, production has surged under Biden to 3.2 mb/d.
Similarly, Venezuela oil production dropped from 2 to less than 0.5MBOPD under Trump, and now back to close to 1MBOPD.
Seems that Trump^2 will square the change, that will bring down world supply down by 2~3 MBOPD
That’s a cute idea but how are you going to cut energy prices in half while taking over 2mm bpd off the market?
Trump will bring back Russia oil and let shalers “drill, baby drill”
Yes, and the Mexicans are going to pay for it!
Sheng Wu,
Let’s say Russian sanctions end and Russia increases output, this annoys Saudi Arabia and they increase output in response. Oil prices fall and tight oil producers lose money and we see tight oil output fall in the US as a result and perhaps development of oil sands in Canada also slows as oil prices fall. Currently the World is very well supplied with oil, prices could fall if Trump’s policies result in a World recession which is a very real possibility.
Trump will break it.
The Rig Report for the Week Ending November 15
– US Hz oil rigs fell by 1 to 432. They are down 27 rigs from April 19 and are up 5 relative to their recent lowest count of 427 on July 24th.
– Two rigs were dropped in Texas and 1 was dropped in Oklahoma. In New Mexico and North Dakota, 1 was added in each state.
– In New Mexico the Permian rigs increased by 1 to 93 while the Texas Permian dropped 2 to 190.
– In New Mexico, Eddy added 3 rigs while Lea dropped 2
– In Texas, Midland and Martin were unchanged at 26 and 27 respectively. The rig count for these two counties has not changed for 3 weeks.
– Eagle Ford held steady at 40.
– NG Hz rigs were unchanged at 86.
With WTI closing at $67.02/b today, the incentive to drill must be diminishing.
Frac Spread Report for the Week Ending November 15
The frac spread count decreased by 5 to 222. It is also down 54 from one year ago and down by 50 spreads since March 8. The question here is how low will it go. At the current rate over the past 3 weeks, falling below 200 looks like a good bet. From November 24, 2023 to January 12, 2024, the Frac spread count dropped from 281 to 234, 47 Frac spreads.
In TA terms, perhaps 220 is the new resistance? From vague memory the frac number ~10 years ago was about twice that, but that might be just me misremembering things. Output per frac also seems to have increased somewhat non-linearly but that might not go on forever. As always, time will likely tell, one way or the other.
US tight oil production is declining according to the latest data by EIA. 200 tb/d since peak.
World3,
Better estimate from major tight oil regions, the tight oil spreadsheet for recent months (past 12 months or so) is not very accurate. Data from Short Term Energy Outlook
https://www.eia.gov/outlooks/steo/data/browser/#/?v=9&f=M&s=0&start=201901&end=202512&ctype=linechart&maptype=0&linechart=COPRPUS
For the most recent 13 months (Oct 2023 to October 2024) the annual rate of increase was about 514 kb/d (using OLS to determine trend).
One way to convince yourself of this is to look at Texas and New Mexico C plus C output and compare with the tight oil output for Permia, Eagle Ford, and Austin Chalk (where all of the increase for these two states’ C plus C comes from). You will see that the tight oil estimates look to be incorrect. From Oct 2021 to Oct 2023 the annual increases for the tight oil from the three formations is similar to the two states, for the most recent 12 months (Sept 2023 to August 2024) they diverge significantly (523 kb/d annual increase vs 146 kb/d).
Dennis,
Thank you for the explanation.
World3,
You’re welcome.
Note also that it is possible the tight oil estimate is correct and the state data might be revised, but generally the 914 estimates for TX and New Mexico have been within 1% or better of the final result (Jan 2015 to Jan 2023). So I am fairly confident that relative accuracy will continue.
Also note that if we look at the average annual increase (using OLS) for the 5 shale regions covered by the STEO (as in previous chart) from Dec 2023 to Dec 2025, it is 388 kb/d over that 25 month period. For all US crude the annual rate of increase is somewhat lower over the same period, 303 kb/d.
For anybody in an industry or company with equipment purchases as part of the deal
are there plans to move up purchases (or stockpile) to beat the imposition of tariffs on imported components
such as motors, pumps, controllers, etc?
Minor point, and maybe not that relevant either, just buying small scale testing lab stuff now, but I would say Allen Bradley was already out in Europe for several other reasons, so Mitsubishi or preferably Siemens would be my pick for automation in the EU. (The latter however have had problems at higher RPMs though for some reason…)
If I were a driller anywhere I´d definately go for Atlas Copco, Swedish company with lots of US presence, so no problem there even with tariffs.
So seeing it from the other way around, there might be some issues, but not as intended.
Fracking …. Liberty Energy CEO Chris Wright as Secretary of Energy
Full speed ahead, Frack, Baby, Frack
Freedom Propant, PropX
Chris Wright does not believe we are in the middle of an energy transition.
https://www.linkedin.com/posts/chris-wright-b8370a17b_energysobriety-activity-7021514919787319298-xpzQ
He says that within the first minute of the linked video.
EDIT:
That’s actually a very good video. He has a lot of interesting things to say and much of his point is about labels, not about physics. Really way better than I expected (we have some knuckledraggers on my side).
Looking up the guy’s bio and I see that he was an undergrad (and finished) at MIT. That’s really pretty high IQ. Not genius, but probably top 1% in the population.
He didn’t finish his grad degrees, but if you’ve been in academia, you know that it’s really not a case of smarter people doing MS/Ph.D. At least coming from a place like MIT (or Harvard or CalTech). Often it’s about life choices and dissatisfaction with academia.
I’ve also heard him on one long form podcast (a while ago and about fracking…not the politics of it but technical evolution…and he was very smart).
Really…I think this guy is a way better pick than Tillerson or Harold Hamm or the like. He’s not that far from someone like Scott Tinker, really.
This is what Anonymous said before he edited his own comment:
He completely changed what he wrote originally because he realized it was embarrassingly bad. And then he changed it to something that was equally as bad — Thomas Massie got a Master’s from MIT and he’s a complete lunatic, albeit an end-of-days off-grid energy-self-sufficient lunatic.
The fossil fuel depletion game when it comes to administrations is a game of musical chairs — whenever the music stops, that’s who will be blamed. Apparently Chris Wright’s mandate will be on more fracking, Alaska, national park exploration, offshore, etc which means he will come up dry, with the Trump admin in charge. Too bad.
1. I erased it because it was preachy and I’ve said it all before. Not some neener-neener. If it’s wrong, I still think it. Wanted to move to something new (2). So…
2. I actually watched the video and thank you for linking it. It’s interesting. Heck even if you disagree with it, it’s still well stated.
3. You can have incorrect opinions or even literally be a lunatic (e.g. John Nash) while being intelligent. Too often the feces-throwing monkey crowd conflates every negative appellation. For example I disagree with Pete B, Bill Clinton, and Chuck Schumer on politics. But I recognize they are smart guys.
4. BTW, do you see the inconsistency in your positions? How does “I’m scared they will develop oil and gas” square with “there ain’t much of it” (peak oiler). Cf. the deleted content, you copied.
5. Thanks for letting me know about Thomas Massie. I don’t think I really know who he is (some Congressman?) Or that he went to MIT. Now I gotta look him up and find some podcasts or the like. Hmm…you are sort of having some unintended consequences. Show me some more high IQ conservatives. They are a rare breed. Bill Buckley and Milton Friedman are dead.
The Trump administration plan is to get the actual crude oil production up from ~13 million barrels /day to 19-20 million so they can conclusively claim USA self sufficiency.
They don’t realize how delusional this is.
Paul
I have to wonder whether they will try to change/influence their published production data to suit their needs when production stays flat and then starts its slow decline.
Paul:
19-20 sounds really difficult.
If we call it 19.5 versus 13.5, that is a 6 MM bopd increase. With 4 years to do it.
Could we set a lower bar for success please? Like if it hits 15 MM bopd, Dennis trades in the Tesla for a dually. 😉 [I’m not predicting that…just poking fun.]
Oh…and just say no to conspiracy theories on EIA cooking the numbers. That is such a cope.
13 to 19.5 is a 50% increase. And this will have a huge EROEI hit
The easy answer is to stop the EIA from publishing C plus C data from here on in and just report All liquids. The papers will start reporting US oil production as 19.5 million barrels per day with no explanation and after 6 months, there you have it, another Trump promise fulfilled.
It just might put me out of a job.
Ovi:
I remember when production went from 9 to almost 13, during 2017-2019. The price bulls and peak oilers and shale deniers were also blaming/suspecting NGLs back then. Zero evidence for it. They just didn’t like the numbers. Total cope. How about at least waiting until it happens (if it even happens) before you run for the NGL excuse?
Oh…and EIA knows perfectly well the difference between NGLs and C&C. And if you look at how the 914 report is compiled (then again, you seem pretty unaware of this, Dennis has had to school you often), you’d be aware that the differentiation is made at the 3 phase separator on pad. So, C&C is field production.
And the gas is all wet gas, coming out of the 3 phase separator. So the NGLs are inside the wet gas. And there is no reasonable way for EIA to confuse the two, since the NGLs come out of large complex field plants (that are well downstream of field producers, and run by midstream companies!). Then again…you’ve never really looked at the nuts and bolts of how the 914 is compiled or who the major NGL plant operators are (i.e. different companies than the producers!)
Hey Nony,
Do you remember claiming that North Dakota would easily get to 1300 kb/d by the end of 2024? Doesn’t look very likely. August 2024 output of C plus C was 1169 kb/d for North Dakota.
US C plus C from October 2023 IEO, peak around 13.3 Mb/d. Back in 2019 the AEO was predicting about 14.5 Mb/d in 2031 (this was the last report while Trump was still in office and before Covid hit (report published Jan 24, 2019, most of the work on the report probably occurred in 2018). The AEO 2020 report has a similar peak of about 14.5 Mb/d in 2033. In 2021 the AEO had the peak at 13.9 in 2034, and in 2022 the AEO had the peak in 2028 at 13.4 Mb/d.
So for the highest estimate by the EIA was the 14.5 Mb/d estimate for US C plus C in 2031 for the AEO 2019.
The 14.5 Mb/d estimate does not seem unreasonable, even 15 Mb/d might be possible by 2030. I think we could see 250 kb/d annual increases in US C plus C from 2025 to 2030 (on average) which gets us pretty close to 15 Mb/d (recent 12 month average is about 13.2 Mb/d, add 1.5 Mb/d to this (0.25 times 6) and we are at 14.7 Mb/d, if the annual increase averaged 300 kb/d instead of 250 kb/d we would be at 15 Mb/d. Note that I believe 15 mb/d is a stretch as I expect the peak may be about 2028, but 14.5 Mb/d may be reasonable by 2028.
Nony
The EiA would be told to stop collecting or reporting 914 data.
I can’t believe you are sooo naive.
Dennis
Thanks for reminding Nony that he challenged me for saying that ND would not get to 1,300 kb/d and he said it would.
https://www.afr.com/world/north-america/trump-s-new-energy-secretary-linked-to-beetaloo-basin-gas-project-20241117-p5kr7s
Behind a paywall, but enough in the available blurb.
Energy secretary invested in Australian Beetaloo Basin.
What’s better is that he is also into sodium-cooled breeder reactors – Oklo.
Oklo? You want to restart the 2 billions years old Oklo reactors?
I’m mystified. Is the Beetaloo good or bad or irrelevant?
After all, he ran production and service companies in the Bakken and I think other basins…and his company did some innovations in the field in general that he is known for. So…who cares if he dabbled in some furrin basin or not?
Like I’m not even disagreeing. But what is the point????
Not a judgement. An observation.
Scott Sheffield’s (Pioneer) son is investing in the Beetaloo as well.
Seems like US Shale players are a good fit down under.
Andre , like father like son . Stupid is what stupid does — Forrest Gump 😁
Not sure I agree Sheffield is stupid.
He took Exxon Mobile to the cleaners, IMO.
Beetaloo looks to have massive natural gas potential.
the latest news from Vaca Muerta is that further into the east “immature” part, success in shale development in Vaca Muerta. Guess the GOR is around 100scf/bbl?
https://vacamuertanews.com/actualidad/rio-negro-inauguro-la-produccion-de-pozos-no-convencionales-en-vaca-muerta.htm
https://ir.geo-park.com/news/news-details/2024/GeoPark-Announces-Exploration-Success-at-Confluencia-Norte/default.aspx
https://caribbeannewsglobal.com/wp-content/uploads/2024/05/Maps.jpg
Ovi,
Kudos to you on ND. I’ve seen so many times when it had a big seasonal rebound. But it has not. Go you. 🙂
(Edit) I thought I had already given you some credit a while ago…but I searched and just can’t find it, so you are right to call me on it.
I did make one short post to the effect that ND was not “making enough hay while the sun shines” (i.e. not growing production in summer). But that’s not what I thought I had posted (which was more directly giving you credit and referring to my own remark).
Thought I had posted a more definitive post to the effect that things were looking good for you, unlikely ND gets to 1300. But evidently I just imagined that…since I can’t find it.
So anyways, for the record, while the year is not over yet, I think it’s very unlikely we get to 1.3 by year end. And when that unfolds, you can run a victory lap around me. 😉
it is controlled largely by oil price?
the big ND increase in 2023 is reflecting the price from 2022 to first quarter of 2023, similarly for 2024 production?
Sheng Wu,
Yes oil price has an effect, along with the price of natural gas and NGL, this is usually reflected in the rig counts. Chart below has Bakken Horizontal OIl rigs shifted forward by 8 months to reflect average delay between start of drilling and start of production.
Nony
“(Edit) I thought I had already given you some credit a while ago…but I searched and just can’t find it, so you are right to call me on it.”
Yes you did. I do recall that credit.
I am not on this site to be right or wrong. I look at the charts and try to make a call. Right or wrong is not my objective. Generating alternative opinions and information is the goal.
My main focus these days is the Permian and I think we need to focus there. It would be nice to call a peak in the Permian with some solid evidence to back it up. I’ve already made some bad calls on some of the counties. I may change my call again in the next post. Great thing about this site, somebody may disagree politely.
https://oilprice.com/Energy/Crude-Oil/The-Shale-Industrys-Black-Cow-Phase.html
this article seems to say “peak permian” is still $20 away?
Looking at the Devon BOE profit table, it seems Devon did pay severance tax to NM but not 20~25% mineral loyalty
You have to be careful evaluating oil company financial statements. I think “realized price” is after royalties were paid. Possibly some tax also came off the top line (in some states part of the tax is pre-royalty and part is post-royalty cut).
I’m not an expert to interpret them. Just telling you to watch out. For example the realized price is much much lower than benchmark traded prices. So, it implies something already deducted.
Devon has GOR in Delaware at 1:3 BOE, and oil at $72/barrel and gas (with NGL) at $30/BOE.
that is $72/4+$30*3/4=$18+$21.5=$39.5 — roughly close?
Makes sense, I didn’t catch the BOE thing. Blech.
I don’t know where the royalties are. If they come out of that “field cash margin” (probably) or are in one of the subheadings. Again, I’m not an expert on these types of statements.
P.s. That table is kind of strange. I’m used to more looking at the total P&L. (But then I think the revenue is recognized net of royalties. What a mess.)
Top 5 publicly traded companies have <10 years production available:
In 2018 the average RLI was 12 years
Kengeo,
This ignores probable and possible reserves and contingent resources. Typically these companies strive to replace the produced reserves each year, the replacement reserves come from probable and possible reserves and from contingent resources and discoveries.
ExxonMobil’s reserves fell from 22.4 billion barrels in 2018 to 9.8 billion barrels in 2023 (~56% decline).
BP’s reserves dropped from 19.3 billion barrels in 2018 to 7.2 billion barrels in 2023 (~63% decline).
Seems like something else is going on?
For those two, average RLI went from 15 years to 6 years over the course of 5 years time…
Kengeo,
The Publicly traded Western oil companies have become less important than state owned producers.
The Rystad 2PCX estimate is probably the best guess out there, which suggests a World URR of roughly 2950 Gb.
Dennis – I think 2950 is much too high, a more conservative estimate would be P93, resulting in a URR of 2,350 Gb.
This would imply that the peak/midpoint was 2015.
In reality, conventional oil peaked in 2005–2008 and aligns well with P93, which provides a relatively conservative yet optimistic estimate for remaining recoverable resources. P93 accounts for the reality of declining conventional oil output, reliance on unconventional sources, and a global energy transition.
Also, this URR could happen as a result of the energy transition, where there might be stranded reserves due to economic factors.
Under this scenario we might expect to see 1P reserves shrink by 2-3% annually.
For your scenario, we would expect production to cancel out any 1P growth and remain essentially flat thru 2050…then decline by several percent each year…regardless 1P decline is the indicator to watch.
The average percent decline will be informative
Kengeo,
Jean Laherrere tends to be very conservative in his estimates and in 2018 estimated World C plus C URR at about 2700 Gb, in more recent papers his estimates were higher, I think 3500 Gb for World C plus C URR, see 2022 paper linked below.
https://www.sciencedirect.com/science/article/pii/S2666049022000524
Not clear what you mean by P93. Conventional as I define it (excludes extra heavy oil and LTO) peaked in 2016, my definition is the same that is used by Jean Laherrere. Cumulative output was 1273 Gb at the end of 2016 which implies a URR of 2546 Gb if we assume peak occurs at 50% of URR, often the peak occurs before 50% of URR.
Dennis – Maybe look at his more recent work?
Kengeo,
How about a link. An April 2024 publication Laherrere estimated 3000 Gb for World C plus C URR using Hubbert Linearization.
https://aspofrance.org/2024/04/30/graphs-jhl-2024-jean-laherrere-28-avril-2024/
I don’t think using HL for nations that are restricting output as OPEC has been doing will give accurate results.
Also the way I read that chart is that some HL results end up being about 2500 for conventional. Some HL choices are better than others, the low estimates are usually wrong.
Comment by Rolland in previous post:
https://aspofrance.org/2024/11/07/middle-east-crude-oil-production-and-forecast-jean-laherrere-patrick-brocorens-15-octobre-2024/
My key takeaway is that at the time (2018), Laherrere saw an imminent peak in 2-3 years for the Middle East. Now he’s able to confirm that the peak was instead 2-3 years past. So now he places a peak for Middle East of 2015-2016…with Iraq and UAE shifting peak from 2030 to 2016. He revised URR downward for Saudi Arabia (-90 Gb), Iraq (-50 Gb), Kuwait (-20 Gb), Qatar (-12 Gb). Which is a total of almost 30%…
Kengeo,
The recent work misses the fact that it is too early to estimate URR for most middle east nations based on HL. That recent piece is an example of Laherrere being too conservative. Here is the Hubbert Linearization for the World, note that if anything it is probably too low an estimate, the result is a URR of 2900 Gb.
Dennis –
You can’t continue ignoring the Actual data.
The 2018 peak (less USA) was ~90 mb/d worldwide. A 2012 study estimated an all liquids peak of 95 mb/d associated with URR of ~2.5-2.6 Tb. We can scale this to 2.37 Tb, we can add a minor amount for US shale and call it 2.450 Tb, this is an amount that is supported by an actual peak and suggests the global midpoint for all liquids was 8-9 years ago, which would exactly match what Laherrere has recently presented. This estimate includes a very significant amount of unproved reserves (~0.5 Tb), representing a doubling of current proven reserves over the next 10-20 years. Your estimate instead has unproved reserves of >1 Tb.
I think more likely the actual URR will have a smaller amount due to over extraction techniques used in Saudi Arabia and other places. A low URR <2 Tb is entirely possible and is also supported by data (~1.9 Tb including produced plus 1P).
WRT Laherrere: Curious how you are able to champion the 2018 work but not the 2024 work?
Kengeo,
Took a quick look at Middle east and I get a URR of at least 860 Gb and perhaps as much as 950 Gb, if we consider an HL on 2004 to 2018 using OPEC ASB data for middle east. The lower number considers 2008-2023 middle east data for the HL, but most of the years from 2019 to 2023 (2022 was the only exception) Middle east OPEC producers were restricting output due to World oversupply and falling oil prices. Output for most of the recent 5 years was lower due to OPEC quotas making the HL unreliable.
This latest work is somewhat like Laherrere’s estimate for the Bakken back in 2015
see https://peakoilbarrel.com/jean-laherreres-bakken-update/
where the estimate was about 3 Gb for Bakken URR. As of April 2024 North Dakota Bakken cumulative tight oil output was about 5 Gb, my estimate for the URR is about 9 Gb currently, back in 2015 my guess was at least 7 Gb and perhaps as much as 11 Gb (in a very high oil price scenario). See comments starting at link below
https://peakoilbarrel.com/jean-laherreres-bakken-update/#comment-534115
Kengeo,
Some of Laherrere’s work is pretty good (the 2018 paper and the 2022 paper are examples), in other work he makes questionable assumptions in my view. The actual data shows that at the most recent World Peak in C plus C output in 2018, cumulative World C plus C output was about 1358 Gb. If we assume peak occurs at 50% of URR (often it occurs at a lower percentage of URR) this would lead to a URR of 1358 times 2 or 2716 Gb. My guess is somewhat higher as I am not convinced that World output will follow a Hubbert Curve, it certainly has not from 1870 to 2018 and it is doubtful it will do so in the future.
Note that proved plus probable(2P) reserves is the proper number to use, Rystad has those at about 740 Gb,with cumulative production at about 1500 Gb so around 2250 Gb, if we ignore possible reserves, contingent resources and new discoveries (including reserve growth). Anything less than 2250 Gb is highly unlikely (maybe a 1% probability, probably less). Reserve estimates will continue to increase as they have over the past 150 years, perhaps after 15 years or so this will no longer continue due to falling oil prices that are not anticipated.
Go look at what XOM had for SEC reserves in 2004. I sure bet it wasn’t 20 years of production. But, here they still are. Hmm.
Their RLI peaked in 2009, which makes sense…
Oil jumps 3% after Norway oilfield outage, US change on Russia-Ukraine policy
Oil jumped more than 3% Monday after Norway’s largest oilfield shut down because of a power problem as well as reports that the US would reverse its stance by letting Ukraine fire US-made weapons deep into Russia territory.
Brent crude futures rose 3.3% to $73.45 per barrel, while WTI futures swelled by 3% to $69.
Of the two major issues Monday, the Norway outage had a greater impact on the commodity climb, said Josie Mills, an analyst for Enverus Intelligence Research.
“That field is roughly 45% of Norway’s oil production, so an outage there is pretty huge,” Mills told Upstream.
However, the “continuous volatility from geopolitics” still contributed to Monday’s fluctuation, Mills said, adding that long-term supply or demand interruptions would still weigh heavier on commodity prices.
“As we’ve seen throughout this entire year, it may cause oil prices to be more volatile, but it won’t actually cause long-term surges unless there’s actual outages seen in oil production,” she said.
IEA: Non-OPEC production growth bolstered by new offshore capacity
Nov. 18, 2024
Offshore conventional projects are projected to contribute nearly 700,000 b/d to the anticipated 1.5 million b/d rise in non-OPEC production in 2025, according to IEA forecasts.
https://www.ogj.com/general-interest/economics-markets/article/55243694/iea-non-opec-production-growth-bolstered-by-new-offshore-capacity?o_eid=1079H7861712I7P&oly_enc_id=1079H7861712I7P&rdx.ident%5Bpull%5D=omeda|1079H7861712I7P&utm_campaign=CPS241118015&utm_medium=email&utm_source=OGJ Daily
EIA: annual US shale gas production may decline for the first time since 2000
https://www.ogj.com/general-interest/economics-markets/article/55238135/eia-annual-us-shale-gas-production-may-decline-for-the-first-time-since-2000
ND Director’s Cut is out:
https://www.dmr.nd.gov/dmr/oilgas/directorscut (click first link on site)
SEP production up ~20,000, to ~1,200,000 bopd.
Video press conference not uploaded yet, but should be soon. I listened to the MS Teams call, and there was nothing notable.
North Dakota Sept Update
September production was up by 20 kb/d. 118 new wells came on line for a record 18,791. The monthly barrels per well has been dropping since late 2023.
Alexander Khurshudov wrote a post on the aftershock website about the prospects of the Bazhenov Formation, which took place during an online conference:
Online conference “The difficult path of Bazhen: reality and expectations”
Avatar of user Alexander Khurshudov
At the request of comrades, I am giving material on the conference at the Samotlor-Express agency.
Under this title, the Oil and Gas Information Agency held a discussion of the problems of developing hard-to-recover oil reserves of the Bazhenov formation in Western Siberia. Below I will try to outline my impressions of the problem, which were not fully voiced at this conference.
The speaker is the honored geologist of Yugra, Ph.D. in Geology and Mineralogy Alexander Shpilman believes that the Bazhenov deposits contain approximately 5 billion tons of recoverable oil reserves. He is one of the authors of the methodology for calculating these reserves approved by the State Reserves Committee. Of course, such a significant figure sets one up for optimism, which is why several conference participants actively advocated for continuing the research.
I have great doubts about the oil recovery factor (ORF) of 5% used in the calculations. It was adopted (conditionally) by analogy with the American Bakken formation, but even there it was achieved only in certain, richest areas. In addition, the geological structure of the Bakken is much better. There, a thick homogeneous layer is located between layers of shale, and this is the most favorable condition for effective hydraulic fracturing. Bazhen is a layered cake, including shale and clay, in which the fractures of hydraulic fracturing are filled with rock and close. Therefore, after multi-stage hydraulic fracturing, wells annually reduce their flow rate by 40%. In the USA, the analogue of Bazhen is the Monterrey formation in California; there, the ORF over 20 years was a fraction of a percent.
In the subsequent discussion, the participants spoke about two main problems. The first is that geophysical methods do not allow for reliable identification of the richest sections of the formation. The second is that the development of the Bazhenov formations in the current conditions is both ineffective and deeply unprofitable. There are too few recoverable reserves per unit area.
It is interesting that the geologists were the most worried in the debate. I understand them, they are a little discouraged by the fact that the huge geological reserves of Bazhenov oil cannot be taken today. The elbow is close, but you can’t bite it. The Americans (10 years ago) estimated these reserves at 170 billion tons and with a recovery rate of 6% decided that 10 billion could be extracted. Ours cut the sturgeon in half, which is also a lot. But in reality, less than 20 million tons have been extracted over 25 years. This is 0.012-0.02% of the total geological reserves.
But oil field development specialists are reluctant to speak out on the topic of Bazhenov. They understand that it will take about 7 thousand years to extract 5 billion tons of oil at the current rate. It would be necessary to admit the futility of further attempts, but how can this be done if ministers, academics, and governors previously considered Bazhenov to be the main and exciting prospect of our oil industry. What were they all wrong about?
And so the only specialist developer at the conference, Deputy General Director of ZapSibNIIGG, PhD Alexander Timchuk, diplomatically noted in conclusion: yes, Bazhenov is our future, but not tomorrow. I will add: and not the day after tomorrow, at best this is a prospect on the horizon of 30-50 years. For its widespread use, current, even super-duper-hydraulic fracturing tools are not suitable, fundamentally new technical solutions will be required. We do not know them yet. But I believe that someday they will appear.
The full recording of the conference is available on the ANGI website:https://rutube.ru/video/90830f38122a063975bc3b7c69be8de3/
link:https://aftershock.news/?q=node/1445421
Thank you interesting information.
the Bakken “shale oil ” is just one special tight oil, and not drilling in the shale rock as other major shale/tight oil basins, Permian and EF.
In fact, Bakken is drilling in the middle of Bakken with Feldspar and dolomite rock free of shale and high TOC which are present in the upper and lower Bakken (TOC>15~25%), and use water based mud, instead of more expensive oil based mud which is necessary in Permian and EF.
The fast decline is more a result of PVT induced bubble point effect, and Vaca Muerta and China’s Hypersaline shale all have obviously slower decline.
Weekly Petroleum Report
Normally our participants, Dennis and I don’t comment on the weekly petroleum report because the production figures are preliminary estimates.
From October 4 to November 1, weekly production was estimated to be 13,500 kb/d and consistent with STEO. However for the week of November 8, production was estimated to be 13,400 kb/d and this morning the estimate for the week of November 15 dropped to 13,201 kb/d, down by 299 kb/d over two weeks and close to 300 kb/d lower than the STEO November estimate. In addition, for the lower 48, production dropped by 240 kb/d to 12,760 kb/d. See attached table.
Note that production is being reported down to the closest 1 kb/d. Is this new weekly report a better reflection of the accuracy of their estimates along with better data from drillers? Something new to keep a tab on.
Ovi:
There is no information from drillers informing the production estimate for the production estimate. 95% of it is from the STEO model (essentially past 914 production and rig count to extrapolate changes since then). The other 5% is from AK pipeline flows. So only 5% of the info is not modeled.
The production estimate has not gotten more accurate. They are using the same methodology as before. Just going back to showing your their actual estimate vice rounding. (That’s how it always was a few years ago…then they started rounding to stop people who overinterpret the production number. Don’t fall into that trap, please.)
FWIW, the weekly report is most useful for inventory stocks (as a real survey is done), next most useful for export/import (it’s sort of surveyed, but some lags in reporting), and least helpful for production reporting.
Not sure why they dropped it now. If I had to guess, it’s from having a new month’s STEO to base things off of. Usually see a “rebaselining” in mid month.
New posts are up
https://peakoilbarrel.com/short-term-energy-outlook-november-2024/
and
https://peakoilbarrel.com/open-thread-non-petroleum-november-20-2024/