By Ovi
All of the Crude plus Condensate (C + C) production data, oil, for the US state charts comes from the EIAʼs Petroleum Supply monthly PSM which provides updated information up to August 2024.
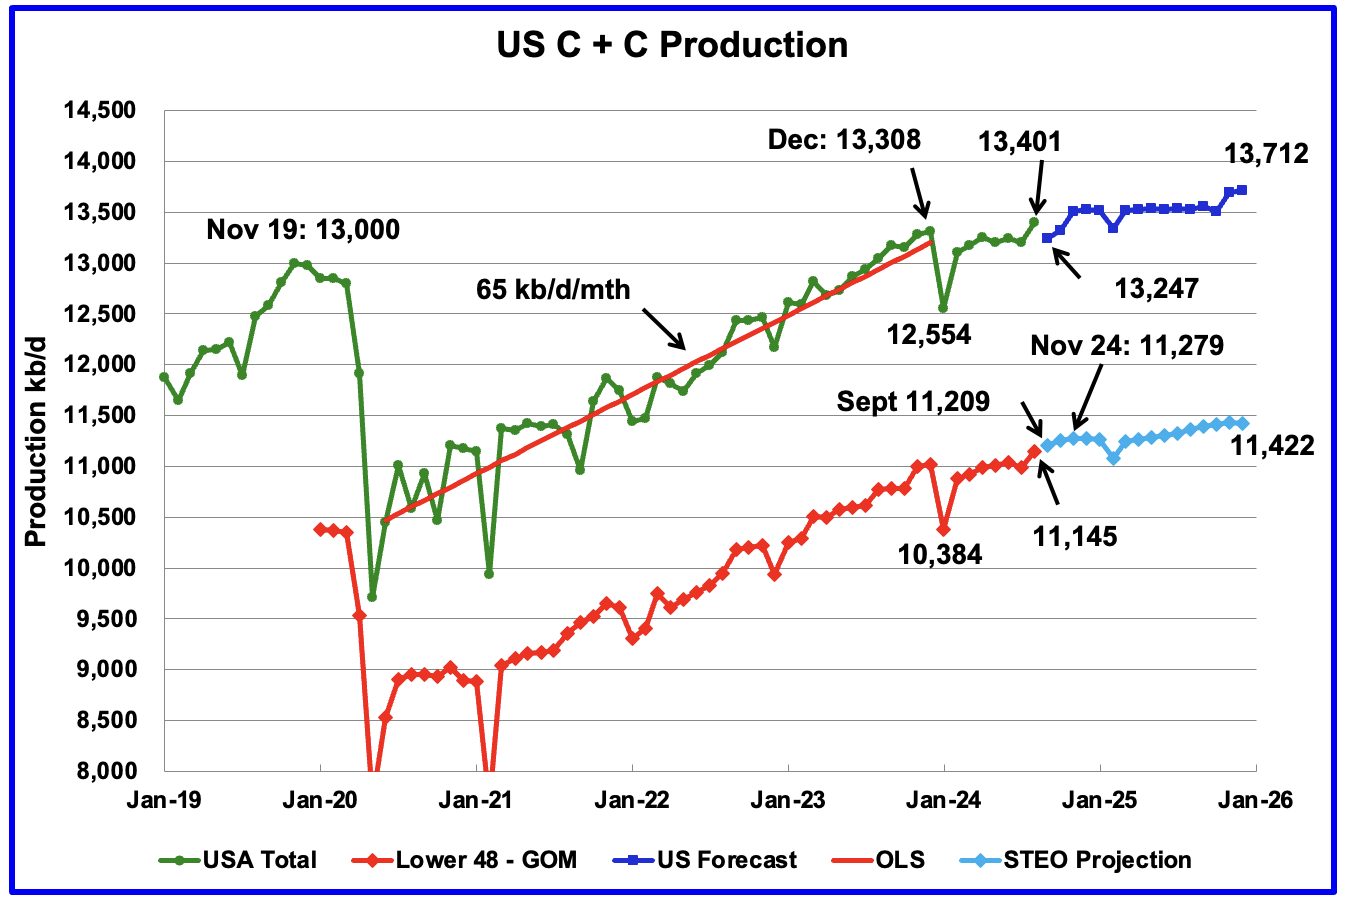
U.S. August oil production increased by 195 kb/d to 13,401 kb/d to another record high. The previous record was 13,308 kb/d in December 2023. The largest increases came from Texas, 99 kb/d and New Mexico, 57 kb/d.
US oil production has been essentially flat since September 2023 when it was 13,177 kb/d. August is at a new high and very close to 13,500 kb/d, where it is expected to remain for most of next year.
The dark blue graph, taken from the October 2024 STEO, is the forecast for U.S. oil production from September 2024 to December 2025. Output for December 2025 is expected to reach 13,712 kb/d. From August 2024 to December 2025 production is expected to grow by 311 kb/d or at an average rate of 19.4 kb/d/mth.
The red OLS line from June 2020 to December 2023 indicates a monthly production growth rate of 65 kb/d/mth or 780 kb/d/yr. Production going forward is projected to increase at about 30% of that rate.
The light blue graph is the STEO’s projection for output to December 2025 for the Onshore L48. August Onshore L48 production is up by 53 kb/d to 11,145 kb/d. From August 2024 to December 2025, production is expected to increase by 277 kb/d to 11,442 kb/d, revised down from 11,605 kb/d in the previous post.
US Oil Production Ranked by State

Listed above are the 11 US states with the largest oil production along with the Gulf of Mexico. Ohio has been added to this table since its production approached 100 kb/d in January and exceeded Louisiana’s production. These 11 states accounted for 84.1% of all U.S. oil production out of a total production of 13,401 kb/d in August 2024.
On a MoM basis, August US oil production rose by 195 kb/d. Note that the top 3 states accounted for 167 kb/d of the 195 kb/d increase. On a YoY basis, US production increased by 354 kb/d. GOM production increased by 3 kb/d MoM while dropping by 67 kb/d YoY.
State Oil Production Charts

Texas production increased by 99 kb/d in August to 5,818 kb/d. a new record high. YoY production is up by 215 kb/d.
The blue graph shows the average number of weekly rigs reported for each month, shifted forward by 10 months. So the 276 rigs operating in July 2023 have been shifted forward to May 2024. From February 2024 to July 2024, the rig count dropped from 312 in time shifted February 2024 to 256 in July 2024. That drop of 56 rigs had no impact on production until July 2024.
As of August, production rose even though the rig count continues to fall. This is a clear indication that some significant improvements have been made with drilling technology and possibly fracturing.
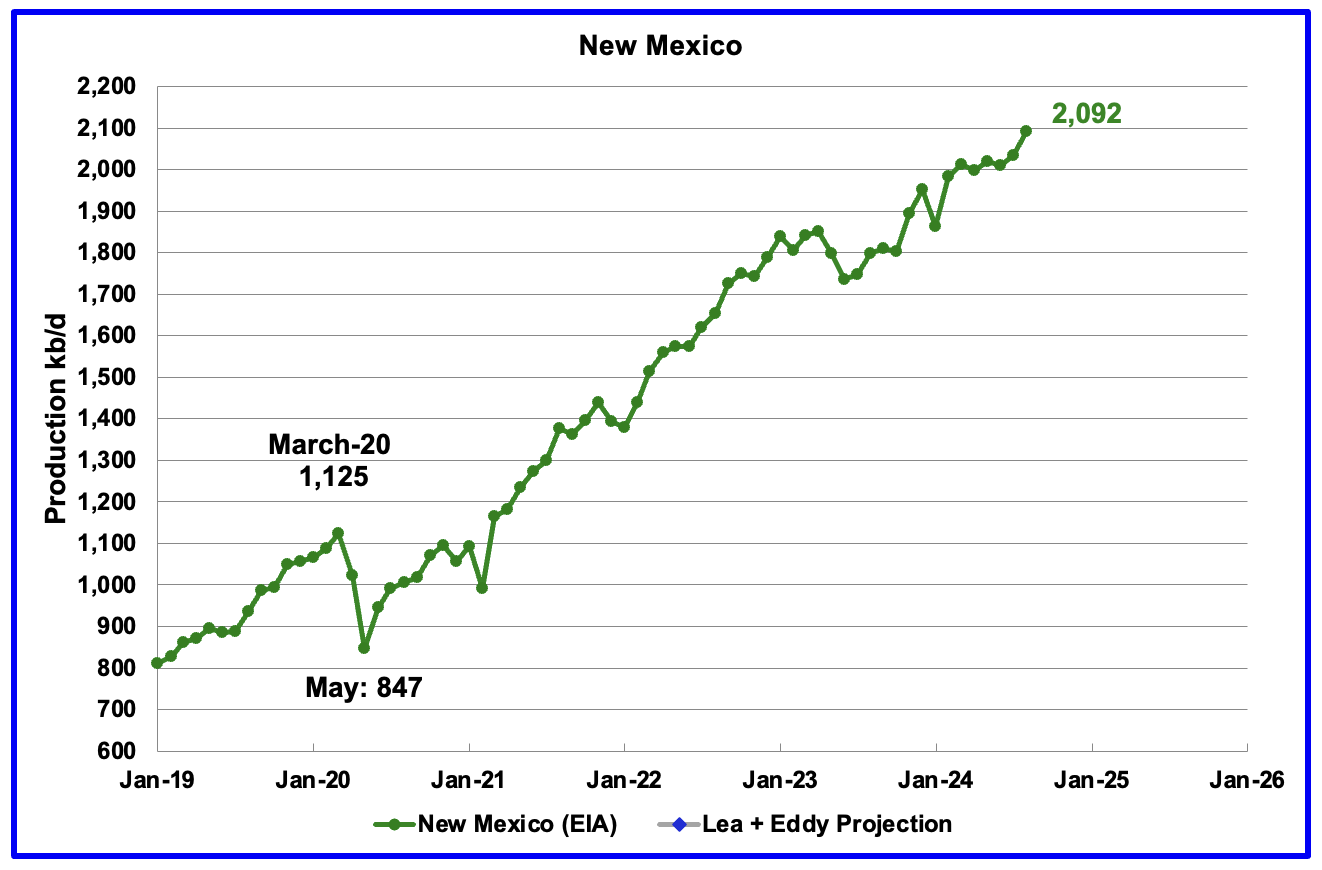
According to the EIA, New Mexico’s August production rose by 57 kb/d to 2,092 kb/d, a new record high.

August’s output increased by 11 kb/d to 1,169 kb/d. YoY production was down by 38 kb/d. Production is down by 118 kb/d from the post pandemic peak of 1,287 kb/d.
According to this article, North Dakota’s oil production rose in August due to a new high in active wells and increasing completions.
Department of Mineral Resources Assistant Director Mark Bohrer said oil production was up to about 1.18 million barrels a day, which is less than a 1% increase. Gas production, meanwhile, went up about 2% compared to July. It marks the end of a three-month slide for the industry.
“We’ve been expecting this production uptick for quite some time now, based on the completions we saw in August, and it seems to have come true,” said Bohrer.
The state recorded a new high for active wells with 19,117.
Another article provides a lot of interesting information.
“Rig count has been steady. There’s 40 rigs running today (Thursday),” he said.“Even with all the mergers and acquisition going on, our rig count has remained fairly steady.”
He said about 376 wells were waiting on completions and 1,903 wells were inactive. This was an uptick compared to July when there were 1,771 inactive wells.
He said the wide fluctuations in inactive wells from month to month are not unusual.
“Wells get shut in for different reasons. One of the big reasons they get shut in is for fracking of offset wells,”he said.
Completions in September were at 58.
“That was a disappointing number,” Bohrer said. He said they were hoping it wouldn’t be that low. “It could be a delay in reporting – a lag when reports come in. We’re hoping that’s what it is,” he said. He said there also could be more 3-mile wells being completed now. Those take longer to complete so the number of wells a crew can complete per month is not as large as if they are all 2-mile wells. We’re going to start crunching the numbers on that, analyzing that data, to see what the relationship there is,” he said.

Alaskaʼs August output dropped by 11 kb/d to 396 kb/d while YoY production was unchanged at 396 kb/d. The small drop in production is an indication that summer maintenance is winding down and production should begin to recover in September. Weekly Alaska September production reports are close to 410 kb/d.
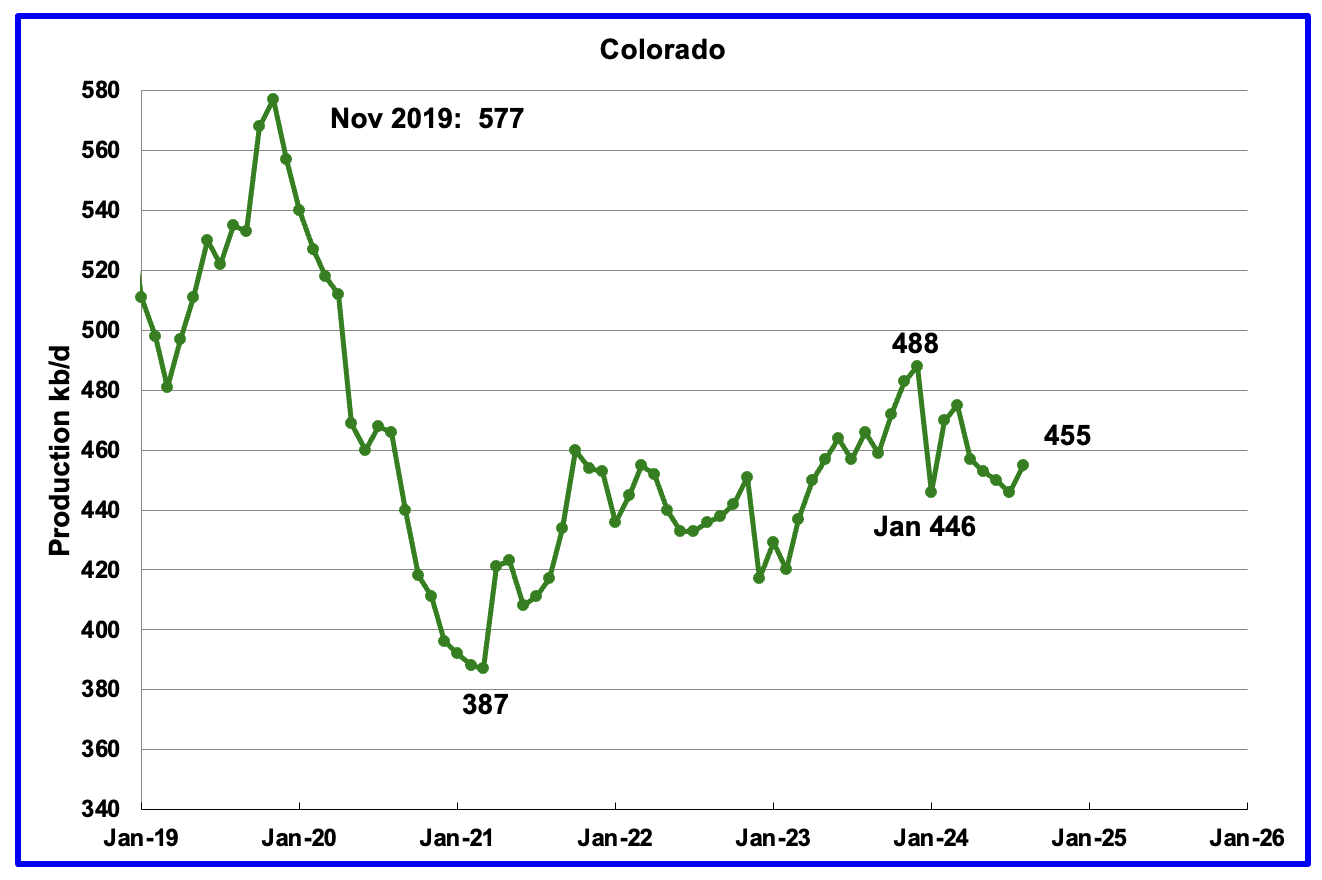
Coloradoʼs August oil production increased by 9 kb/d to 455 kb/d. Colorado has moved ahead of Alaska to become the 4th largest US oil producing state. Colorado began the year with 12 rigs but has now dropped to 10 during June, July and August and had 8 in operation October.
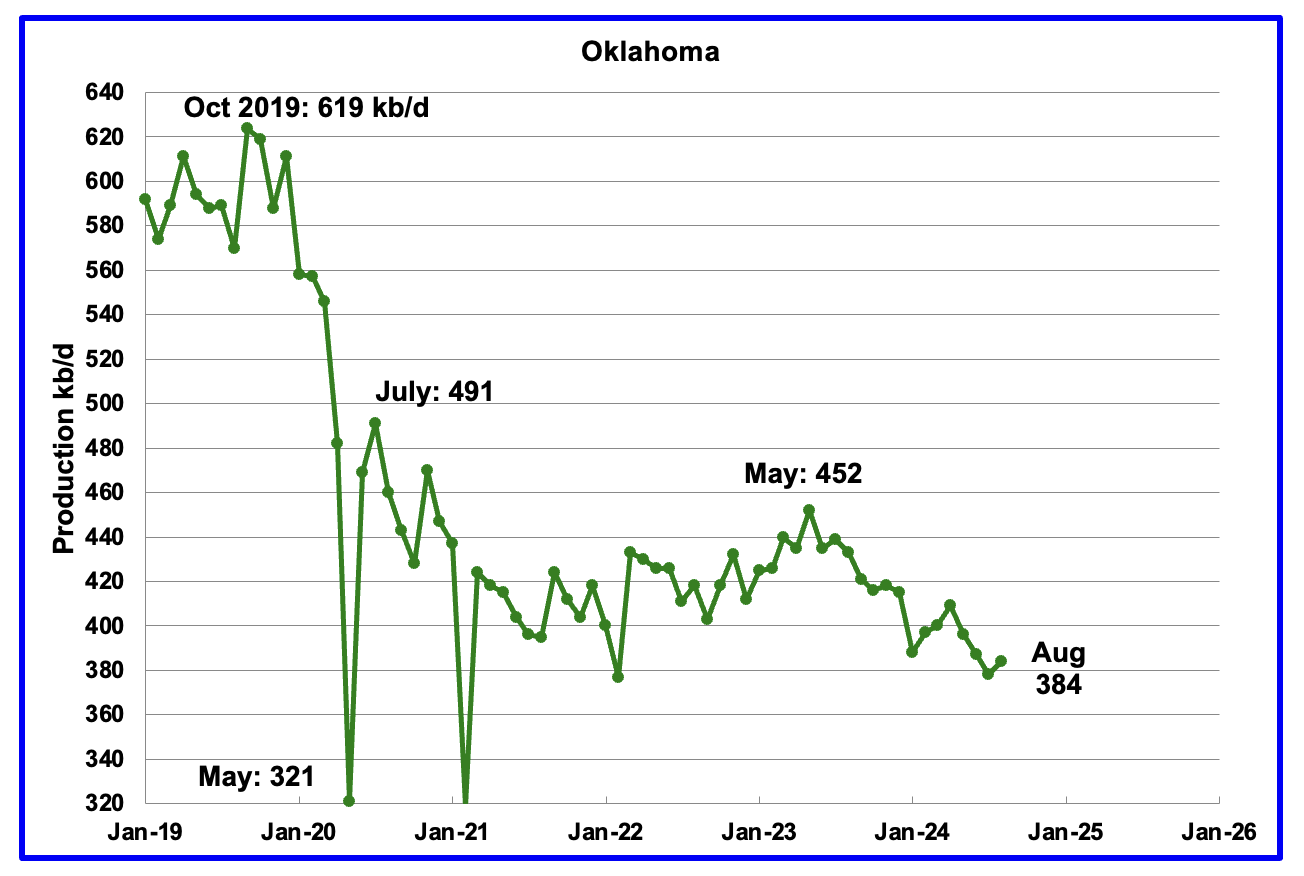
Oklahoma’s output in August rose by 6 kb/d to 384 kb/d. Production remains below the post pandemic July 2020 high of 491 kb/d and is down by 68 kb/d since May 2023. Output entered a slow declining phase in June 2023.
Oklahoma’s rig count dropped from 40 in May to 30 in July. By the end of September 2024 there was an uptick to 41 operational rigs. Will the increase in the rig count reverse the current dropping production trend?

California’s declining production trend continues. However Californiaʼs August production reversed the trend by increasing by 1 kb/d to 283 kb/d, which was the same as reported last month.
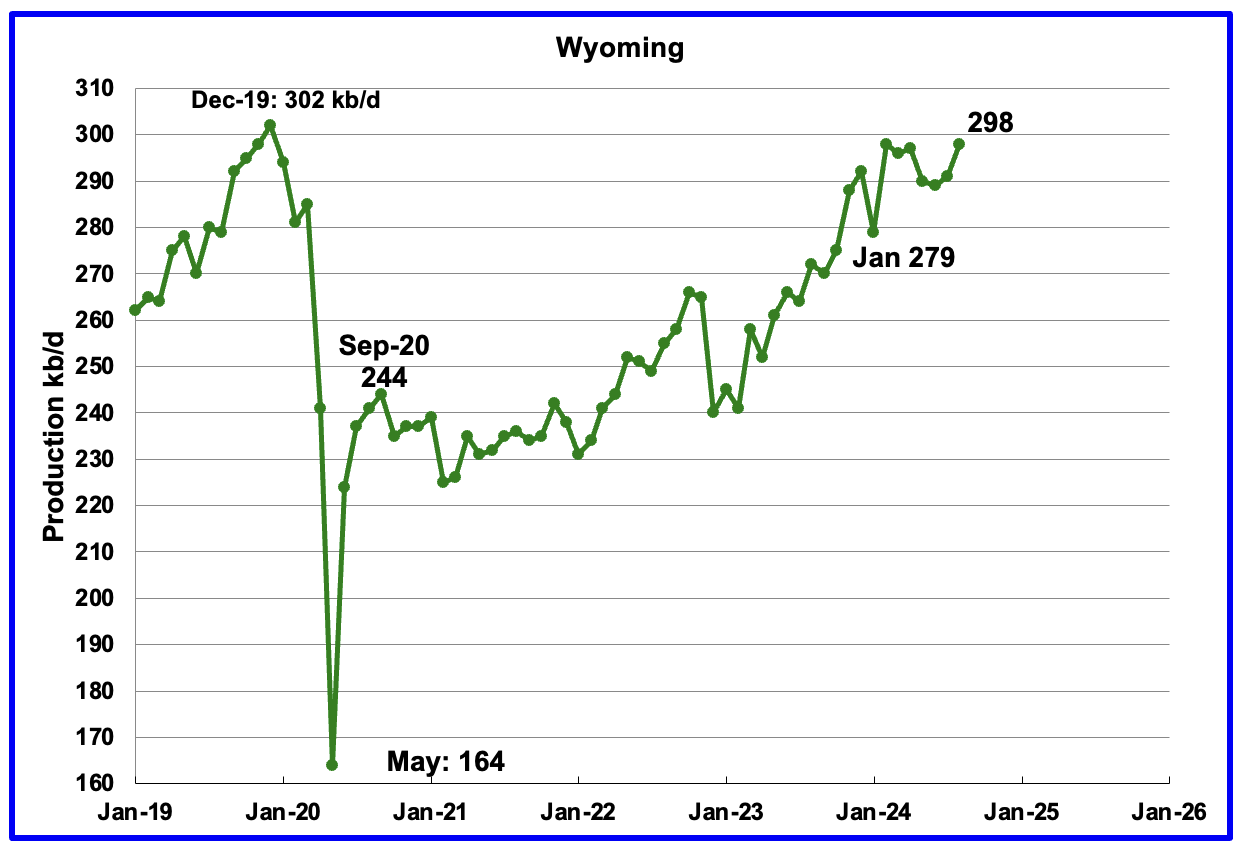
Wyoming’s oil production has been rebounding since March 2023. However the rebound was impacted by the January 2024 storm. August’s production rose 7 kb/d to 298 kb/d. Note that production has almost recovered to the pre-Covid level of 302 kb/d.
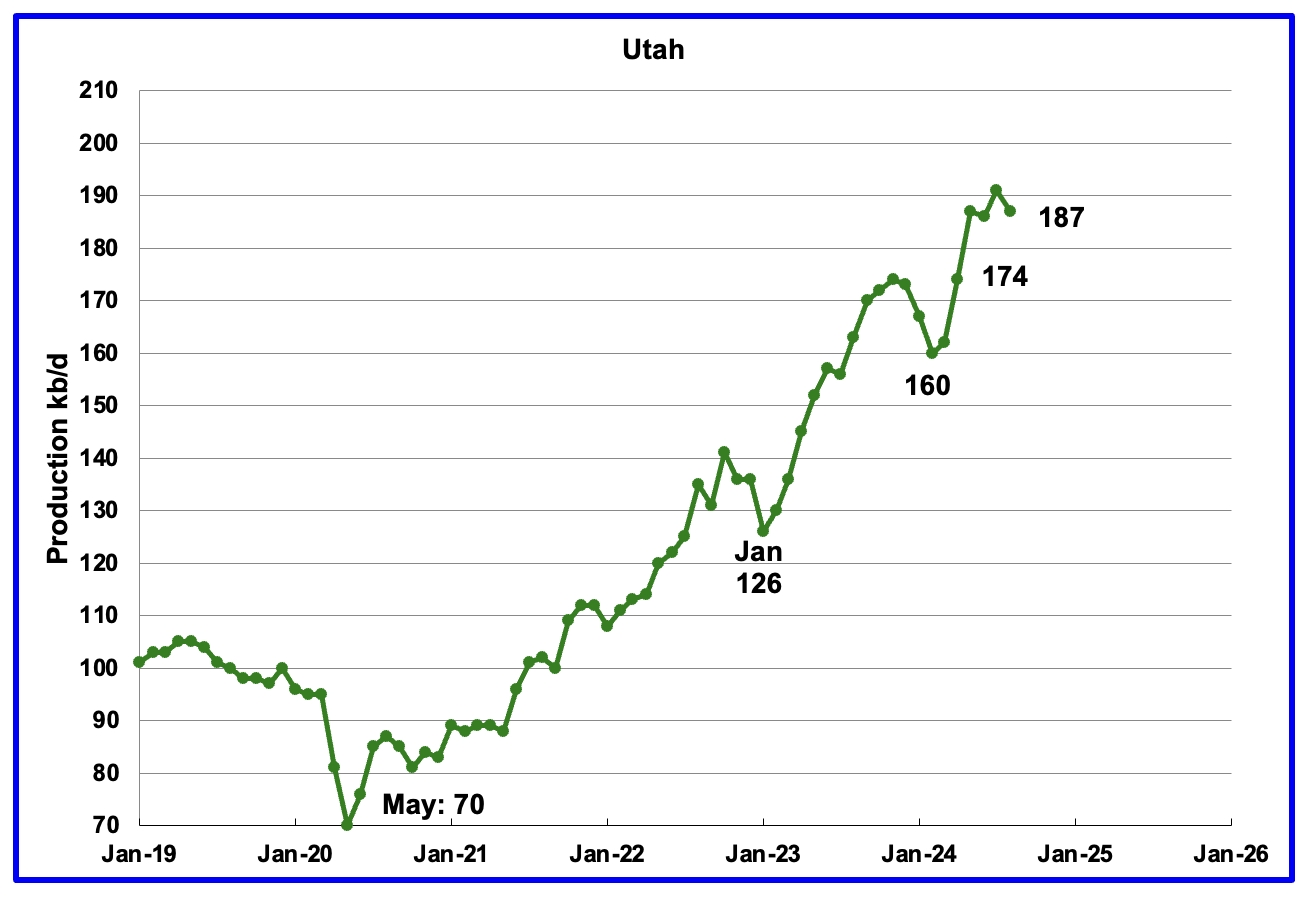
August’s production decreased by 4 kb/d to 187 kb/d. Utah had 9 oil rigs in operation from January to September 2024 but dropped to 8 in October.
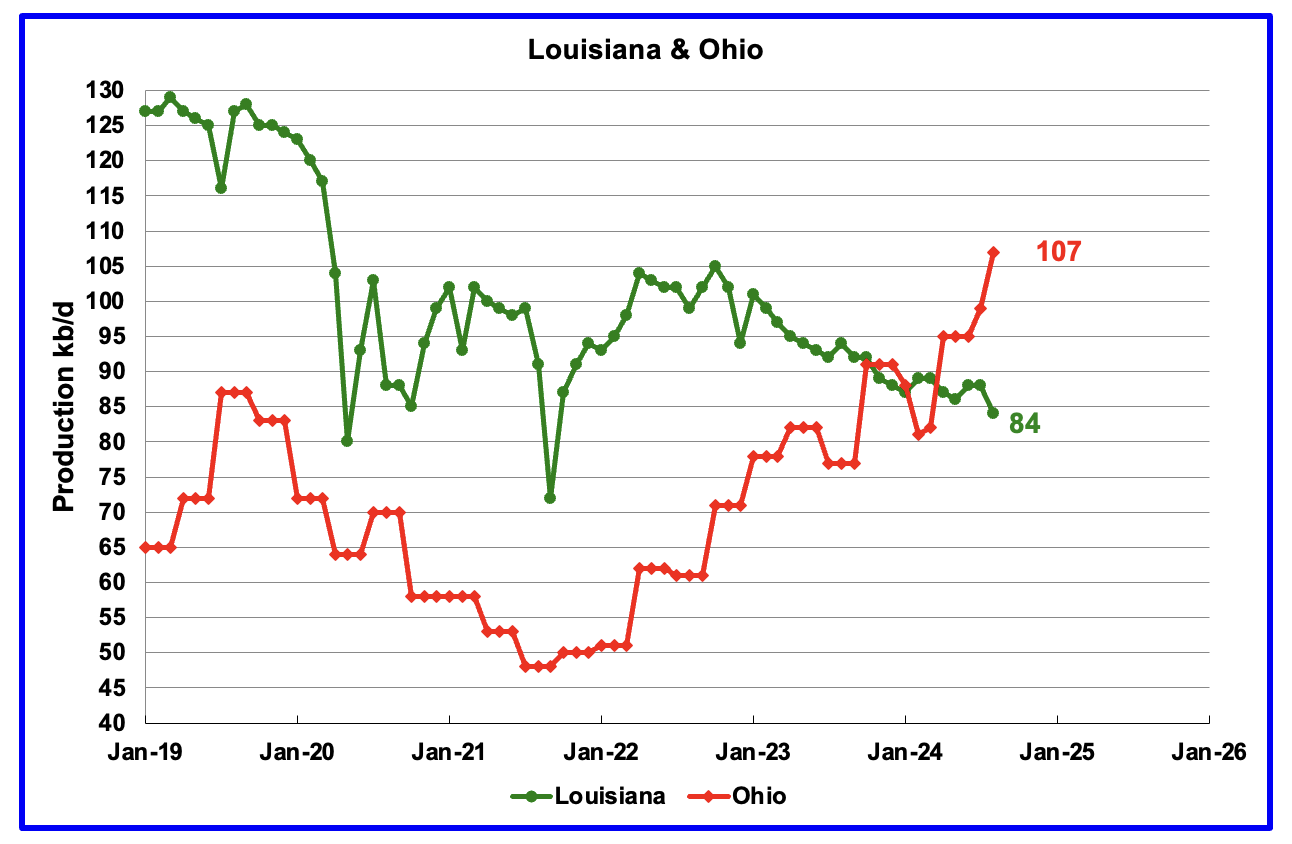
Ohio has been added to the Louisiana chart because Ohio’s production has been slowly increasing since October 2021 and passed Louisiana in November.
Louisiana’s output entered a slow decline phase in October 2022. August’s production dropped by 4 kb/d to 84 kb/d.
Ohio’s August oil production added 8 kb/d to 107 kb/d, a new high. The most recent Baker Hughes rig report shows two horizontal oil rigs operating in Ohio in August, September and October.
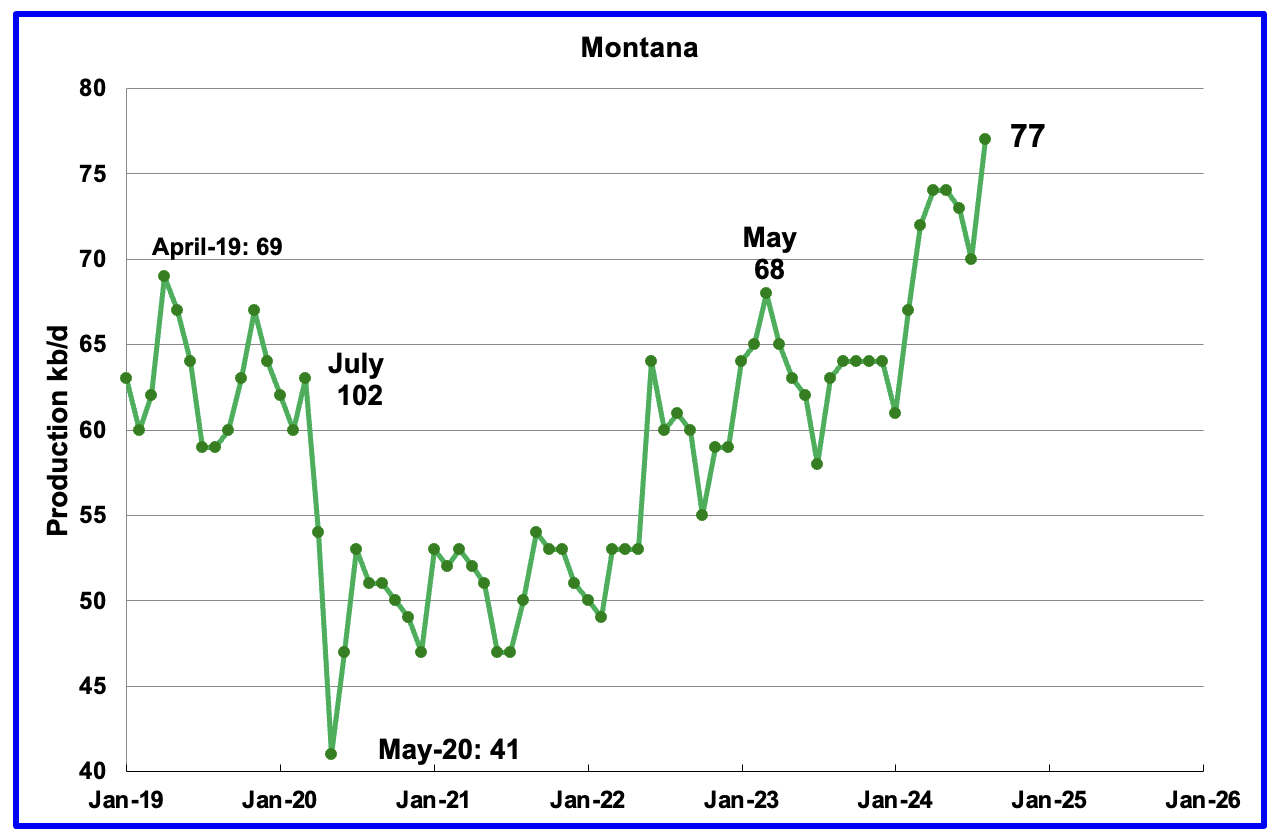
This is a bonus state for November. Production in Montana has been on an almost steady rise since the low of May 2020. Montana had one operational rig from June to October, down from 2 from May.
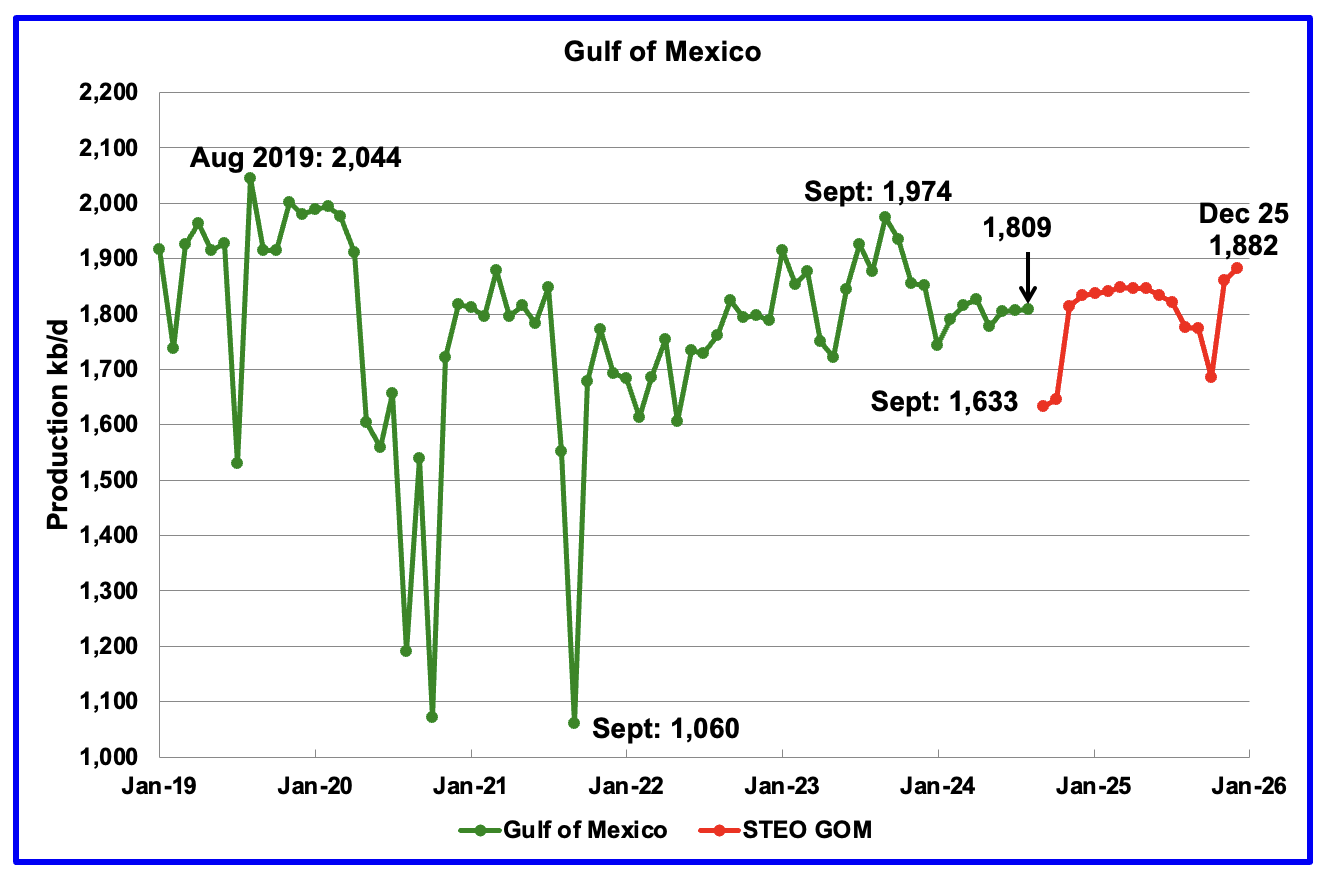
GOM production rose by 3 kb/d in August to 1,809 kb/d but is expected drop by 176 kb/d in September to 1,633 kb/d due to hurricanes.
The October 2024 STEO projection for the GOM output has been added to this chart. It projects production from August 2024 to December 2025 will rise by 73 kb/d to 1,882 kb/d, 25 kb/d lower than the 1,907 kb/d reported last month.
A Different Perspective on US Oil Production
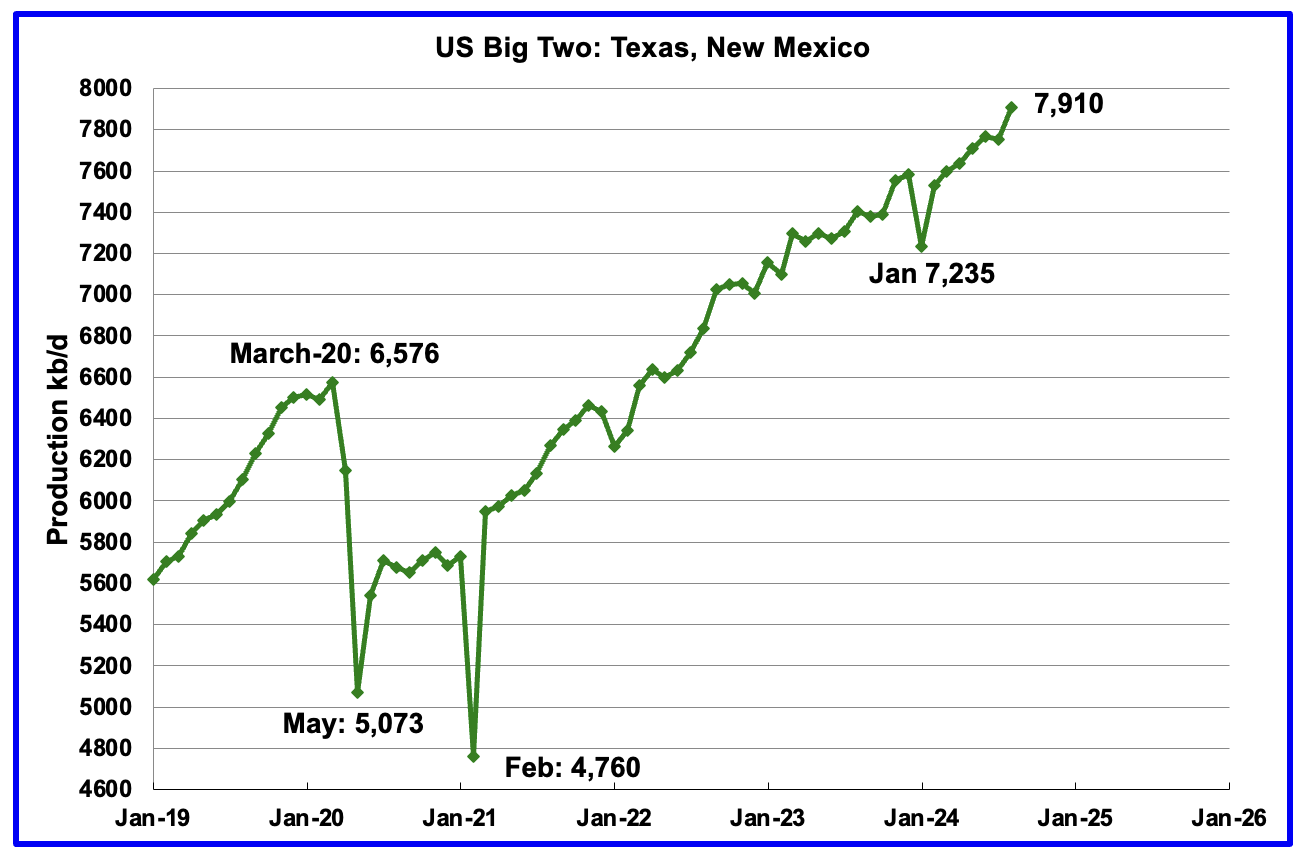
The Big Two states combined oil output for Texas and New Mexico.
August’s production in the Big Two states increased by a combined 156 kb/d to 7,910 kb/d, a new high, with Texas adding 99 kb/d while New Mexico added 57 kb/d.
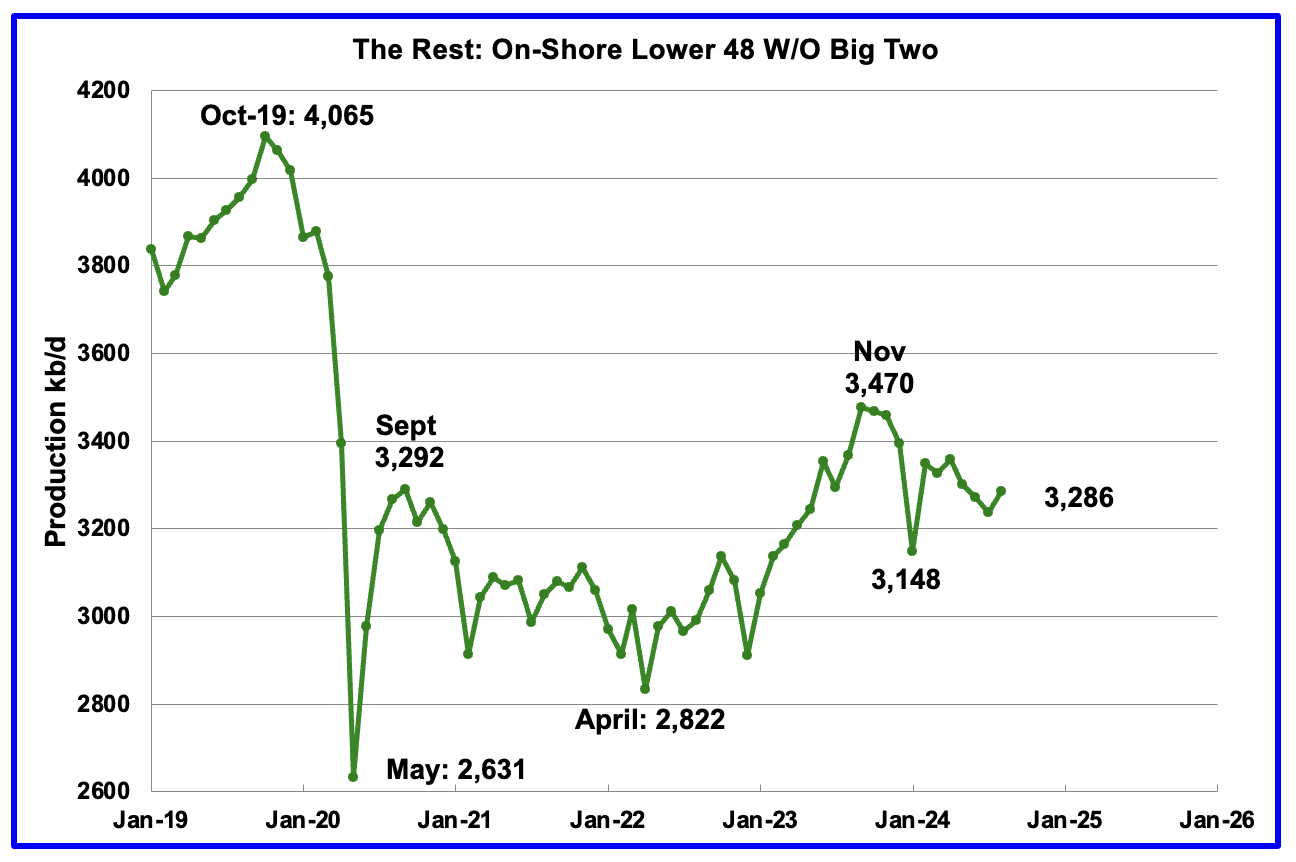
Oil production by The Rest
August’s oil production in The Rest rose by 48 kb/d to 3,286 kb/d and is 184 kb/d lower than November 2023.
The main takeaway from The Rest chart is that current production is below the high of October 2019 and is a significant loss that occurred during the Covid shut down and will not be readily recovered. Note that production is now getting closer to the Sept 2020 post covid rebound to 3,292 kb/d.
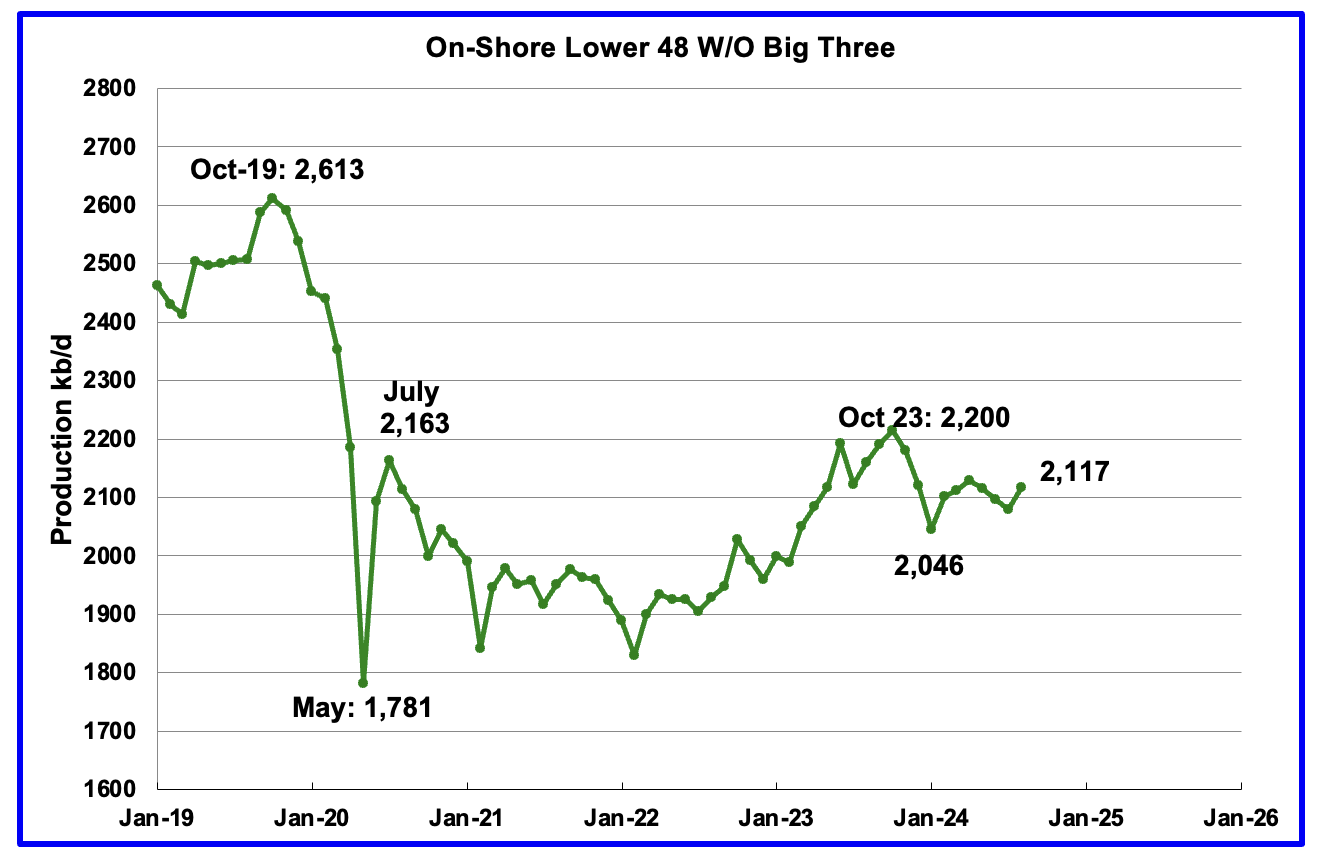
The OnShore L48 W/O the big three, Texas, New Mexico and North Dakota, shows production is on a plateau in the range of 2,125 ±75 kb/d from January 2023.
August’s production increased by 37 kb/d to 2,117 kb/d.
Permian Basin Report by Main Counties and Districts
This special monthly Permian section was recently added to the US report because of a range of views on whether Permian production will continue to grow or will peak over the next year or two. The issue was brought into focus recently by the Goehring and Rozencwajg Report which indicated that a few of the biggest Permian oil producing counties were close to peaking or past peak. Also comments by posters on this site have similar beliefs from hands on experience.
This section will focus on the four largest oil producing counties in the Permian, Lea, Eddy, Midland and Martin. It will track the oil and natural gas production and the associated Gas Oil Ratio (GOR) on a monthly basis. The data is taken from the state’s government agencies for Texas and New Mexico. Typically the data for the latest two or three months is not complete and is revised upward as companies submit their updated information. Note the natural gas production shown in the charts that is used to calculate the GOR is the gas coming from both the gas and oil wells.
Of particular interest will be the charts which plot oil production vs GOR for a county to see if a particular characteristic develops that indicates the field is close to entering or in the bubble point phase. While the GOR metric is best suited for characterizing individual wells, counties with closely spaced horizontal wells may display a behaviour similar to individual wells due to pressure cross talking . For further information on the bubble point and GOR, there are a few good thoughts on the intricacies of the GOR in an earlier POB comment and here. Also check this EIA topic on GOR.
New Mexico Permian
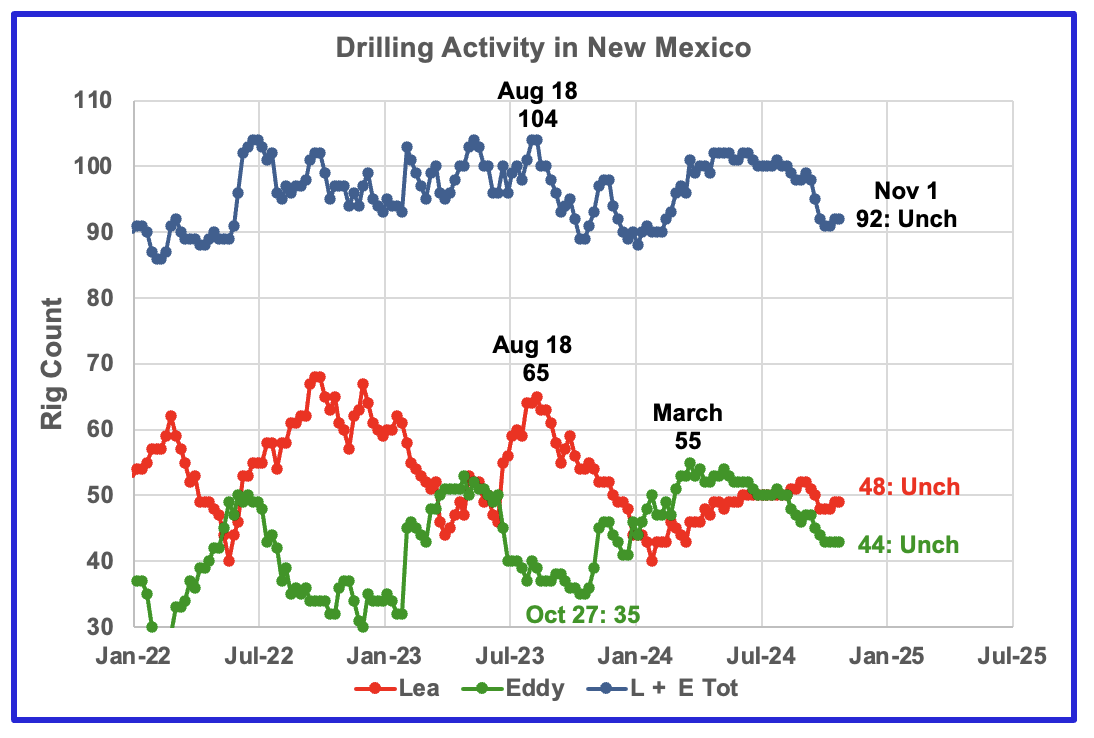
The total rig count in Lea and Eddy counties in the week ending November 1 is down 8 from the early July count of 100.
Lea county has been bouncing around 50 rigs since July. Eddy county rig count has been in a slow decline since March and appears to be hinting at stabilizing around 44 rigs.
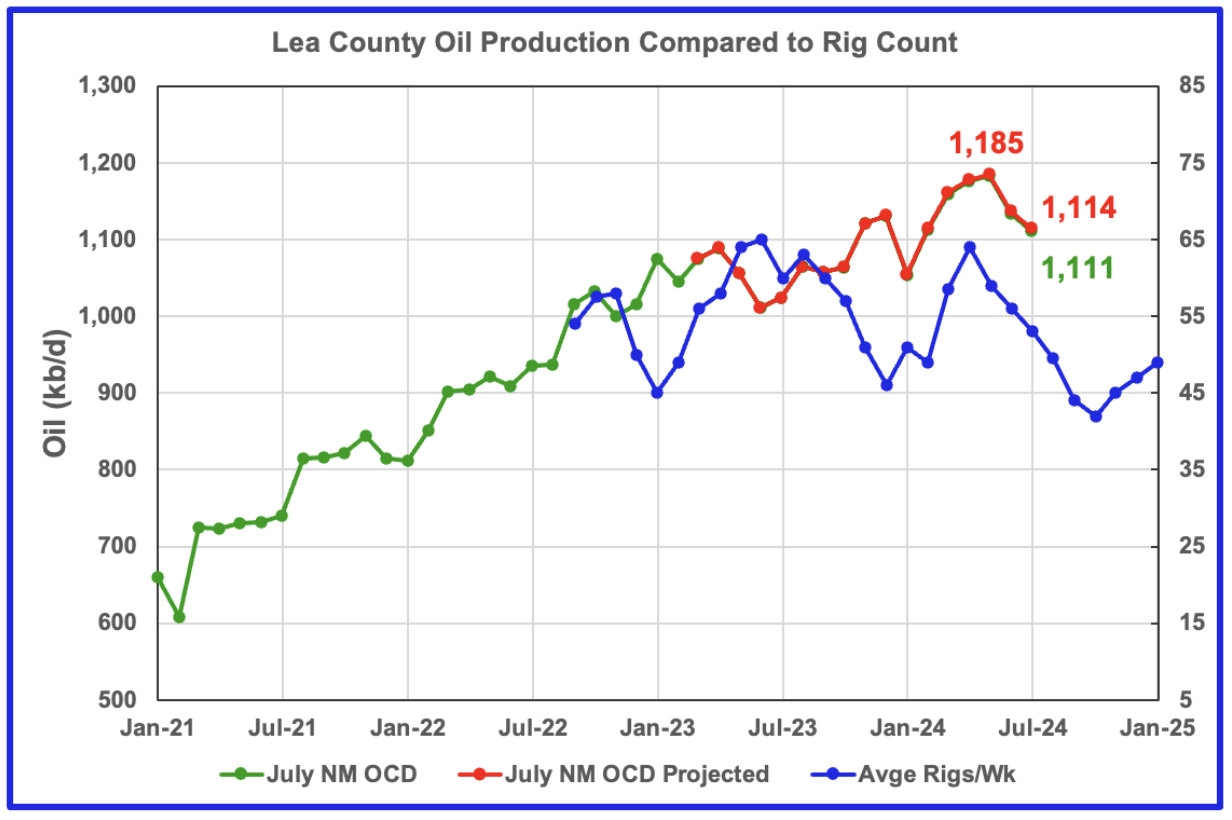
Comparison chart from last month to compare with the current August chart below.
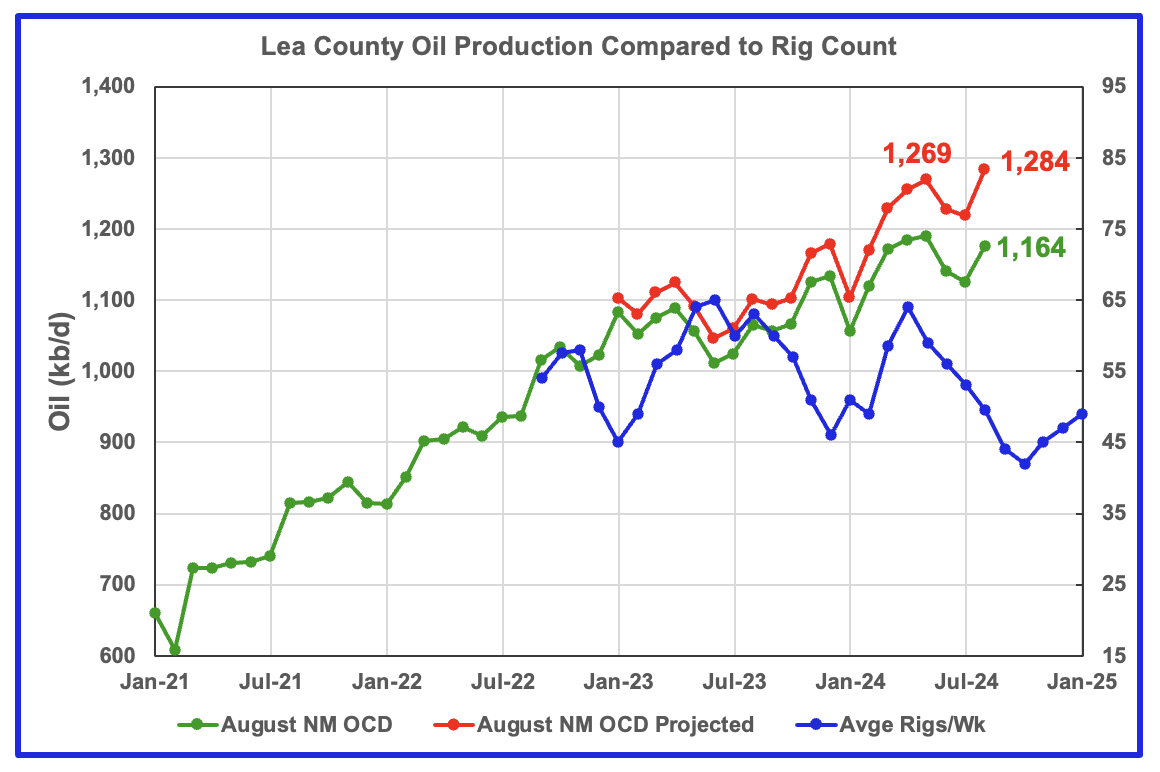
This chart shown in previous posts was indicating that oil production in Lea County was following the drilling chart delayed by 8 months up to July. However while August oil production rose by 61 kb/d, it is incorrect.
The reason for the sharp turnaround from declining production to increasing production is the same as happened in the June update.
In the June update, the following was noted: “The June update made a total upward revision of 48 kb/d to production between the months March 2023 to June 2023. This revision shifted both the original June OCD data and the projection upward and created a big gap between the June data and the projection.” Typically there would be a minimal 1 kb/d or none that far back. (See comparison chart above)
For August, a total upward production revision of 35 kb/d was added between October 2022 and February 2023. In addition a much larger than normal revision was made between October 2023 and March 2024. These two revisions separated the green and red graphs. One can see where the graphs begin to separate in January 2023. Earlier posts showed almost no changes between the original data and the projection after one year, see comparison chart above.”
So again I must say that while this is what the model forecasts, I don’t think the production figures are correct. It should be sorted out next month, provided the production revisions are more typical.
While August is showing a production increase of 61 kb/d, 70 kb/d are due to the revisions noted above. This implies that Lea County August production should have been flat or slightly down.
The blue graph shows the average number of weekly rigs operating during a given month as taken from the weekly rig chart. The rig graph has been shifted forward by 8 months. So the 64 Rigs/wk operating in August 2023 have been time shifted forward to April 2024 to show the possible correlation and time delay between rig count and oil production.
Note that rig counts are being used to project production as opposed to completions because very few extra DUCs are being completed at this time.
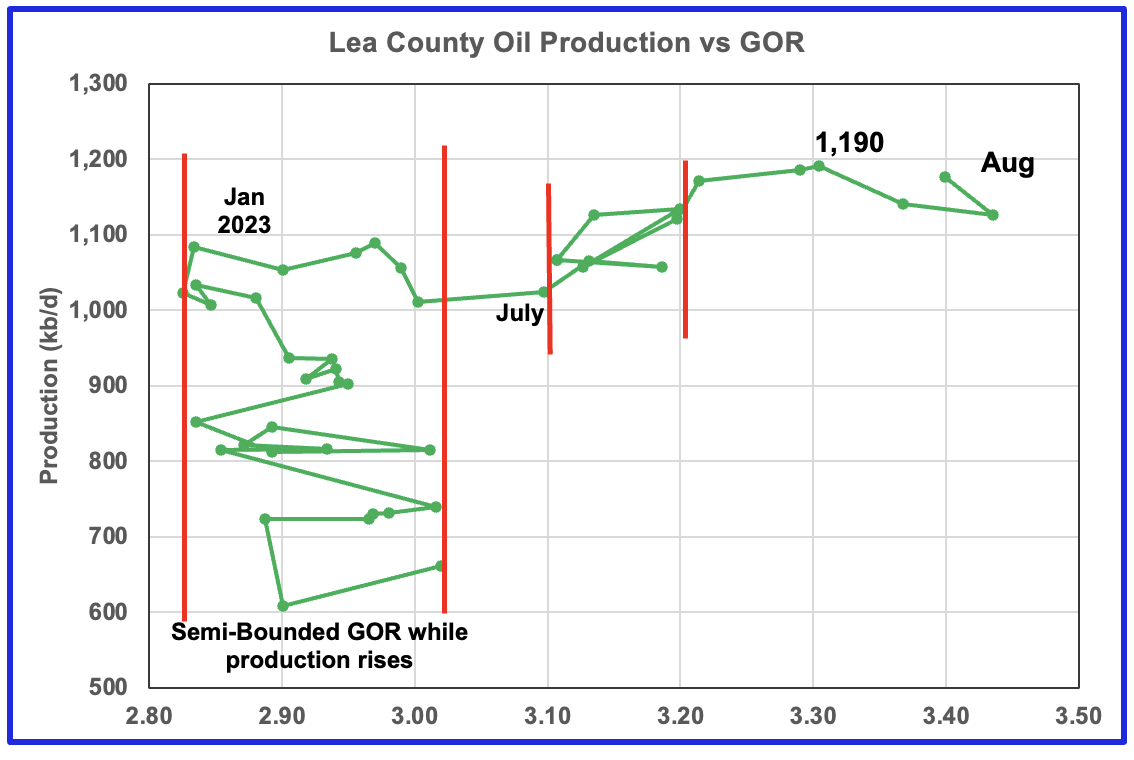
While the production revisions have affected the production charts, the GOR has not been affected.
After much zigging and zagging, oil production in Lea county stabilized just above 1,000 kb/d in early 2023. Once production reached a new high in January 2023, production rose more slowly while the GOR started to increase rapidly to the right and entered the bubble point phase in July 2023.
Since July 2023 the Lea county GOR has continued to increase as production increased within a second semi-bounded GOR. This may indicate that the current production increase is coming from a new bench/field since the GOR’s behaviour since August 2023 to March 2024 time frame appears once again to be in a semi bounded GOR phase accompanied with rising production.
However from April to August, the GOR moved out of the Second semi bounded GOR region and production reached a new high 1,182 kb/d in May along with an another increase in the GOR. The GOR increase since May along with dropping production is another indicator that Lea county has entered the bubble point phase for a second time and that production in the near term indicates that Lea County may be past its peak.
This zigging and zagging GOR pattern within a semi-bounded GOR while oil production increases to some stable level and then moves out to a higher GOR to the right has shown up in a number of counties. See an additional two cases below.

Comparison chart from last month to compare with the current August chart below.
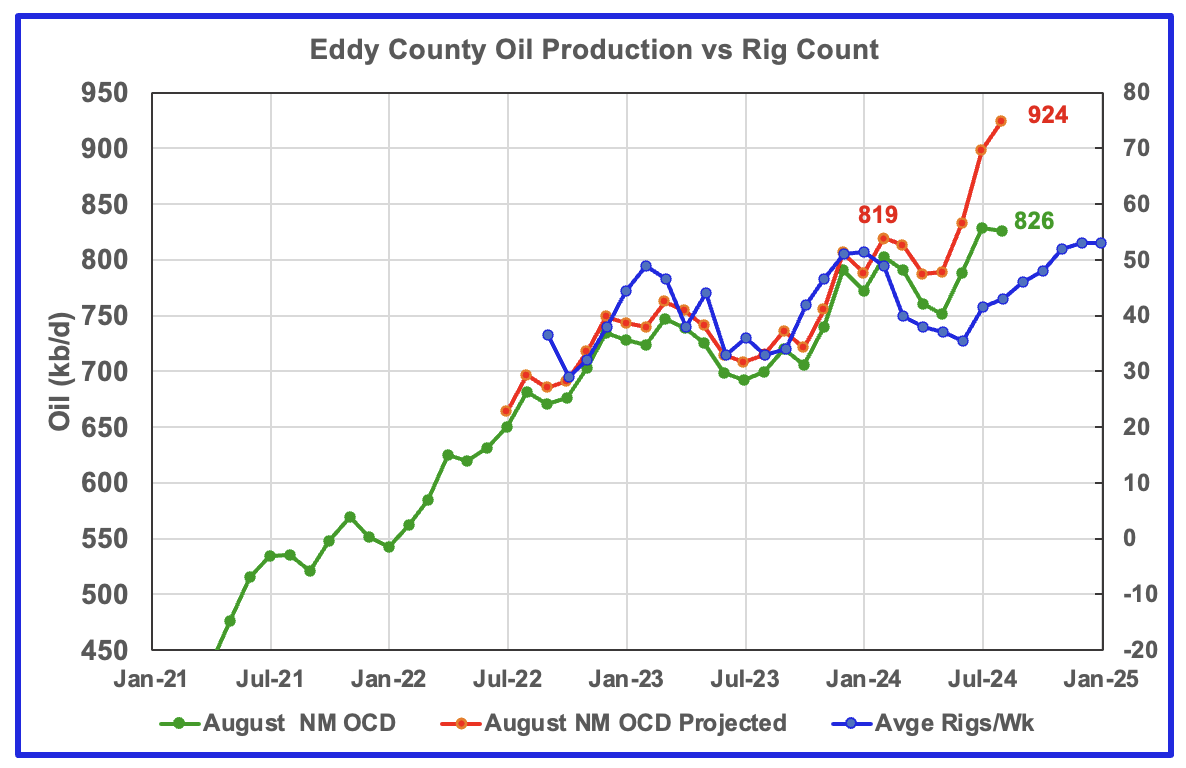
Eddy county oil production updates have had the same effects to the production projection as the Lea county updates. In this case the updates start to show up in July 2023. Again last month’s Eddy County chart is shown above for comparison. Note the minimal changes between the initial July data before January 2024.
The blue graph shows the average number of weekly rigs operating during a given month as taken from the above weekly drilling chart. The rig graph has been shifted forward by 8 months to roughly coincide with the increase in the production graph starting in October 2023.
If production were to follow the rig count trend going forward, production should continue to rise for the next few months, but not as much as shown.
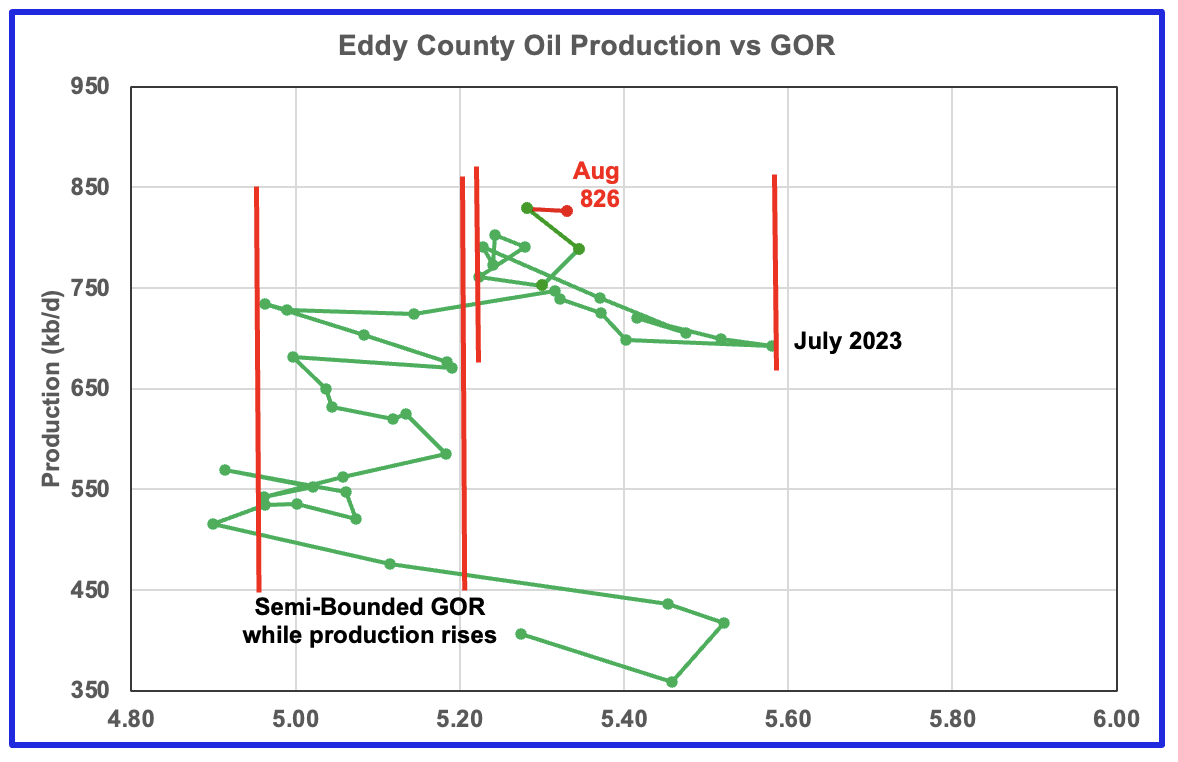
The Eddy county GOR pattern is similar to Lea county except that Eddy broke out from the semi bounded range earlier and for a longer time and then added a second semi bounded GOR phase. For August it continues to stay within the second semi-bounded region.
Texas Permian
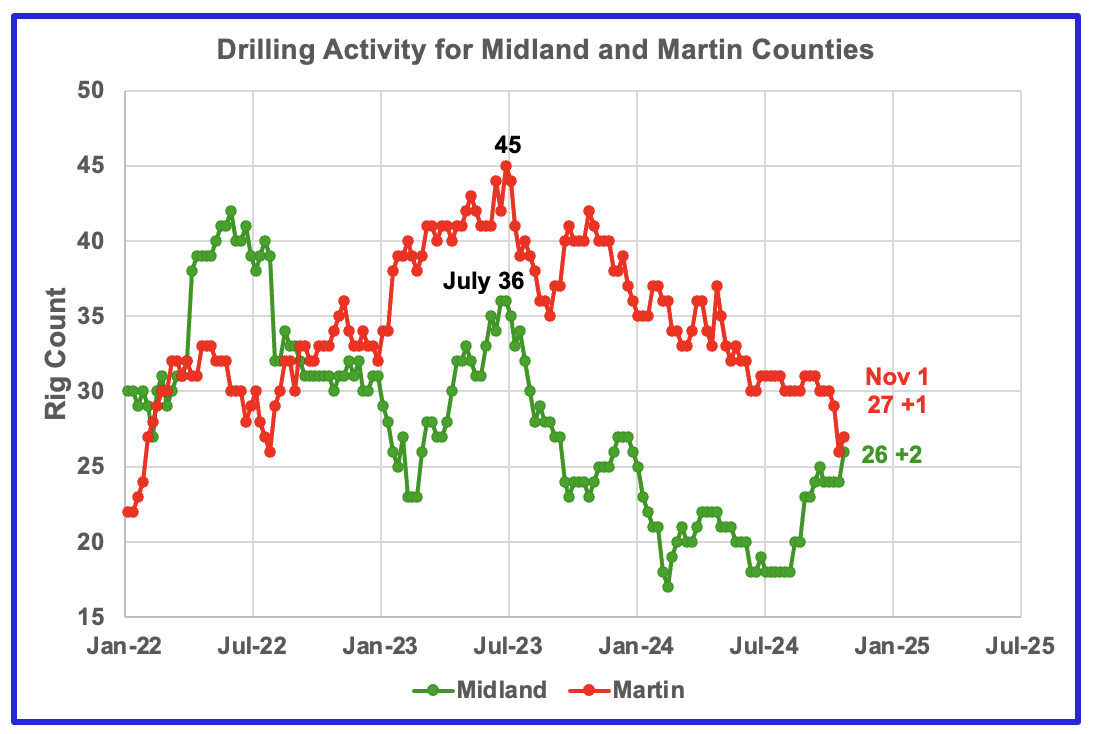
The Midland county rig count has been rising since July and is up 8 to 26. The opposite is true for Martin county. On November 1, 27 rigs were operational, down from 45 in July 2023.
Texas County Oil Production
Texas made significant revisions to its earlier production data and the projections presented in this section in earlier posts will not be posted for August since I believe they are incorrect for the same reasons as given for Lea and Martin counties.
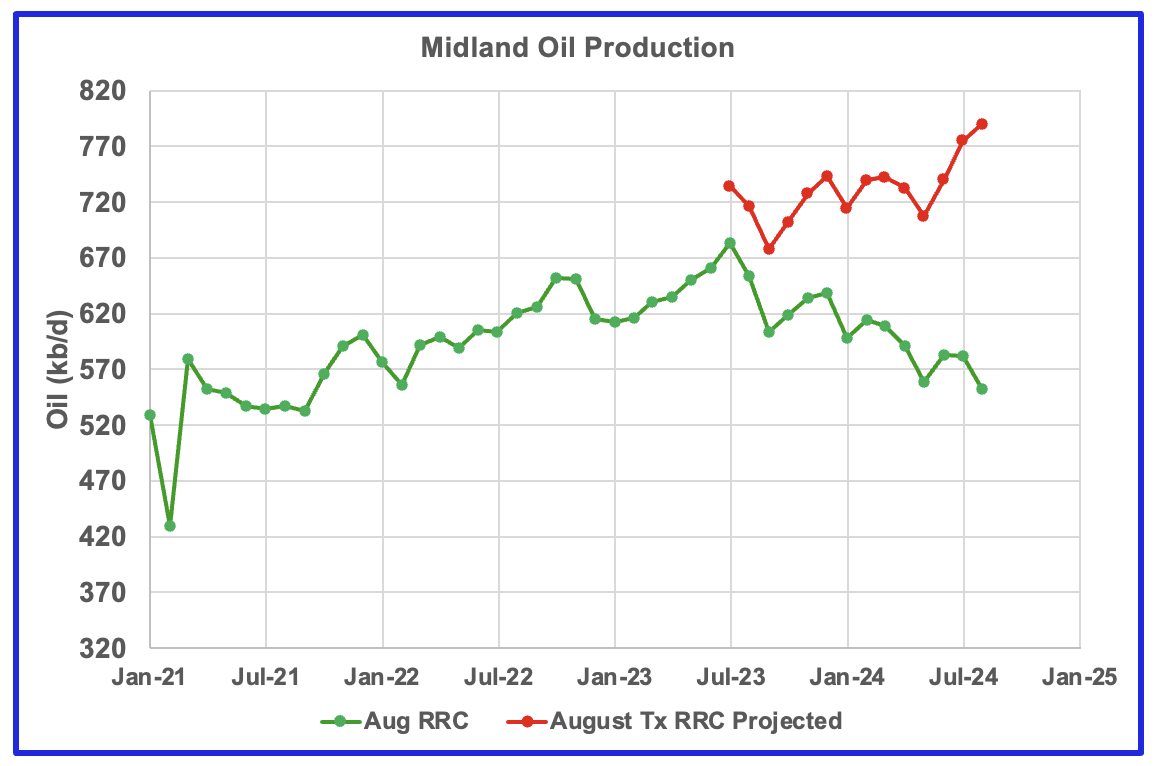
Above is an example. For many months in previous posts, Midland county production has been declining. The revisions turn that around and show rising production.
The GORs for a number of counties and District 8 are not affected by the revisions and are shown below.
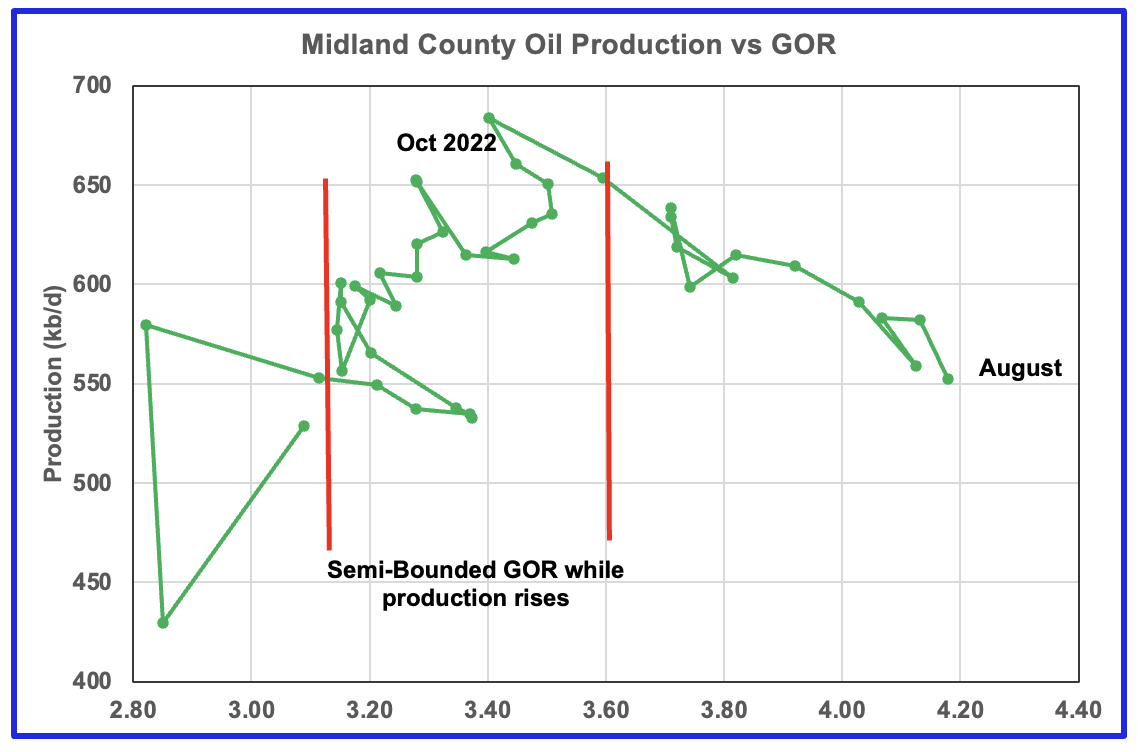
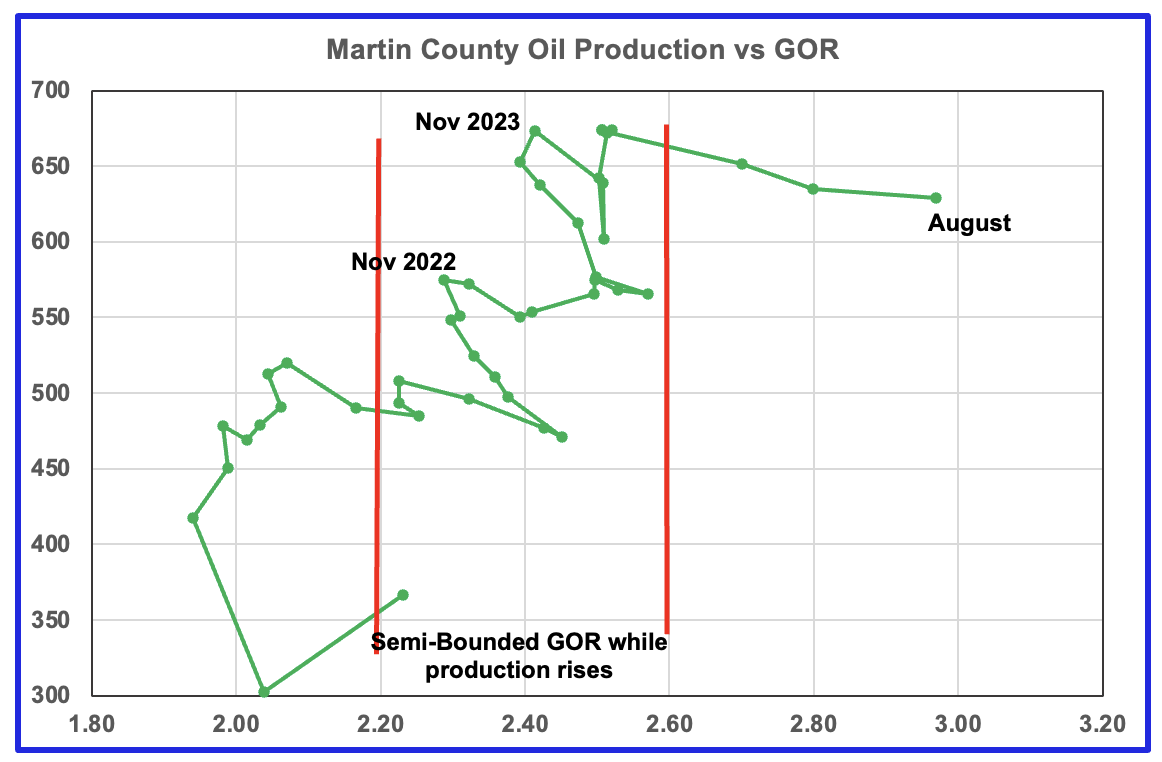
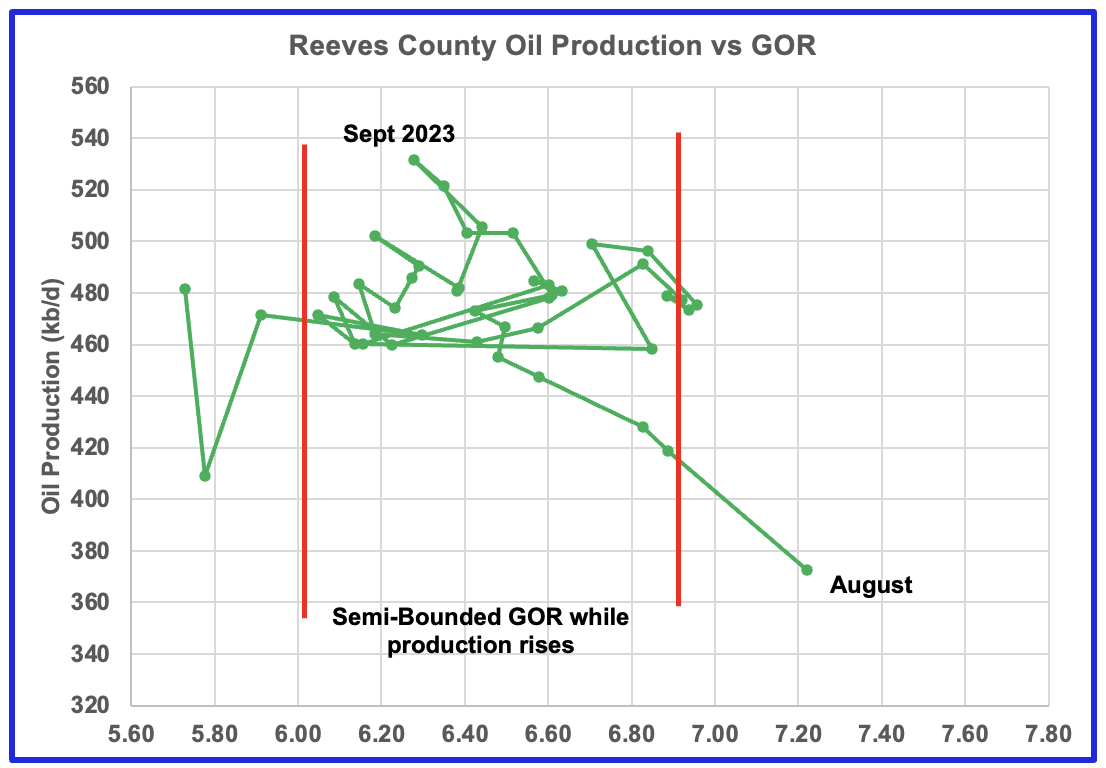
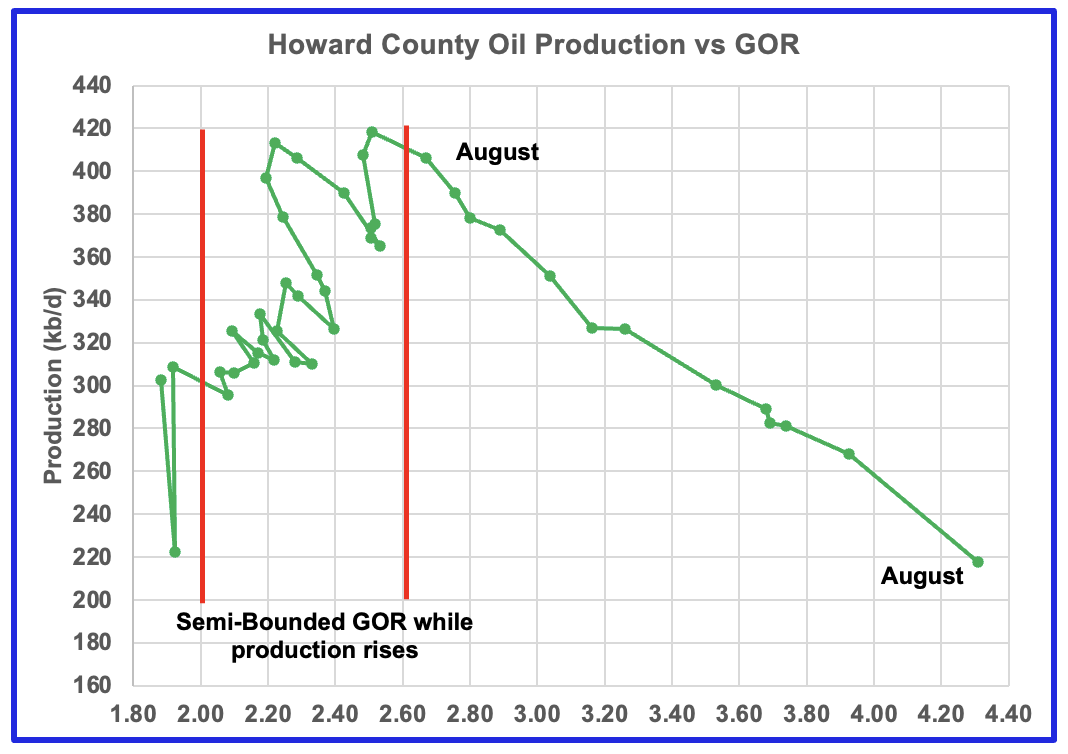
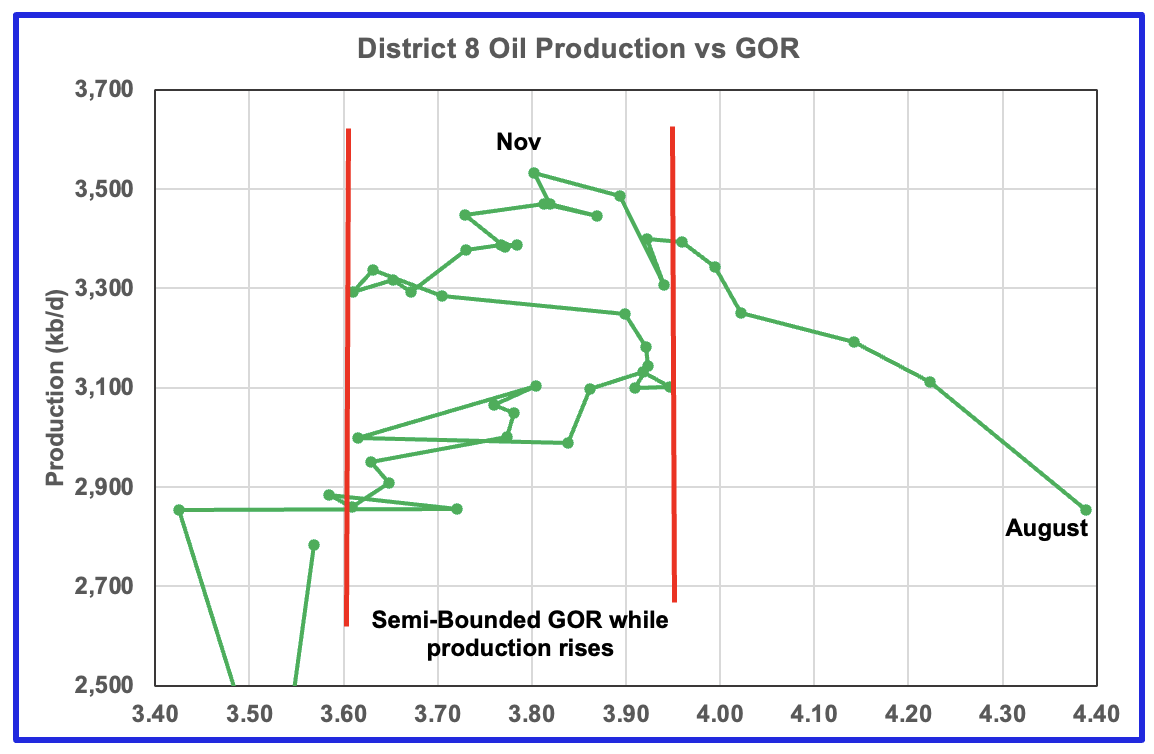
The GOR is increasing every month in the four Texas counties and District 8, which includes the four counties plus many others. The smallest production drop is in Martin county and it may be on a production plateau before starting to drop.
Drilling Productivity Report
The Drilling Productivity Report (DPR) uses recent data on the total number of drilling rigs in operation along with estimates of drilling productivity and estimated changes in production from existing oil wells to provide estimated changes in oil production for the principal tight oil regions. The new DPR report in the STEO provides production up to September 2024. The report also projects output to December 2025. The DUC charts and Drilled Wells charts are also updated to September 2024.
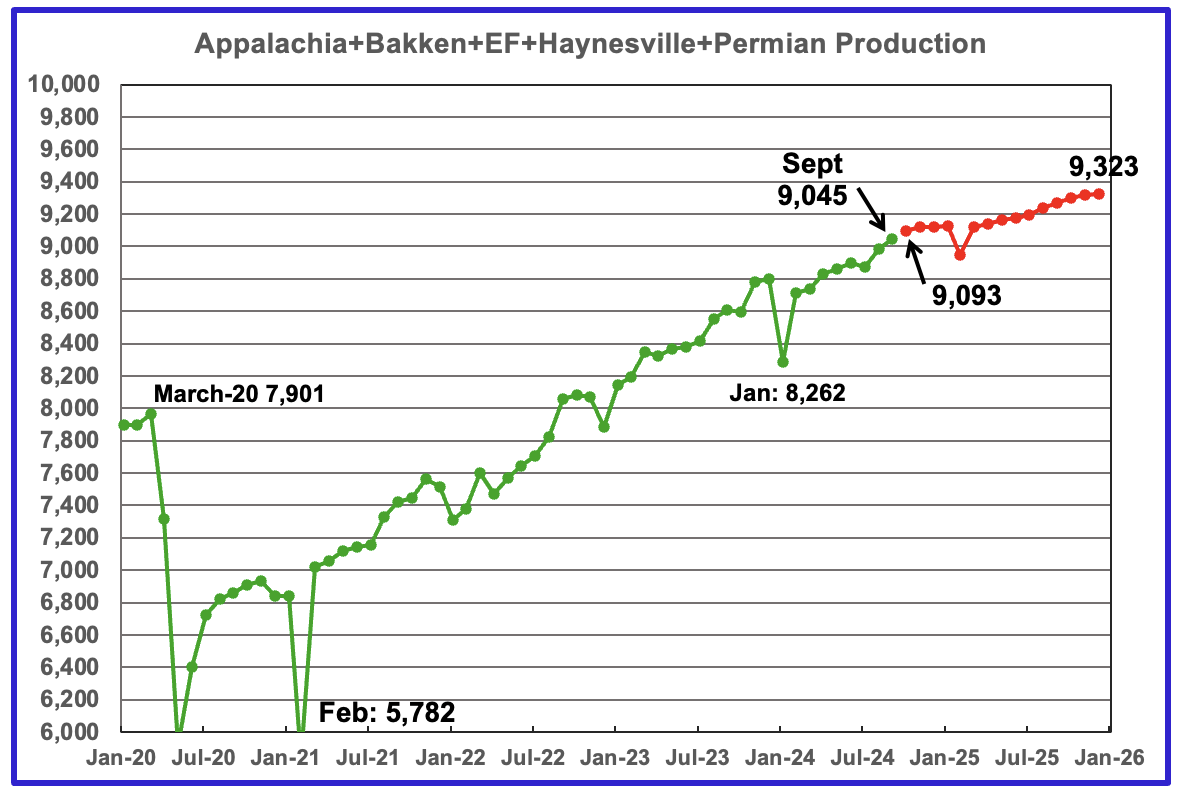
The Sepember 2024 oil production for the 5 DPR regions tracked by the EIA is shown above. Also a projection by the STEO to December 2025 has been added, red markers. Note DPR production includes both LTO oil and oil from conventional wells. Production for the Anadarko and Niobrara regions is no longer available.
The DPR is reporting September oil output in the five regions increase by 62 kb/d to 9,045 kb/d. Production is expected to grow by 48 kb/d in October to 9,093 kb/d. By December 2025 production is expected to reach 9,478 kb/d. This is 155 kb/d lower than forecast in the previous update. Also the previous update expected September production to be 9,063 kb/d, 18 kb/d higher than actual of 9,045 kb/d.
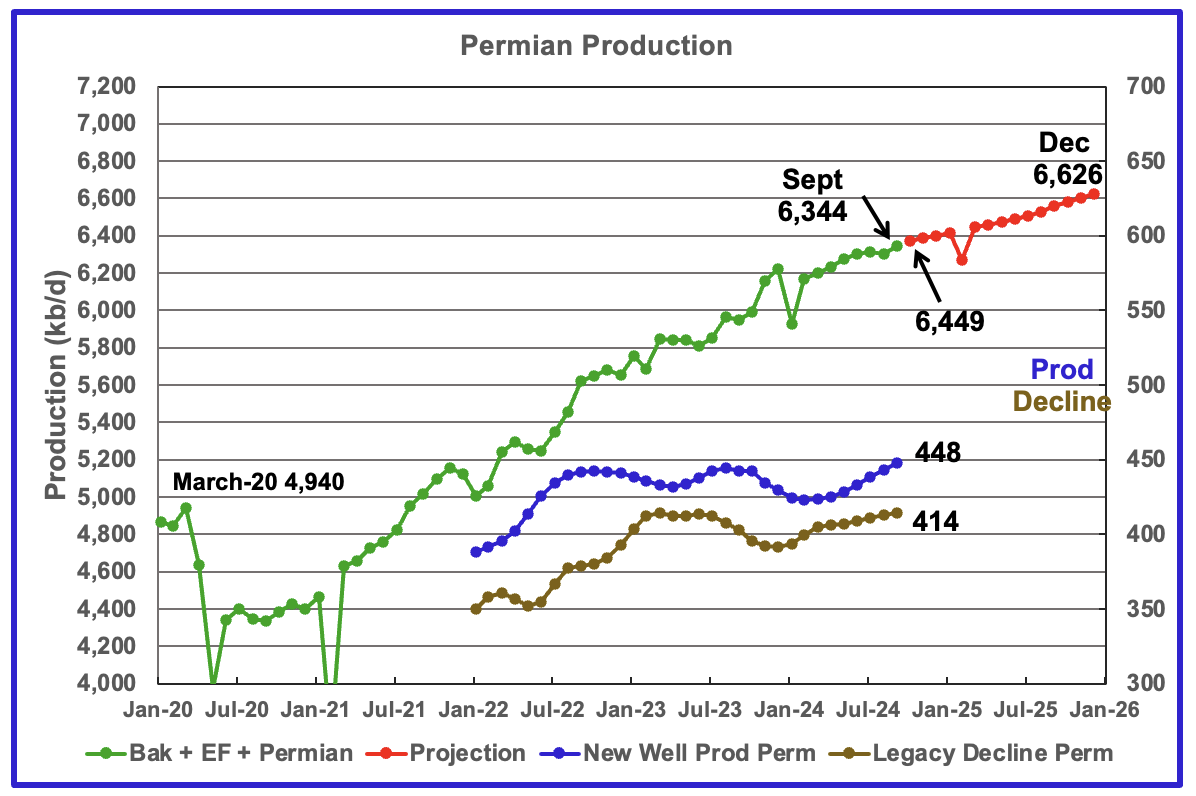
The EIA’s October DPR report shows Permian output increased by 42 kb/d to 6,344 kb/d. By December 2025 output is expected to be 6,626 kb/d, 102 kb/d lower than estimated in the previous report.
Production from new wells and legacy decline, right scale, have been added to this chart to show the difference between new production and legacy decline.
According to the new wells and legacy decline graphs September production should have increased by 34 kb/d which is close to the actual 42 kb/d reported.

Output in the Eagle Ford basin has been increasing since January 2024 and may have peaked in August 2024. September production is down by 5 kb/d to 1,197 kb/d. Production is projected to decline going forward with output in December 2025 projected to be 1,085 kb/d which is down by 77 kb/d from the previous STEO projection of 1,162 kb/d.

The DPR/STEO forecasts Bakken output in September rose 23 kb/d to 1,305 kb/d. The STEO projection out to December 2025 shows output varying between 1,325 kb/d and 1,370 kb/d over the next 15 months.
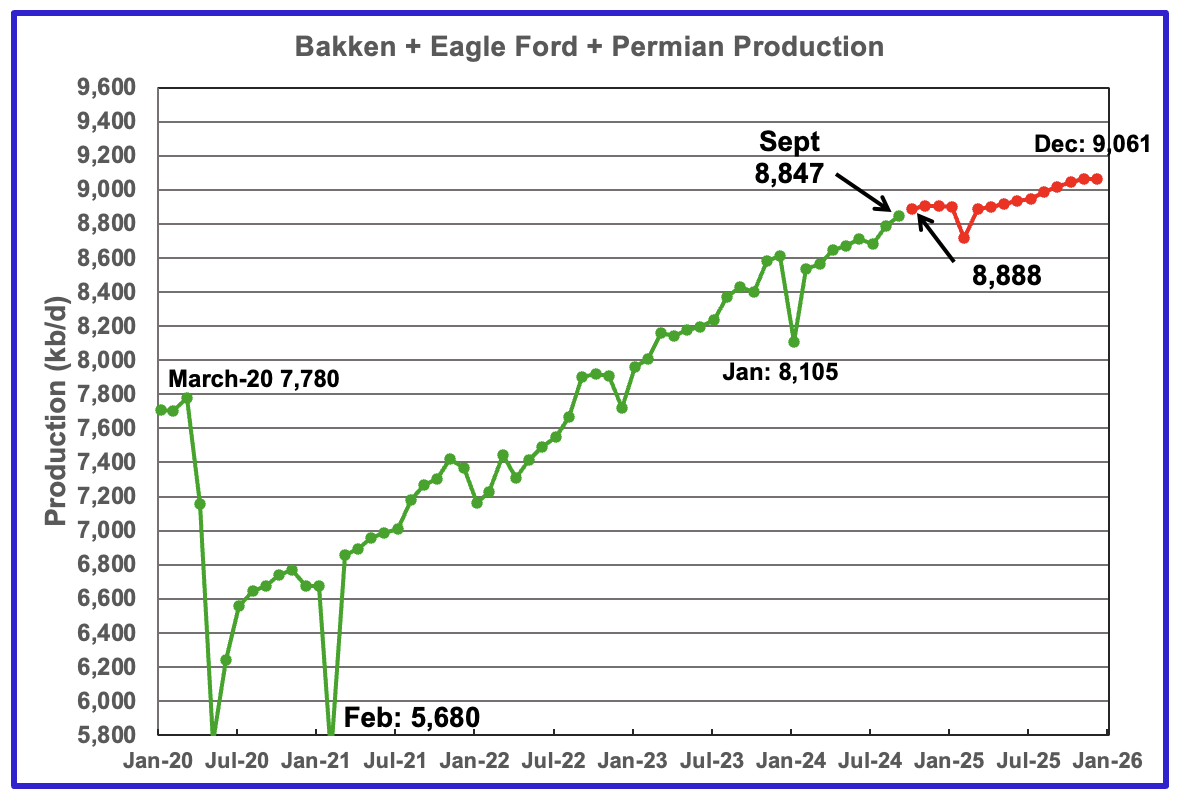
This chart plots the combined production from the three main LTO regions. For September output rose by 61 kb/d to 8,847 kb/d. Production in December 2025 is expected to reach 9,061 kb/d. This is 207 kb/d lower than forecast in the previous report.
DUCs and Drilled Wells
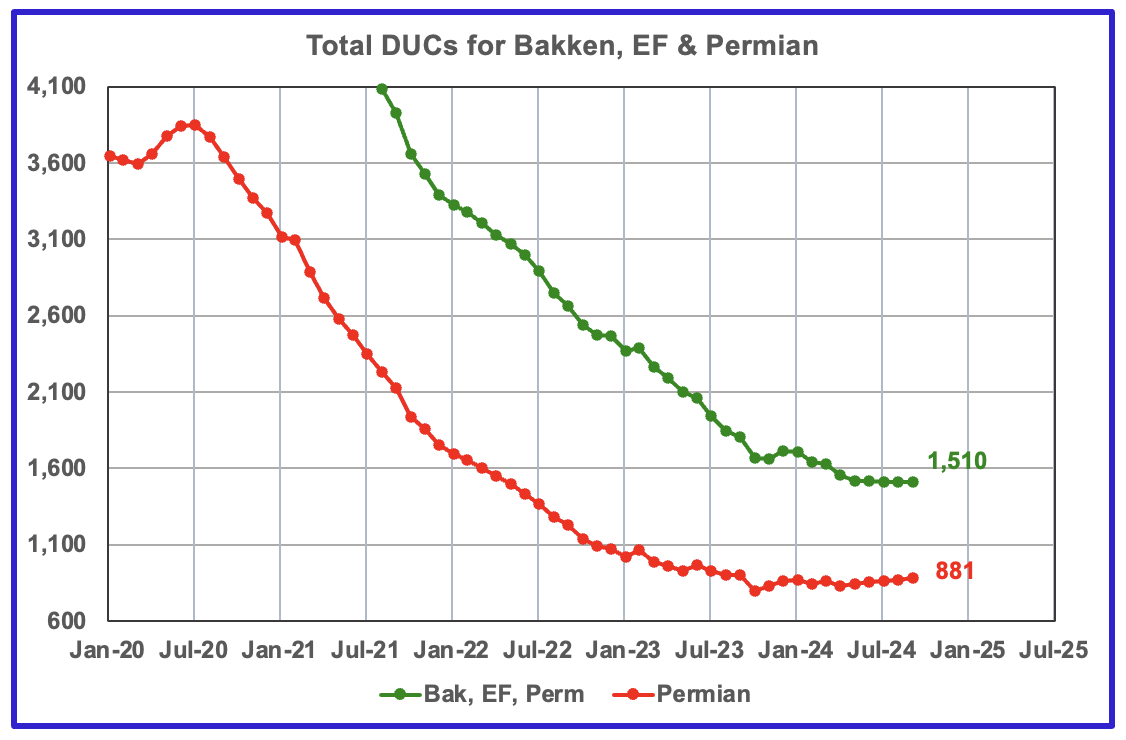
The number of DUCs available for completion in the Permian and the three major DPR regions has fallen every month since July 2020. September DUCs decreased by 1 to 1,510. In the Permian, the DUC count increased by 11 to 881.

In the three primary LTO regions, 615 wells were completed and 614 were drilled, i.e. only 1 extra DUC was completed.

In the Permian, the monthly completion and drilling rates have been both stabilizing in the 440 to 450 range over the last five months.
In September 2024, 440 wells were completed while 451 new wells were drilled. This is the fifth month in which the number of wells drilled exceeded the number of completed wells. Does this indicate that some new oil area has been discovered?
Considering the price of oil the new high in U.S. output is amazing.
It looks like the global oil glut will last for several years, with U.S. output, OPEC spare capacity and new off shore developments adding to supply and electric cars curtailing demand.
https://oilprice.com/Energy/Crude-Oil/Looming-Oil-Glut-to-Reshape-Global-Energy-Landscape.html
Loadsofoil
I think we have to look at the August data in the light of the EIA’s projection and last month’s data from the four main Permian basins.
The August gain of 195 kb/d is an outlier. It must be the result of a number of earlier actions coming together in August. It is also close to the EIA production projection for next year for a steady rate of 13,500 kb/d. Throw in last month’s production data on the four main Permian basins indicating that their combined production has been flat for the last six months and I think that it all indicates that US production is on a plateau of 13,500 kb/d with little possibility of significant growth beyond that.
WTI below $70/b will only reduce the incentive to drill in the US. The drillers will have to get on board to help OPEC keep prices around $70/b.
Thank you for the report.
“WTI below $70/b will only reduce the incentive to drill in the US.”
If so, it sounds like a good thing since Permian oil production then might then have a little longer extension of production in the 2030’s.
Longevity of production is more important than level of production during this peaking period, as I see it.
Ovi
I agree that oil prices this low, is and will curb drilling. It is funny to think that some Peak Oil proponents argued that by 2020 global oil production would be less than 60 million per day and prices would range from $150 to $250.
The reality today is OPEC plus spare capacity is around 3 million barrels per day. Canada can easily produce more, Guyana is expected to produce 1.6 million bbl/d by 2030.
Peak oil is no longer a problem as electric cars are an excellent substitute for petrol. The consequences of burning all this oil, gas and coal is already being felt. Rapidly things such as droughts, floods and fires are becoming the destroyers of capital, security and lives.
https://www.politico.eu/article/spain-floods-valencia-europe-climate-change-preparation/
This is just a few weeks after large fires on the peninsula. In Africa they are killing elephants so people have something to eat.
Loads of oil,
Let’s say the tight oil phenomenon never occurred. In that case 2023 output might have been 72 Mb/d rather than 81 Mb/d (subtracting about 9 Mb/d of US tight oil produced, there is some produced in Argentina and Canada as well, not sure of the quantities). The 60 Mb/d estimates, if you are remembering correctly were based on conventional crude only and URR estimates were too low back in 2005 (2000 Gb when 2500 to 2700 Gb is a better estimate).
Consider this Hybrid Shock Model by Sam Foucher from April 17, 2007 where 2020 C plus C output is about 79.5 Mb/d in 2020.
http://theoildrum.com/node/2430
and fig 9 from the post at link below
http://theoildrum.com/files/ShockII_RU.png
The URR of the scenario above is about 2600 Gb.
The focus is also too much on the global peak. Look at the Mexican peak
https://pbs.twimg.com/media/Gbu1qk5b0AEBBDf?format=jpg&name=large
It caused a huge wave of migrants which has created anger in the US society, sweeping Trump into power.
Peak oil in Venezuela. Peak oil in Yemen where Houthis have made shipping more costly
Peak oil in UK caused Brexit etc. etc.
Global Peak and its major three components
Matt,
Many of the migrants are coming from Central America on foot through Mexico, Venezuela’s problems are political and not really related to peak oil. Trumps election is mostly economic issues and the working class doing poorly in the US and voting for a change. Some of it is immigration and culture wars with the left focusing too much on identity politics and political correctness at the expense of pocketbook issues which matter to voters. Very poor messaging by the Democratic Party and also chaos leeding to the nomination of Harris with Biden leaving the race much too late.
Anyone who thinks Mushalik doesn’t have a point hasn’t visited his rather extensive website. I have read the majority of it over many years. I believe he is unmatched in this field.
….and furthermore, it is incumbent upon all people following PeakOil to first find an explanation of world events using PeakOil- don’t you think?
80% of Mexico’s electricity generation comes from natural gas. 90% of Mexico’s natural gas comes via pipeline from Texas.
10% tariffs on China equals moving manufacturing to Mexico. Which will put upward pressure on natural gas demand. At a time that AI and EV’s are also putting upward pressure on natural gas demand.
Sounds inflationary. But it’s not. Energy will be prioritized and parts of the economy will die bringing energy prices right back down.
We will see a spike in prices followed by demand destruction that brings prices right back down.
The economy, global economy is going to shrink. It will likely overshoot to the downside. Meaning a severe contraction then some growth from much lower levels after the contraction faze is over.
Matt
You are absolutely correct, peak oil is far more relevant on a country by country basis. Syria could no longer subsidise fuel for farmers who were already hard pressed and this pushed many to bankruptcy. The protesters were killed by the security forces and civil war broke out.
Egypt has had riots and a military coup since its oil production peaked.
But all these countries have two other things in common, widespread corruption that has robbed billions from the economy and crippling incompetence. A country where every level of government is corrupt and incompetent will suffer greatly once income from natural resources start to decline.
Some of the richest countries in the world have very little in terms of oil and gas.
“Many of the migrants are coming from Central America on foot through Mexico, Venezuela’s problems are political and not really related to peak oil”
Collapse in oil production is much worse than peak oil, which could have gentle slope.
So the collapse in oil production is the reason for the economic issues, reinforcing the vicious political cycle and degrading the institutions.
Unless Dennis believes that the reversal in oil production in Mexico and Venezuela is right around the corner. LOL
Danklim,
The collapse in oil production in Venezuela is a political issue primarily, Central American nations don’t produce much oil. Most of the migrants coming to the US are not Mexican, they are from Central America and Venezuela.
https://ohss.dhs.gov/sites/default/files/2024-06/2024_0418_ohss_estimates-of-the-unauthorized-immigrant-population-residing-in-the-united-states-january-2018%25E2%2580%2593january-2022.pdf
Dennis, that’s an interesting document about the origins and numbers of illegal immigrants. Who knew, given all the hype, that the numbers of for example Mexican immigrants had been declining? (at least at last survey date 2022)
But “Most of the migrants coming to the US are not Mexican, they are from Central America and Venezuela” ?? it absolutely doesn’t say this. Did you read your own doc? 5M Mexico, a couple hundred thousand Venezuela.
On the larger topic of the effects of peak oil I sometimes think about price. How, back in the day, I could run the car on ten or twenty bucks a month. a MONTH. People now spending several hundred to accomplish the same thing. Mum and dad going off to work and needing 5 or 6 grand for fuel for the year. To some people, that’s a rounding error. To some, it’s every able scrap of resource, and leaving behind empty cupboards. So when we say the “economy” is what people care about (and voted on) how much of that comes from the price of energy directly, as well as it’s flow-on effects into other goods and services.
Duanex,
The net migration of unauthorized immigrants from Mexico is negative since 2010. The unauthorized immigrants from Mexico in the US in 2020 was 4.97 million and in 2022 the number was 4.81 million, this is a decrease of 180 thousand over a two year period. The biggest category is “all others”, but you are right not a big influx from central america from 2020 to 2022, most of the central american influx was 2010 to 2020, there was some increase from South America from 2020 to 2022. My main point was that we do not see much increase in unauthorized immigrants from Mexico since 2010 , the number has decreased from 6.83 million in 2010 to 4.81 million in 2022. So pointing to peak oil in Mexico leading to increased immigration seems to not be quite right, there are other factors in play.
Oil is much cheaper today than it was from 2010 to 2014, when real prices for oil in 2024$ averaged $128/bo for WTI vs about $80/bo in 2024$ during Biden’s time in office.
Most of the gains in real income in the US have been for those in the top 10% in income since 1981. The working class has fallen behind because of a reduction in the tax burden of the wealthy compared to earlier periods (1939-1980 especially).
I said the collapse in oil production is the reason for the economic issues, reinforcing the vicious political cycle. Russia’s oil also collapsed during the 90s which led to Putin and the subsequent political debacle (dictatorship if you will). True enough, Mexico’s oil downturn was more forgiving, nothing left to export though. Not to mention US natural gas.
That was the main point, economic issues lead to political upheaval.
Figure 9 from April 17, 2007 Oil Drum post by Sam Foucher on Hybrid Shock Model
The model predicts about 27.5 Gb of World Oil output in 2030 which is about 75 Mb/d, with URR=2600 Gb. Note that this was prior to the rapid increase in US tight oil which started around 2010.
US tight oil
Ovi,
It is not clear that there can be no further growth in US output, perhaps water disposal issues in Texas will not allow any further growth. If oil prices and natural gas prices increase, we could see higher rig counts, footage drilled and output. I doubt oil prices remain low long term unless the transition to electric land transport proceeds more quickly than I have guessed. I do think that future US growth in C plus C output will be slower than in the past, perhaps an average annual rate of increase of only 200 to 300 kb/d from 2025 to 2028, after that I expect flat or even decreasing output as the EV transition takes hold.
If we look at annual average increase for Dec 2023 to Dec 2025 (using STEO projection from October 2024) for US C plus C it is about 316 kb/d. If we consider average annual output from 2023, 2024, and 2025 the trend is an annual average increase of about 305 kb/d over that 3 year period. This seems pretty reasonable, but perhaps there is no further growth beyond the 13500 kb/d level reached in 2025, especially if oil prices remain under $80/b in 2024$ and natural gas prices remain under $3/MCF in 2024 $.
Ovi,
If the drilling and completion numbers for the Permian basin are accurate over past 5 months or so (I doubt this is true) it could be that the DUC inventory reached the lowest level that was though manageable by the collective producers so the increased drilling a bit to increase the number of wells in progress to match future completion plans. I doubt there has been a new area or “play” discovered, the Basin is pretty well explored since 1930 or so.
The oil men with better local knowledge can correct me and we will learn something.
Dennis
I agree that any new play has been discovered. I was thinking more in terms of a smaller sub-bench in Lea and Eddy counties.
There is something truly remarkable about the NM Permian since the number of rigs used has been pretty steady around 100 since July 2022 with small dips in between while the Texas count dropped. Is the NM count roughly steady because they still have good areas to drill while Texas is running out of good areas?
Ovi,
I don’t know the answer. The Delaware sub-basin may be larger and I believe the horizontal tight oil development started later than the Midland sub-basin. Generally Lea and Eddy counties have had the highest performing wells in the Permian basin.
Dennis, there are many new Permian plays in various stages of development. The Mississippian and Barnett are working and expanding in several Midland Basin Counties, like Ector and Andrews. Also some interesting Wolfcamp trends on the platform.
Birch Resources has some amazing recent completions toping 2,000 BOPD in south Dawson County and expanding. This is apparently in the Dean Sand/silt, not a shale.
https://www.hartenergy.com/exclusives/hot-permian-pie-birchs-scorching-new-dean-wells-dawson-county-210729
Sorry, don’t have full access.
Gungagalonga,
The Dean has had wells in the Permian Basin for quite a while starting around 2015 for horizontal wells, Barnett and Mississippian have not seen a lot of horizontal well development in the Permian Basin as of Enno Peters last Permian report in April 2024.
https://novilabs.com/blog/permian-update-through-jan-2024-2/
Yes, the Dean has produced conventionally for decades and horizontally for the past 10 years or so. EOG picked at it and other targets in Dawson County for a while and has had some success, but Birch has made it sing this year with wells making over 500,000 BO in 12 months. Ike has also done well. SM Energy recently grabbed a bunch of acreage in this area too.
I was responding to your comment above about Permian production… “I doubt there has been a new area or “play” discovered,”
There are many other developing plays in the Permian, some are applying modern completion techniques in older existing plays and some are extensions or improvements on newer trends. Others are more wildcat in nature.
I pointed the recent success in the old Dean because these are some of the best Midland Basin well results and they are very recent and have meaningfully contributed to Dawson County’s production. Dawson has increased over 500% the past few years and is continuing to ramp up quick thanks to these new 2,000 BOPD wells in the Dean. Countywide, all wells made about 6,000 BOPD in early 2020 and recently hit over 35,000 BOPD in March, 2024. lots of permits and DUCs out there too, so plenty of inventory for more growth to feed on.
just giving you some other data points to help explain the resilient continuing rise in Permian production.
Gungagalonga,
Ovi mentioned lea and Eddy Counties in particular. The link below shows some of the less well known formations in Lea and Eddy Counties. Note the Dean Formation has not been exploited in those counties. These formations constitute about 37 kb/d of 1849 kb/d produced in the Permian Basin in Eddy and Lea counties as of December 2023.
https://public.tableau.com/shared/F3P53NFQM?:toolbar=n&:display_count=n&:origin=viz_share_link&:embed=y
Ohio is pretty sensitive to drilling (low base production, high decline rate). So, you could see it drop (and we have seen it drop) when a couple rigs (oil or natty) pull out. The converse of course, also.
It’s also pretty sensitive to both the price of oil and natural gas. There is a very small part of the state that really has oil-directed drilling (regardless of natty price). Much more of the state has wells that truly need a combination of oil/gas favorable prices. I.e. there are some natty wells that get carried by lease condensate. But also some lease condensate than can almost be thought of as “associated oil” from gas drilling. But really both prices matter.
What all that means is that if we have a warm winter and a big drop in natty prices, oil volumes could drop because of low natty price support. The reverse is true of course also. I doubt the impact either way is felt in the winter. The App has limited out of basin transport, so the local prices can deviate from HH, a fair amount. This means local demand in winter supports prices in winter (at the OH tollgates). But you could have something happen in spring.
It’s important to understand also that OH oil tends to be very light (above 60 API gravity). And as such gets a several dollar haircut versus the 40-45 gravity that many mid-streamers price the best. It’s still “oil”. But…
I wonder what is going on in MT. I thought the bloom was off that rose several years ago. But something has to have happened (perhaps technology improvement) to make parts of the MT play attractive again.
I mean, you would expect it to be in slow decline. But that’s not happening…the opposite.
It’s not huge (neither is OH). But still interesting to analyze.
Nony,
Perhaps there is a lack of good drilling locations remaining in the North Dakota Bakken/Three Forks and companies have shifted their focus to the Montana side of the border. A pretty small move though, about a 30 kb/d increase over a 3 year period so roughly an annual increase of 10 kb/d, at the national scale (or for a large producing state like Texas) this would be statistical noise.
The increase seems to coincide with the BLM restarting Federal leases around April 2022, this may simply be coincidence.
https://montanafreepress.org/2022/04/19/blm-resumes-oil-and-gas-leasing-montana/
More Iran sanctions and “drill baby, drill”: Oil market’s future is still uncertain under Trump
– U.S. oil producers are looking forward to less regulations on crude production under a Donald Trump presidency, meaning higher oil supply and consequently lower prices.
– But it’s not that straightforward: Trump has also vowed to put more sanctions on Iranian and Venezuelan barrels, meaning the global market could become tighter, potentially boosting prices.
– At the same time, the increase likelihood of trade wars under Trump could dampen global economic growth and slow oil demand.
Trump expressed his enthusiasm for increased U.S. oil production while giving a speech from the Republican campaign headquarters in Florida on Wednesday, just hours before his victory was confirmed. He made a reference to Robert F. Kennedy, Jr., the independent candidate who he said would become a part of his team.
“Bobby, stay away from the oil, stay away from the liquid gold!” Trump said in a joking tone. “We have more than Saudi Arabia and Russia.” Kennedy is known for his history of environmental activism.
What I didn’t know, but many of you do know is this little tidbit
“If the Trump administration opens up federal leases for oil and gas, Federal lands would get 25% per barrel of revenues. You will have a lot of trouble finding an oil company that can make money at $52.50 per barrel with what they have left from a $70 barrel,” Smead said in emailed notes. “The only thing that will cause drill baby drill to happen is higher oil prices based on these margins.”
“Drill baby, drill is going to run into the energy vigilantes,” he added. “Now that equity investors in the energy business know what free cash flow looks like they won’t give it up. They will allow capital expenditures to go up over their dead body.”
https://www.cnbc.com/2024/11/06/oil-markets-future-still-uncertain-under-donald-trump-after-election-win.html
25% is high, but it’s not crazy high. There have been competitive auctions for large leaseholds, during booms, that got such royalty rates. The traditional stereotype is 12.5% (1/8), but a lot of shale has been higher. I remember asking Enno about this a long time ago. Forget the exact play and time, but it was something like 18% average (in the Bakken, I think).
So, really you’re differentiating the 25% from some alternate rate (12.5 or 20 or whatever). So it’s not like 25% versus 0%, for comparing activity. Also, obviously bonus will be lower if royalty is set at 25%.
I’d expect remaining packages in sweet spots (e.g. center of the Bakken) will get bids. And then there’s areas (north Divide, e.g.) that might not get activity even at zero royalty. But there’s a lot of Federal land. There will be some packages that attract interest in the Bakken and the NM Permian.
Nony,
Also note that on Federal land there may not be state taxes and taxes plus royalty levels are often about 28% on average in tight oil plays, so this 25% rate may actually be less than the royalty plus tax levels on private land in a state.
https://edition.cnn.com/2024/11/08/politics/doj-charges-three-iranian-plot-to-kill-donald-trump/index.html
Iranian plot to kill Trump
“the anxiety of the electorate “comes from the fact that the stupidity of their leaders is so much greater than their own.”
Dennis,
“As of August, production rose even though the rig count continues to fall. This is a clear indication that some significant improvements have been made with drilling technology and possibly fracturing.”
Or, it could be that the number of rigs running, lagged for seven or eight months, is not always the best indicator. If you take the rigs off, the trend up and to the right seems a little steadier now than it was a two months ago. I also think the Matthorn starting linepack in August may be part of the reason for the oil increase.
DCLonghorn.
You may be right that rig count alone does not tell the whole story, DUC count is also part of the story (but I don;t think the EIA estimates of DUC counts are reliable.) Yes more natural gas pipeline capacity may help, but it may be too early to evaluate that currently.
It seems something has changed on horizontal oil rigs vs C plus C output in Texas and New Mexico since early 2024. The Horizontal oil rig count has been shifted forward by 8 months to account for the delay between the start of drilling and start of production, perhaps a higher rate of use of DUC inventory has occurred, not clear what the explanation is. The data for Texas and New Mexico is EIA data for C plus C production and horizontal oil rig count data is from Baker Hughes for the states of Texas and New Mexico combined (all basins within each state).
Over the August 2022 to August 2024 period the annual rate of increase for Texas and New Mexico’s C plus C output was about 431 kb/d, similar to the annual rate of increase over the Jan 2023 to August 2024 period of 420 kb/d.
For previous 2 year period (Aug 2020 to Aug 2022) the annual rate of increase of TX and NM C plus C output was about 656 kb/d, so the rate of increase has been falling and I expect this to continue (maybe to 250 kb/d from Dec 2023 to Dec 2025).
“The United States chose Donald Trump in all his ugliness and cruelty, and the country will get what it deserves.”
And Putin will get what he wants. Seeing Trump and Musk bending the knee to that tinpot dictator is pretty depressing.
https://aspofrance.org/2024/11/07/middle-east-crude-oil-production-and-forecast-jean-laherrere-patrick-brocorens-15-octobre-2024/
Laherrere’s updated projection on ME oil.
Just beware that Laherre has a very bad track record.
He think every declining curve will continue to go down, inexorably. Every increasing line will turn down in months. This despite the clear evidence from history, that (sometimes) declining curves can rebound up. Or that (sometimes) increasing lines can continue up for a several years.
See here: http://aspofrance.viabloga.com/files/JL_MITParis2014long.pdf
1. “The recent oil boom since 2010 is really a boom with short life. The USL48 crude oil production has peaked in 1970 with 3.5 Gb per year and it will peak again this year or next at 2.5 Gb, with a sharp decline down to 1 Gb in 2025 and to 0.3 Gb in 2040 and to 0.15 Gb in 2050.” (page 9)
Yeah…how did that work out? According to him, US should be doing 3MM bopd this year. We are actually doing in excess of 13!
2. He also says (page 9, within figure) “recent EIA data are overestimated, extrapolating past data”.
How often have we had that sort of ‘EIA is overestimating’ cope from the peak oilers? That sort of thinking is catnip for them. In reality EIA has been very good with actual production reporting (not forecasts, reporting), with small revisions and about as often low as high. Here, Laherre’s copium resulted in him making a peak call that was actually less than the history (at the time)!
3. See also page 17, figure 23 where he predicted current ND production would be less than 0.1 MM bopd.
In fact, we are doing in excess of 1.1 MM bopd!
Net/net: The guy has a really bad history. He relies on a method (Hubbert linearization) that is prone to always making dramatic peak calls…and has a very poor predictive history.
———–
Add onto the above that he has miserable English and typography. The articles are a mess. The guy has “emeritus disease”.
https://www.smbc-comics.com/index.php?db=comics&id=2556#comic
Ovi, thanks for your work. The Howard County oil production versus GOR chart is a beautiful thing. A 50% annualised decline once it is out of its bounded GOR phase. Which is presumably due to a lack of drilling locations.
David
Thanks
The drop shown in that graph reflects the uncorrected Tx data. Attached is production curve for Howard with a projection from last month. As noted in the post the July corrections were too great and the projection methodolgy cannot cope with such large older and random corrections
The attached chart shows the original Tx data for June and July and the projection. Note the small changes between the June and July Tx data after July 2023. The red graph is a more realistic production graph for Howard.
I looked the rig count for Howard and it has been running between 9 and 11 for most of 2024. I think the drop is due to the completion of more Tier 2 drilling sites after July 2023.
Howard Count Horizontal Oil Rigs shifted forward by 8 months, from July 2023 to Jan 2021 the horizontal rig count fell from 20 to 10 a drop of 50%. Might explain some of the drop in output which started around July 2023.
https://blog.gorozen.com/blog/us-natural-gas-production-is-plummeting?utm_campaign=Weekly%20Blog%20Notification&utm_medium=email&_hsenc=p2ANqtz-_lLV49_tYJBPqfNumZPNlmGgKHLeVpsDq3OwkeNAk_H9pLD5dBB-oz8QzBf3MJyeUp7AUjcqOnMXC_31lgGf5hXtrw6g&_hsmi=333003413&utm_content=333003413&utm_source=hs_email
Texas and New Mexico horizontal Oil Rig Count (right axis) and TX and NM C plus C output (left axis).
Permian horizontal oil rigs zero scaled, since 2023 mostly in the 300 to 330 range. Correction rig count in this chart was shifted 7 months forward from Jan to August. Subtitle on chart is incorrect.
New Mexico and Texas C plus C output where most of the increase (maybe 95% over the period in the chart) comes from the Permian basin, also zero scaled to compare with previous chart.
Conclusion is that horizontal oil rigs in the 300 to 330 range leads to a fairly steady increase in output. The number of horizontal oil rigs has decreased by about 10% with little affect on output.
Horizontal Oil Rig Counts Lea, Eddy, Midland, Martin, and Howard Counties combined with zero scaled chart. Counts shifted forward in time by 8 months to account for delay between dstart of drilling and first oil output as suggested by Mike Shellman.
In 2023 the average “shifted” horizontal oil rig count was about 184 rigs for these 5 counties in the Permian Basin. For the most recent 5 weeks (October mostly) the count was 157 and for the weeks in August (most recent output data) the count was 163 horizontal Oil rigs, this August rig count was about 11% below the average 2023 level.
The Rig Report for the Week Ending November 8
– US Hz oil rigs rose by 3 to 433. They are down 26 rigs from April 19 and are up 6 relative to their recent low count of 427 on July 24th. Of the 3 rig increase, 2 were added in Oklahoma and 1 in Wyoming.
– The Texas rig count was unchanged at 234.
– The number of New Mexico Permian rigs were unchanged at 92 while the Texas Permian added 1 to 192 for a total of 284.
– In New Mexico, Eddy and Lea’s rigs were unchanged at 43 and 49 respectively.
– In Texas, Midland and Martin rigs were unchanged at 26 and 27 respectively.
– Eagle Ford rigs were unchanged at 40.
– NG Hz rigs were unchanged at 86.
Frac Spread Report for the Week Ending November 8
The frac spread count decreased by 5 to 227. It is also down 41 from one year ago and down by 45 spreads since March 8.
Could this low spread count be an early beginning of the typical Christmas break slowdown speeded up due to $70/b WTI?
In the wake of the election Von der Layen apparently said purchase of more LNG from the US into Europe would be an affair likely growing. But with fracs declining I guess VW and others would still pay quite a bit for their juice in that case even later?
https://www.zerohedge.com/commodities/eu-bows-trump-we-could-buy-more-american-lng
https://www.nordpoolgroup.com/
Disclaimer, no position, just watching,
I suppose that, with this slow decrease of frac spreads, production will continue to increase.
Jean-Francois Fleury,
The problem with the frac spread count is that it is for all frac spreads in the US for both oil and natural gas, it is possible that much of the falling frac spread count is from natural gas focused areas, we don’t really have the data needed to make sense of this.
OK, thanks for the precision.
Jean-Francois,
Also keep in mind that Frac spreads may be being used more efficiently.
In chart below I consider both oil and gas horizontal rigs divided into Permian basin and “other” basins (everything except Permian in US on land), I shift the rig count forward by 4 months on the assumption of an 8 month lag between start of drilling and start of production that 4 months is the drilling phase and 4 months the fracking phase. It is no doubt much more complicated than this, any oil pro reading can suggest better assumptions, this is very rough indeed.
It may be that the frac spreads operating are roughly proportional to the shifted rig count presented, just a guess due to lack of better information.
Frack Spreads in Permian and other basins assuming that frack spread proportion is the same as the horizontal rig count proportion that has been shifted forward by 4 months.
For chart above the period covered is week 1 of November 2022 to week one of November 2024 (with rig count shifted forward by 4 months).
Took a closer look at the core counties of the Permian Basin. In New Mexico there are two Eddy and Lea and in Texas there are 10 Andrews, Glasscock, Howard, Loving, Martin, Midland, Reagan, Reeves, Upton, and Ward. Loving, Reeves, and Ward are in the Delaware sub-basin along with Lea and Eddy Counties and the other 7 counties are in the Midland sub-basin.
Over the August 2022 to August 2024 period (25 months) all of the increase in Texas and New Mexico C plus C output has come from these 12 core Permian counties.
Horizontal oil rig count for 12 Permian Core counties (as listed in previous comment) with rig count shifted 8 months forward to account for average time from start of drilling to first oil production from the well. Note that about 90% of Permian basin output of C plus C is from these 12 core counties.
The recent (August after shifting 8 months forward so Jan actual) 5 week average HOR count is about 11% below 2023 average.
We can also compare permian core to non-core using Permian estimate from STEO as shown in chart below where Permian “other” is the non-core counties which is Permian STEO estimate minus my Permian “core” estimate based on RRC and EIA 914 data.
For Horizontal Oil Rigs (HOR) for Permian core vs other Permian counties we have the following chart. Rig counts shifted forward by 8 months.
Dennis
If we add another line representing actual oil production does that give us a direct measure of the increase in drilling/fracking efficiency?
Old Chemist,
I don’t really understand your question. I have shown lines with C plus C output for the Permian core counties. In my view this represents actual oil output as best as I can estimate with currently available data. Every reported number for output is always an estimate of “actual production”. If the estimate is roughly correct and output has continued to increase at roughly the 2023 rate while rigs operating has decreased by about 11% suggests roughly an 11% increase in rig efficiency, if we assume DUC inventory is unchanged, we don’t have good estimates on DUC counts since Enno Peters left Novi Labs, the last update was April 2024 with data through Jan 2024. In 2023 the Permian DUC inventory decreased by about 191, but we don’t have data fro 2024, except by the EIA and I don’t believe those estimates. Note that there were about 5822 wells completed in the Permian in 2023, so 191 DUCs is only 3.3% of all wells completed. No idea if more or less of a decrease in DUC inventory in 2024.
Dennis
You answered my question pretty well. An industry wide productivity improvement of that magnitude over all the major basins ( Baytex recently claimed an 8% year over year improvement in the Eagle Ford operations) for a well established, mature industry, is about as rare as a five legged horse.
I wonder if the improvement simply consists of sucking the same volume of oil out of the ground more quickly, or if it will increase the total recovery in some way?
Old Chemist,
These “efficiency” improvements simply reduce the cost to produce the oil so that production is more profitable, recovery factor in recent years (since 2017 or so) for tight oil wells has actually decreased because longer lateral wells have lower EUR per foot of lateral. In short, efficiency tends to go in the opposite direction as total recovery. We are leaving more oil behind today than back when lateral lengths were about 5000 to 7000 feet rather than the 10 to 13 thousand average lateral length of today’s tight oil wells.
FYI, Adapted from this paper by Hallock in 2014
https://www.sciencedirect.com/science/article/pii/S0360544213009420
“Forecasting the limits to the availability and diversity
of global conventional oil supply”
which is a validation of this paper they wrote in 2004
https://www.sciencedirect.com/science/article/pii/S0360544204002385
1. I would be pretty leery of drawing one of those dramatic Hubbert shapes. Incredibly long pattern of them being wrong, especially on the decline side. Basically the twin issues of sunk cost infrastructure and technology improvement end up giving “fat tails”. (It’s the opposite of the Seneca curve that posits even worse than Hubbert.)
1.5. Also, there is an incredible amount of hopium and bias in the peak oilers. Every upwards rising curve must turn tomorrow. Every downward curve cannot reverse (despite all the evidence to the contrary and all the failed peaker predictions. Part of being a shrewd analyst or scientist is to understand and watch out for your own biases. (E.g. I want X to win an election or football game or whatever and thus I “wishcast”.)
2. Hall, et al. are not exactly heavyweights in resource economics analysis. Most of the authors come from the biological ecology sciences. (Hall was a fisheries ecologist.) That doesn’t mean they can’t write something or do analysis. But it’s at least a reason to be a little wary. (Also, they are definitely choosing journals that are not that great, not very strong in economics or in oil and gas.) Like I laughed when ACS had a session on oil forecasting…and it was full of David Hughes and the like. Or when I see failed physicists misapplying random transport equations to economic trend analysis.
Just because someone is good in X doesn’t mean they know Y. Of course might have something useful. But if anything a lot of knowledge is domain specific. And I’m as wary of physicists spouting off on chemistry (don’t get me started on the Ph.D. idiot trying to make HTSC and not doing the stoichiometry correctly) as I am on baseball coaches talking about hockey players.
See: https://www.smbc-comics.com/index.php?id=1776#comic
What it means is that when I see SUNY ecology profs writing about oil reserves/forecasts, I don’t give them reverence…more like ADDED WARINESS. 😉
3. I’m still reading through the papers. The 2004 one is very bad in terms of defining “conventional” or describing the data sources that will validate their predictions. The 2014 one is a lot better…although there is a little bit of retconning in it. (“clarifications.”)
This is the earliest source to that figure. It didn’t directly come from the paper but was adapted by a blogger, AFAICT
https://x.com/blair_fix/status/1325434166247354369
https://economicsfromthetopdown.com/2020/11/16/peak-oil-never-went-away/
Like many peak oil plots, it’s wrong but correct, or in the words of the George W. Bush National Guard memos. “fake but accurate”.
BTW, Yes to fat-tails as the book is full of examples
That stuff is really hard to read. It’s drifting into “not even wrong” territory. Sort of reminds me of reading certain climate deniers. I’m fine to read alternate views…but at least present them clearly! Wrong and clear is OK. Wrong and hard to process is a waste of my time!
1. The 2004 paper never seems to define “conventional”. I actually did a find text search and looked at all 12 instances of that word in the text. As well as skimming the paper. There ought to be a definition and a clear discussion of what is in/out of scope.
1.5 And then if (I donno tar sands stuff) is out of scope, there should also be a clear discussion of why. (Like…I know it doesn’t use rigs the same way…but it does produce a lot of motor diesel…so economically, for consumers do they care?)
2. The 2014 paper is better as they do give a (now retroactive) definition of conventional, for use in the 2004 paper:
“conventional oil was assumed to be any oil produced through a well-bore via primary, secondary or tertiary means that is greater than 17.5° API (American Petroleum Institute) gravity, from well-bores less than 500 m below sea level, and not from remote polar areas [6], [24]. We modified this definition to include oil produced from Alaska’s North Slope.”
a. So…it seems like the real desire was to separate out tar sand stuff. Which the “well-bore” would do.
b. And then I guess the 17.5 would help cancel out some extra heavy oil that does still go through well bores (especially in Vz).
c. However, note that California Kern River crude is ~17 API. So, a very well known grade of crude that has been around and signficant for 100 years is also “unconventional”.
d. I don’t really even understand why they make the depth distinction. Why is the distance versus sea level important? And are they saying the shallower oil or deeper oil is excluded. And then why is seal level the reference? Like a 3000 foot deep deposit in Denver would be excluded? (if they are trying to exclude shallow stuff? Since it’s above sea level?) But a 600 foot well in Long Beach would be OK? And why? Who cares, really?
e. I don’t really even get why the polar distinction is made. Very little oil comes out of these regions anyway. And then they allow to count the North Slope. Are they protecting themselves from some big find in Labrador?
f. Note that this definition would seem to INCLUDE TIGHT OIL (Bakken, Permian, Eagle Ford, etc. shale). After all that oil is lighter than 17.5 AND comes through a well bore (by primary production).
3. Then, within the 2014 paper, it seems like a dog’s breakfast and a tautology of how they define production of conventional versus unconventional. They don’t really have good data sources and seem to to be extrapolating relative amounts forward from 2001!
“We used the United States EIA’s (Energy Information Administration) dataset of annual production of crude oil and lease condensate (hereafter referred to as “Crude oil”) as the starting point for deriving empirical conventional oil production for nations and the world [25]. For those nations without identified unconventional oil production, we used the EIA dataset as the empirical data without adjustment. For those nations that began producing unconventional oil after 2001, the unconventional production was subtracted from the EIA data in each year between 2002 and 2012 and the resulting data was used as the empirical dataset without further adjustment. For most nations that started producing unconventional oil prior to 2002, we began derivation of the empirical data by subtracting unconventional production from projects beginning after 2001 from EIA’s data. The resulting dataset was then normalized by the ratio of the Aleklett and Campbell [6] year 2001 estimate of oil production to that reported by the Oil and Gas Journal for 2001 [26]. We assumed that Aleklett and Campbell [6] removed all unconventional production volumes in deriving their 2001 estimates, based on the data at their disposal in 2002 [26], [27]. In some nations, however, we subtracted slightly more unconventional oil production in 2001 than did Aleklett and Campbell – based on identification of additional unconventional streams (Colombia, Ecuador, Oman, Mexico, and the United States). Starting productions (2001) for these nations were within 10% of the Aleklett and Campbell-derived values. Details of methods used to estimate the volumes of unconventional oil to subtract for certain nations are described in Appendix A. Table A.1, Table A.2 list the sources of data for unconventional oil projects, by nation (available in the online version or from the authors upon request).”
Like I don’t even know what they hell this is…but it sure sounds like a lot of fudge factors, many of them coming from fellow peak oilers. Not a clear government data source. (You know if you just looked at all oil and didn’t play this “unconventional” game it would be a lot easier to get clear data!
And probably more economically meaningful since the “unconventional” goes into the same markets and serves the same economic functions that they find important for “conventional”. For that matter, it’s amazingly ironic that heavy crude from Canada and Venezeula is such a great blend with LTO from shale!
4. I tried reading that blog…but it was an amateurish mess. Like people who think QM is about consciousness. Sorry…no…it’s about spectral lines of atoms where the electrons jump between energy levels! 🙁 I can’t tell how he’s drawing that oil curve. Is he excluding or including LTO for instance? Oh…and it conveniently shows declines continuing after Covid. When instead, we’ve clearly had a general recovery!
Chart below has Decline 50% of URR with 5% production growth and low demand growth with the average of the mid-EUR and low-EUR scenarios compared with the shock model for conventional oil as defined by USGS (non-continuous resources), shock model forecast starts in 2024, prior to that the 2013 to 2023 data matches EIA data. Models are fairly similar through 2025. Shock model assumes a URR for conventional oil of 2800 Gb. Possible this is too low, USGS estimate about 3000 Gb.
Data from link below
https://ars.els-cdn.com/content/image/1-s2.0-S0360544213009420-mmc1.xls
Thanks Paul for a dose of reality, it’s sometimes easy to get lost in the ever changing estimates of URR, it’s 2800 Gb, or it’s 3000…or maybe it’s 4000+…however the conventional Hubbert curve tells a very different story.
Conventional peak in ~2005 means that recoverable conventional oil has a URR of 1950 GB, since 1500 GB have been produced there is only 450 GB left…
The top 10 countries holding the remaining ~400 GB of oil include those with 10% or more (Russia, Saudi Arabia, USA, Canada, and Iraq), combined those 5 have 2/3 of remaining oil, while China, Iran, UAE, and Brazil have between 5-8% each…Kuwait in 10th position and Qatar in 11th…
For a portion of these, annual 2P losses have been 4% on average while 1P losses have been accelerating from 6% in 2017 to more than 10% at present…US tight oil boom may have protected the world from peak oil for 10+ years but that is quickly coming to an end
THIS is the Most Likely estimate in existing fields and doesn’t include noncommercial volumes or uneconomic/undecided amounts…
Kengeo,
Conventional oil output (coinciding with USGS definition for non-continuous oil) peaked in 2016 at a cumulative output of 1273 Gb. If we make the (often incorrect) assumption that the peak occurs exactly at 50% of the URR this suggests a conventional oil URR of 2546 Gb, often the peak occurs at cumulative output of less than 50% of URR, for my scenario it is about 45%. As of the end of 2023 about 1450 Gb of conventional oil had been produced. Your estimate of 1950 Gb for conventional oil is at least 850 Gb too low.
The 2P estimate does not include new discoveries, contingent resources or reserve growth, this is a common mistake that people make.
“US oil industry eagerly awaits Donald Trump’s deregulatory push…
“Among the changes the industry expects are the abolition of rules on tailpipe emissions designed to push motorists towards electric vehicles, as well as expanded access to hydrocarbons through increased leasing in the Gulf of Mexico and on public lands, and the dilution of protections for endangered species.”
I don’t know if the new admin will be able to push the needle on domestic oil production very much. Could stimulate some demand by topping off the SPReserve.
Maybe could push coal combustion harder, but certainly didn’t do anything on that in his first term as he had promised.
Could reverse progress on grid modernization, but I suspect enough people in decision making positions and industry see the grid modernization planning and efforts now underway as strongly in the nations best interest.
Should get the national high level radioactive waste repository built and underway with filling the now 70 years worth of accumulation held in temporary status.
Republicans now control the Senate, the House, the White House and the Supreme Court. There are no checks and balances. It’s unlikely that deregulation will increase production (much). My guess is that the economic crash that Musk is promising will dampen demand.
Trump is hoping to wreck the Chinese economy, but China has been responsible for more than 100% of growth in oil demand worldwide since 2000. Demand and prices are likely to stay low, and that is a much bigger deal than the marginal issue of access to federal land.
Rolland posted a link to Jean LaHerrere’s Mideast crude production forecast. Thanks.
There is another interesting post on the ASPOFrance website. Its by Flavien Rabas “Hydrocarbon production and exports history and perspective. He uses a function of peak sustained production to estimate EUR”S (i think). It is an interesting presentation, but mostly just raises questions. Link https://aspofrance.org/2024/11/12/productions-et-exportations-dhydrocarbures-historique-et-perspective-flavien-rabas-15-octobre-2024/
https://aspofrance.org/2024/11/12/productions-et-exportations-dhydrocarbures-historique-et-perspective-flavien-rabas-15-octobre-2024/
“We don’t need no education”
Our Repug friends are telling us.
“We don”t need no mind control”
it’s just another Thought.
Back to oil and gas, does anyone know the approximate dimensions of effective distance a frac reaches out?
Also, are they orientated now? Thanks.
An updated report on July Non-OPEC and World Oil production has been posted.
https://peakoilbarrel.com/july-non-opec-world-oil-production/
A new Open Thread Non-Petroleum has been posted.
https://peakoilbarrel.com/open-thread-non-petroleum-november-13-2024/