By Ovi
All of the Crude plus Condensate (C + C) production data, oil, for the US state charts comes from the EIAʼs Petroleum Supply monthly PSM which provides updated information up to July 2024.
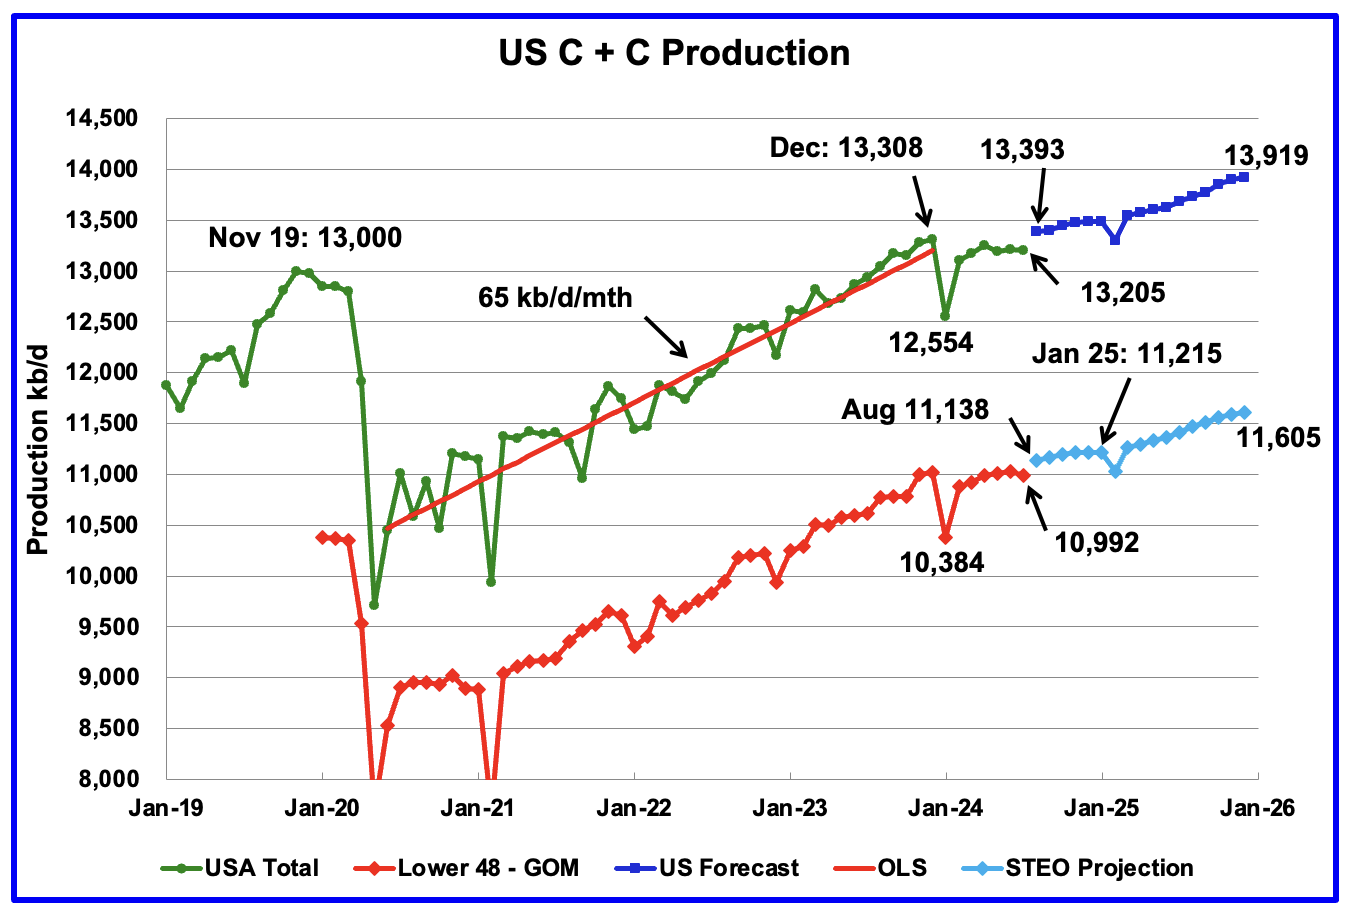
U.S. July oil production dropped by 25 kb/d to 13,205 kb/d. The largest decreases came from Texas, 34 kb/d and North Dakota, 20 kb/d.
US oil production has been essentially flat since September 2023 when it was 13,177 kb/d. July is down by 103 kb/d from the December 2023 high of 13,308 kb/d.
The dark blue graph, taken from the September 2023 STEO, is the forecast for U.S. oil production from August 2024 to December 2025. Output for December 2025 is expected to reach 13,919 kb/d. From August 2024 to December 2025 production is expected to grow by 526 kb/d or at an average rate of 30.9 kb/d/mth.
The red OLS line from June 2020 to December 2023 indicates a monthly production growth rate of 65 kb/d/mth or 780 kb/d/yr. Production going forward is projected to increase at about 1/2 that rate.
The light blue graph is the STEO’s projection for output to December 2025 for the Onshore L48. July Onshore L48 production is down by 38 kb/d to 10,922 kb/d. From August 2024 to December 2025, production is expected to increase by 467 kb/d to 11,605 kb/d.
US Oil Production Ranked by State
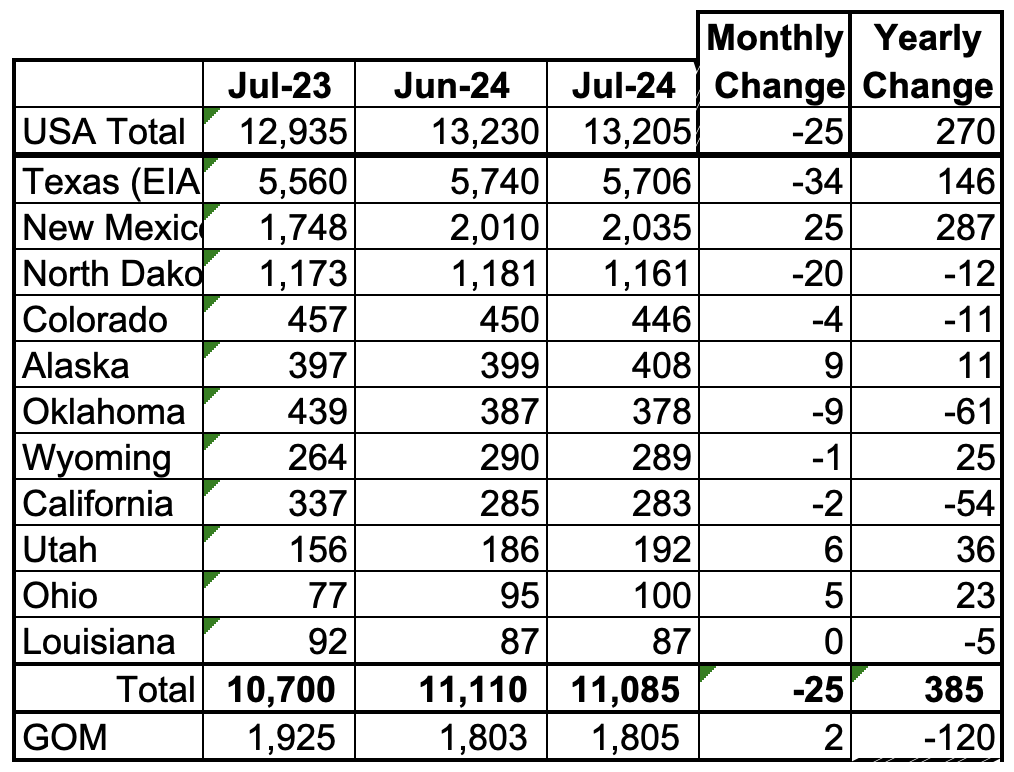
Listed above are the 11 US states with the largest oil production along with the Gulf of Mexico. Ohio has been added to this table since its production approached 100 kb/d in January and exceeded Louisiana’s production. These 11 states accounted for 83.9% of all U.S. oil production out of a total production of 13,205 kb/d in July 2024.
On a MoM basis, July US oil production dropped by 25 kb/d. Note that the top 3 states had an overall MoM decline of 29 kb/d. On a YoY basis, US production increased by 270 kb/d. GOM production increased by 2 kb/d MoM while dropping by 120 kb/d YoY.
State Oil Production Charts
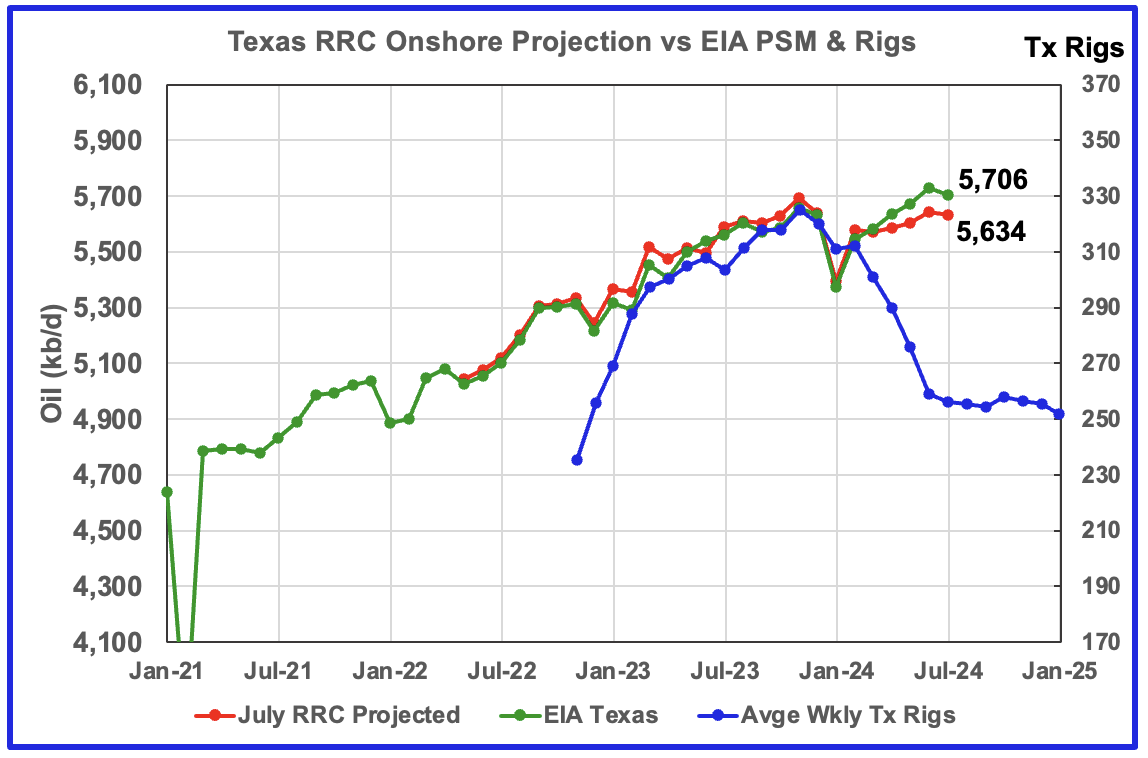
Texas production decreased by 34 kb/d in July to 5,706 kb/d. YoY production is up by 146 kb/d.
The red graph is a production projection for Texas using the Texas RRC reported June and July oil production. The projection uses the cumulative difference between the June and July preliminary production data provided by the Texas RRC. The projection is directionally correct with the EIA Texas data from April until July and both the EIA and the projection show a production drop for July.
For July the projection is low by 72 kb/d. The low production estimate from April to July could be due to a processing delay by the Texas RRC.
The blue graph shows the average number of weekly rigs reported for each month, shifted forward by 10 months. So the 276 rigs operating in July 2023 have been shifted forward to May 2024. From February 2024 to July 2024, the rig count dropped from 312 in time shifted February 2024 to 256 in July 2024. That drop of 56 rigs did not begin to impact production until July 2024. So if production should follow the rig count, Texas production should continue to decline going forward.
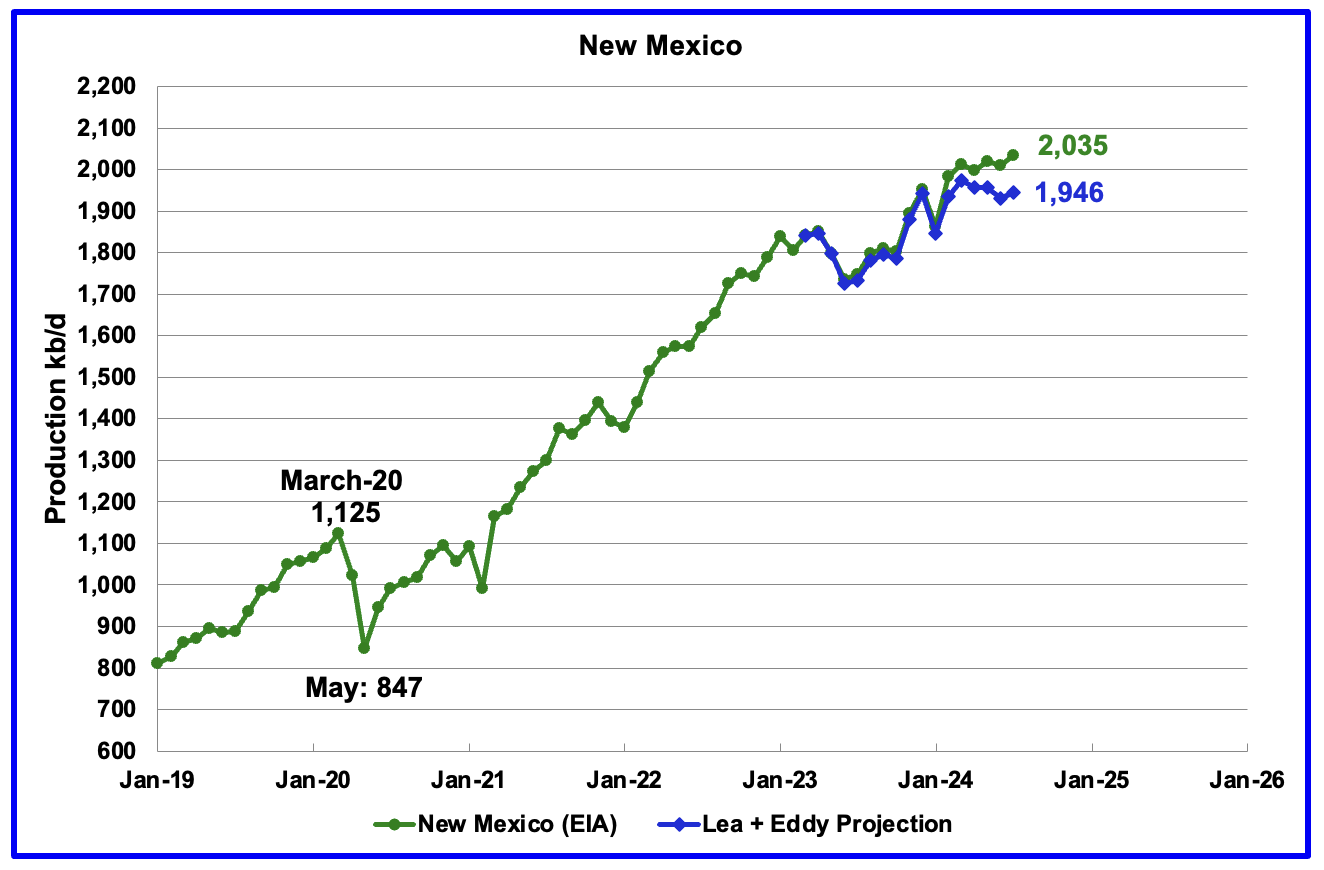
According to the EIA, New Mexico’s July production rose by 25 kb/d to 2,035 kb/d.
The blue graph is a production projection for Lea plus Eddy counties. These two counties account for close to 99% of New Mexico’s oil production. The projection used the difference between the June and July preliminary production data provided by the New Mexico Oil Conservation Division. While last month’s projection was very close to the EIA’s data, a gap has developed in the July forecast. Both show an increase for July but the projection is 89 kb/d lower than the EIA’s forecast. A 1% correction was added to the Lea plus Eddy projection to account for their fraction of New Mexico’s oil production.
Note the methodology used to project New Mexico’s production is the same as that used for Texas.
More oil production information for these two counties and Texas counties is reviewed in the special Permian section further down.
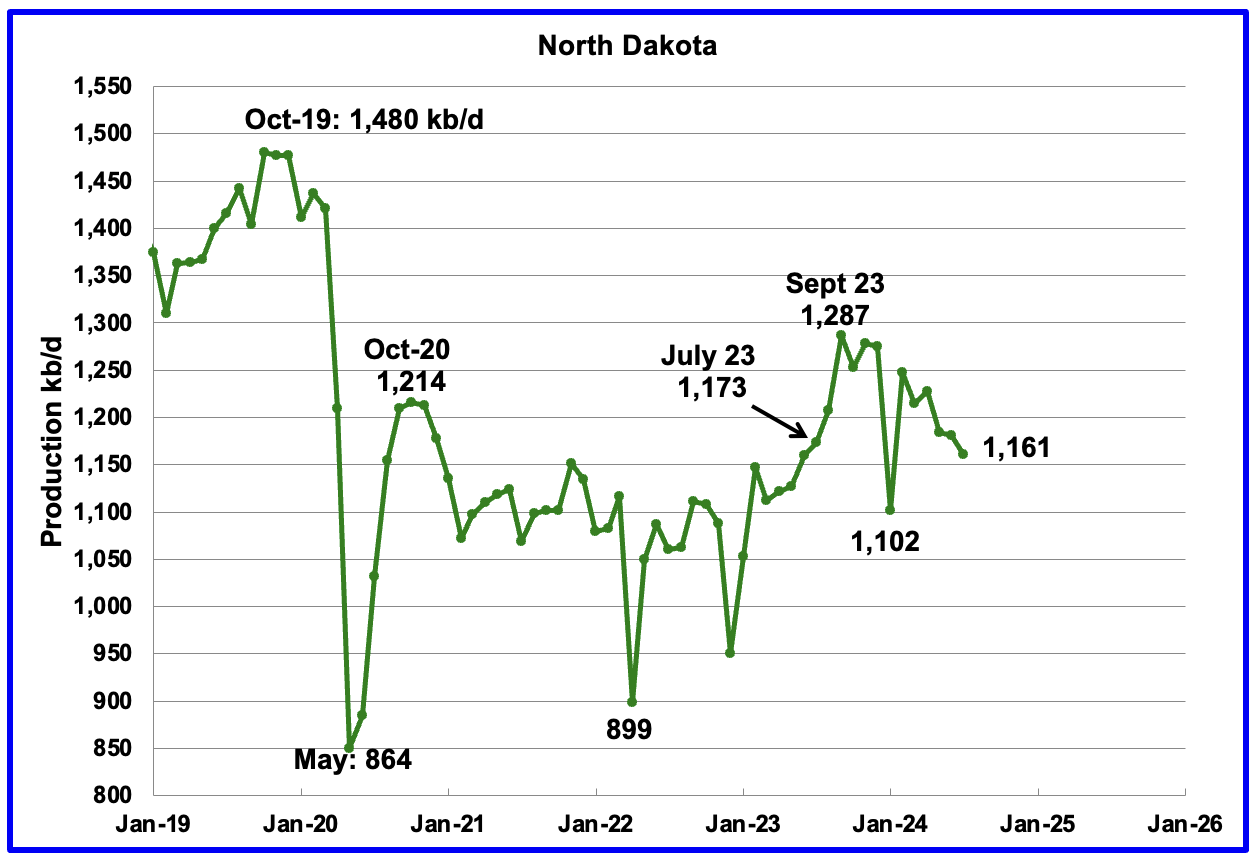
July’s output decreased by 20 kb/d to 1,161 kb/d. YoY production was down by 12 kb/d. The North Dakota DMR reported that oil production dropped by 18 kb/d in July to 1,168 kb/d. Production is down by 126 kb/d from the post pandemic peak of 1,287 kb/d.
According to this article, North Dakota’s oil production drop in July was less than expected because well completions were up from 55 in June to 79 in July.
“We’re at 1.167 million barrels per day, said North Dakota Department of Mineral Resources Oil and Gas Division assistant director Mark Bohrer, in the monthly ‘Director’s Cut’ media briefing. He said the good news is well completions were up — from 55 in June to 79 in July.
“That appears to have slowed the decline a little bit,” Bohrer said. “I hope to see that turn around and stabilize.”
Bohrer said wells permitted in July reached 100, which he said would help oil production once they came on-line. He also said natural gas production was down .9 percent in July, compared with June.
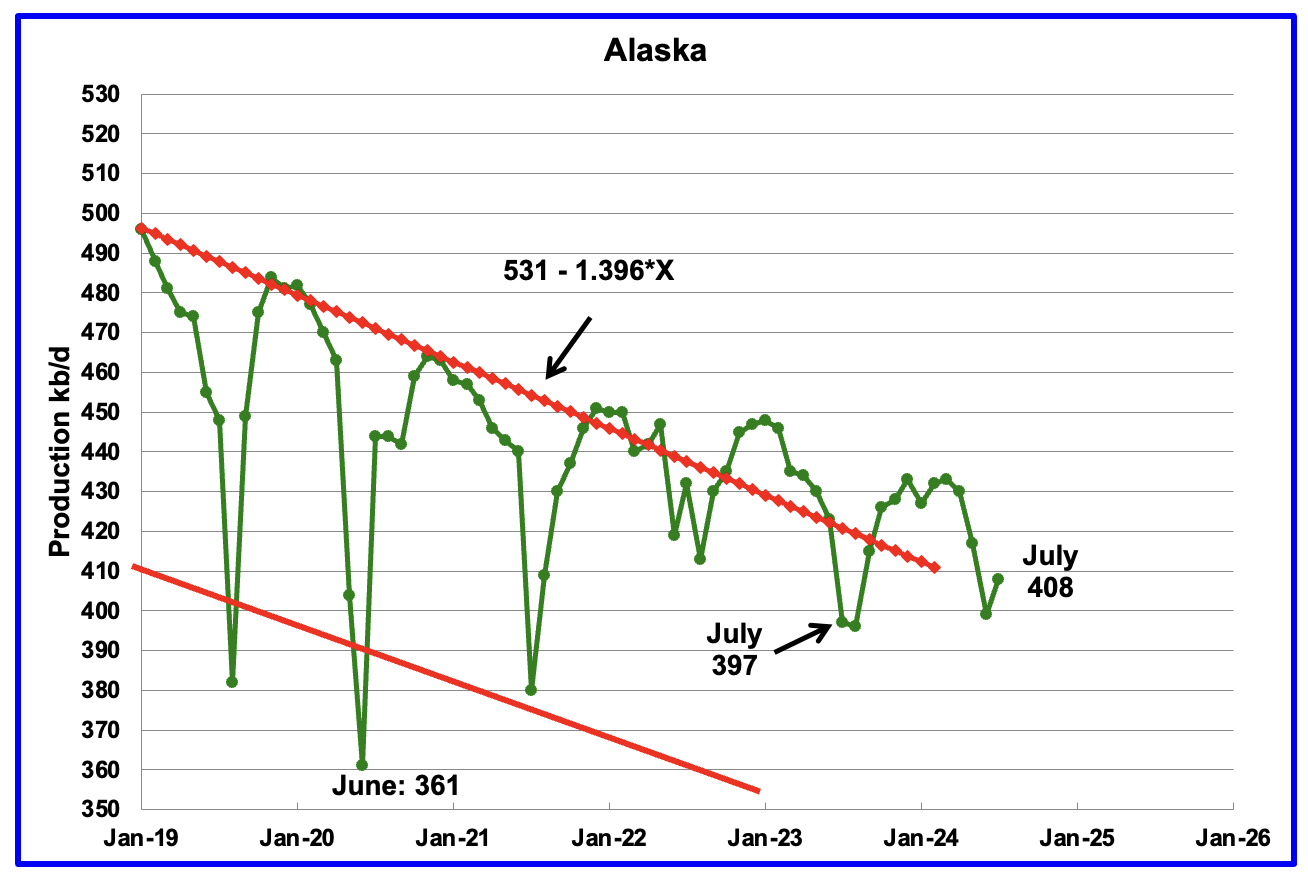
Alaskaʼs July output rose by 9 kb/d to 408 kb/d while YoY production up by 11 kb/d. The rise in production is an indication that summer maintenance is winding down. Typically Alaska’s production drops in the summer months due to maintenance.
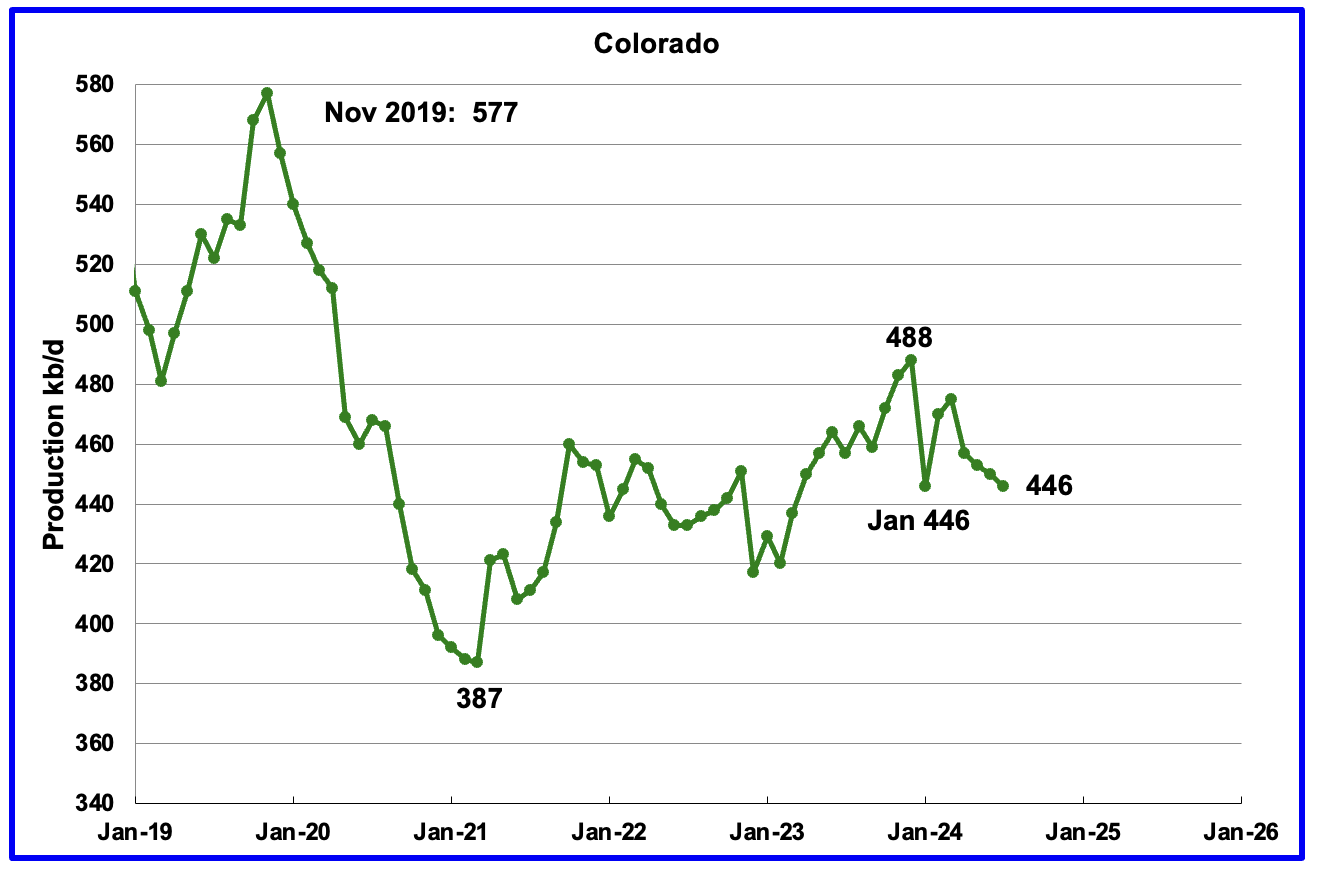
Coloradoʼs July oil production decreased by 4 kb/d to 446 kb/d. Colorado has moved ahead of Alaska to become the 4th largest US oil producing state. Colorado began the year with 12 rigs but has now dropped to 10 during June, July and August and down to 7 in late September.
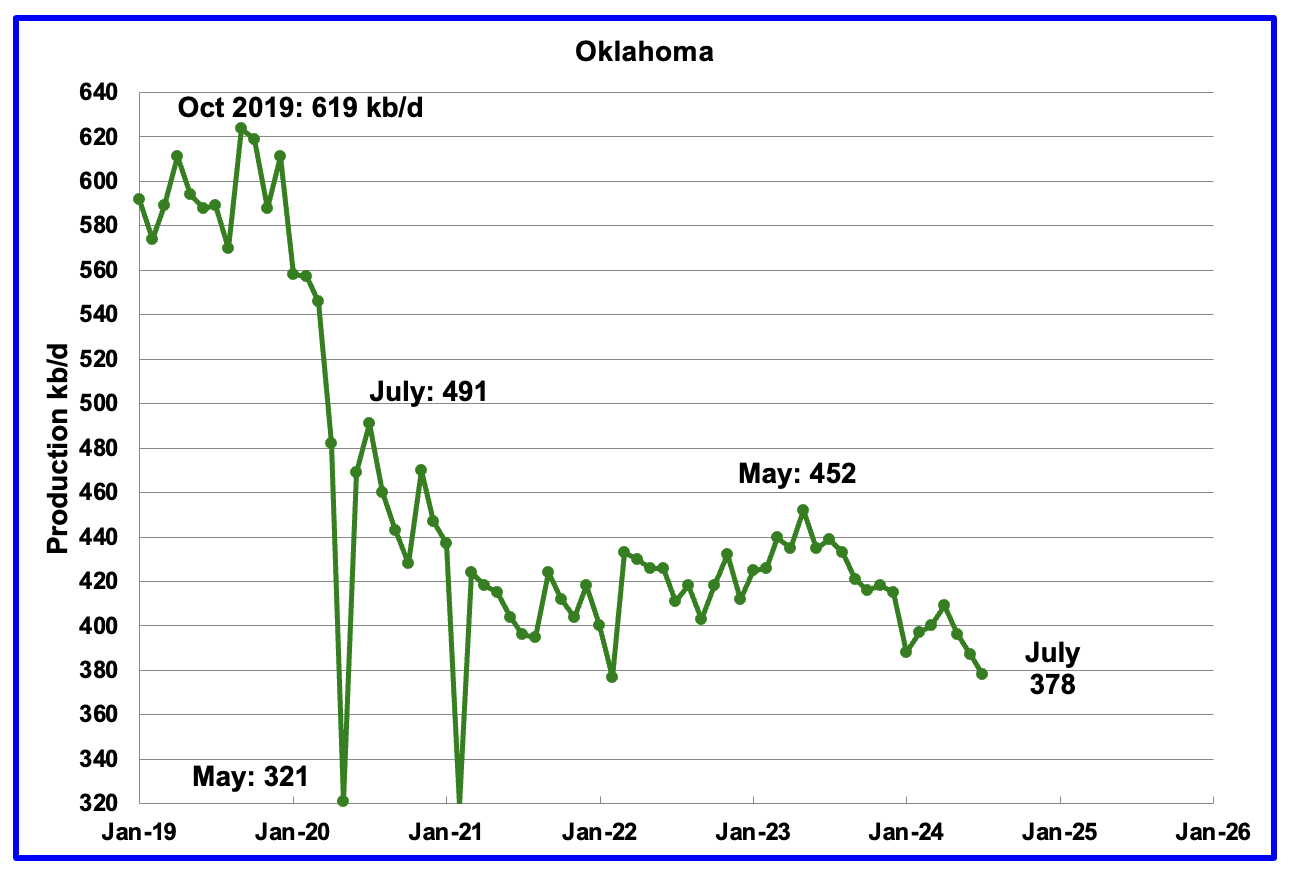
Oklahoma’s output in July dropped by 9 kb/d to 378 kb/d. Production remains below the post pandemic July 2020 high of 476 kb/d and is down by 74 kb/d since May 2023. Output entered a slow declining phase in June 2023.
Oklahoma’s rig count dropped from 40 in May to 30 in July. By the end of September there was an uptick to 41 operational rigs. Will the increase in the rig count reverse the current dropping production trend?

California’s declining production trend continues. Californiaʼs July production dropped by 2 kb/d to 283 kb/d.
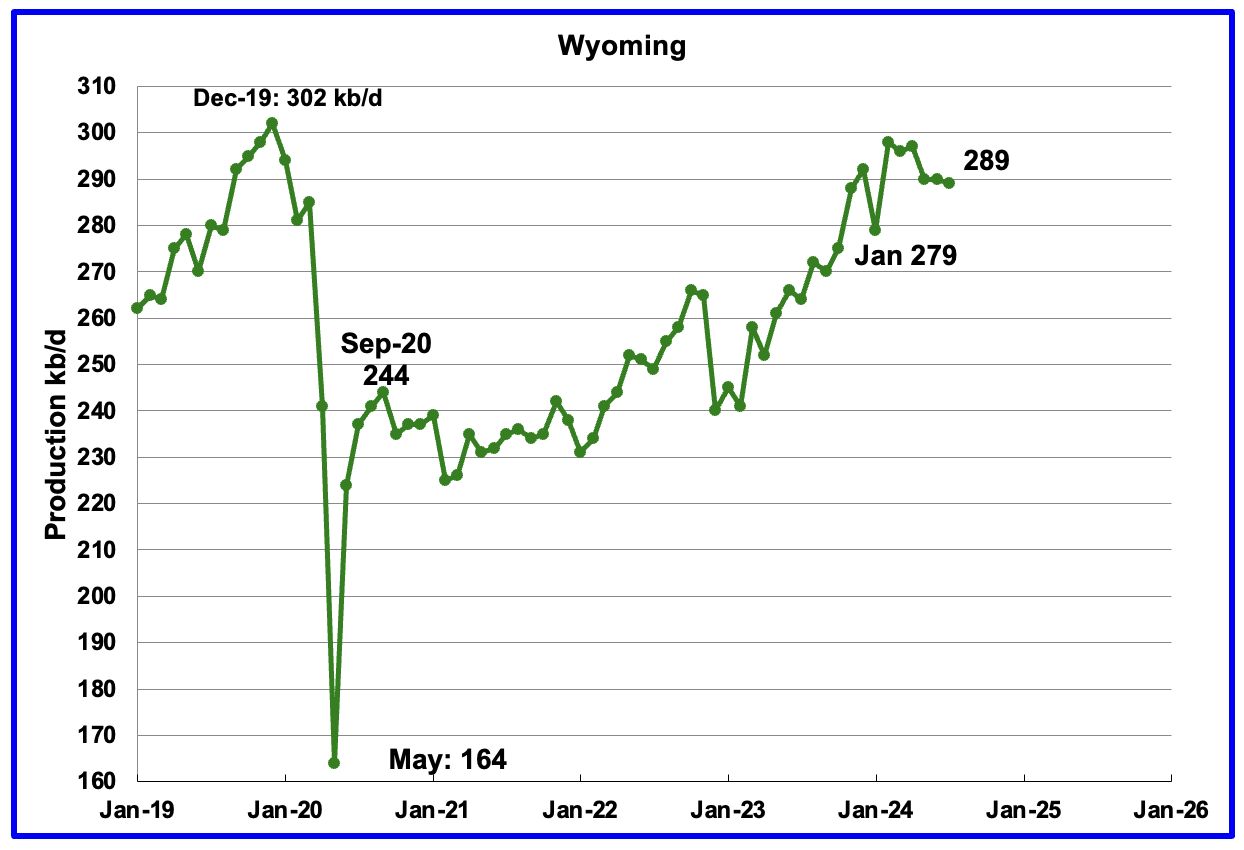
Wyoming’s oil production has been rebounding since March 2023. However the rebound was impacted by the January 2024 storm. July production was down by 1 kb/d to 289 kb/d and may be entering a plateau phase. Note that production has almost recovered to the pre-Covid level.

July’s production increased by 6 kb/d to 192 kb/d. Utah has had 9 oil rigs in operation through out 2024.
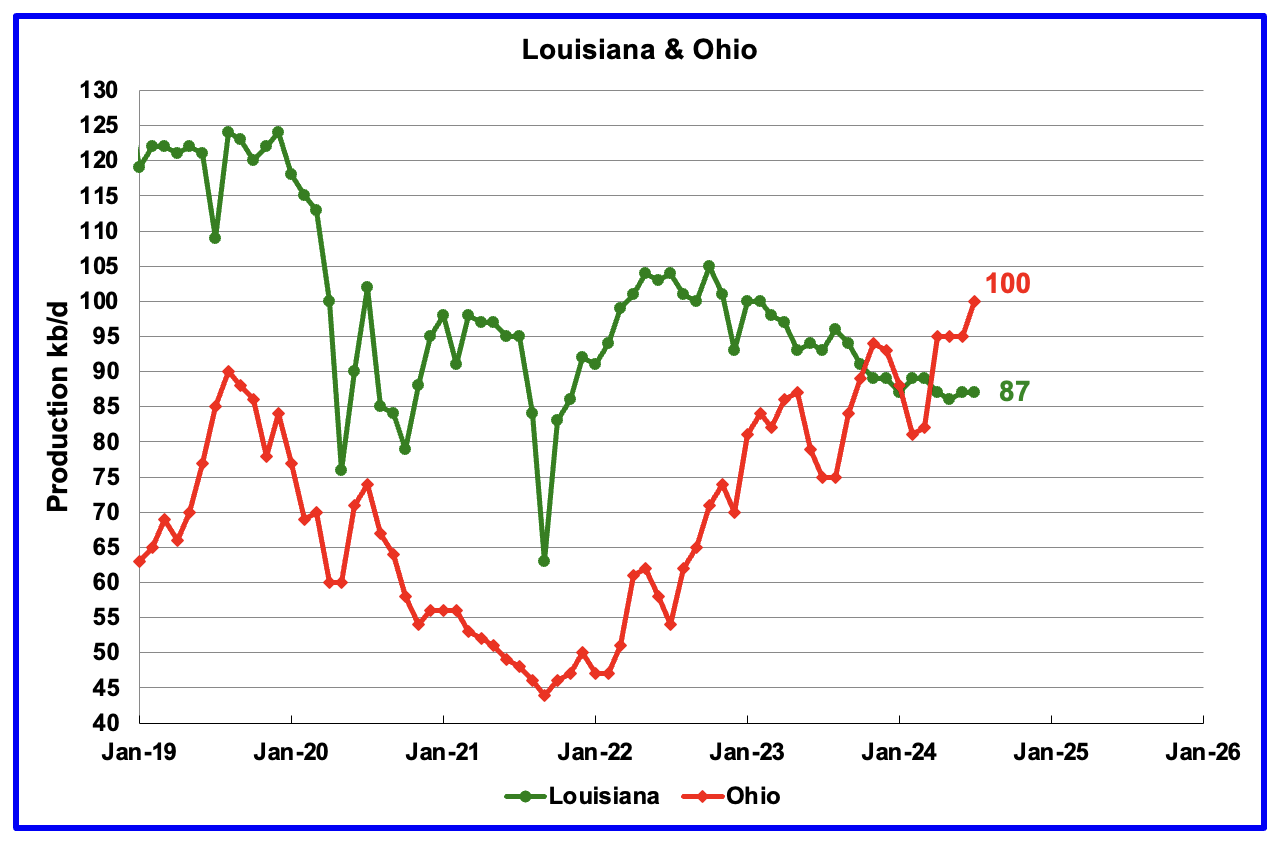
Ohio has been added to the Louisiana chart because Ohio’s production has been slowly increasing since October 2021 and passed Louisiana in November 2023.
Louisiana’s output entered a slow decline phase in October 2022. July’s production was unchanged at 87 kb/d. Ohio’s July oil production added 5 kb/d to 100 kb/d, a new high. The most recent Baker Hughes rig report now shows two horizontal oil rigs operating in Ohio in July, August and September.
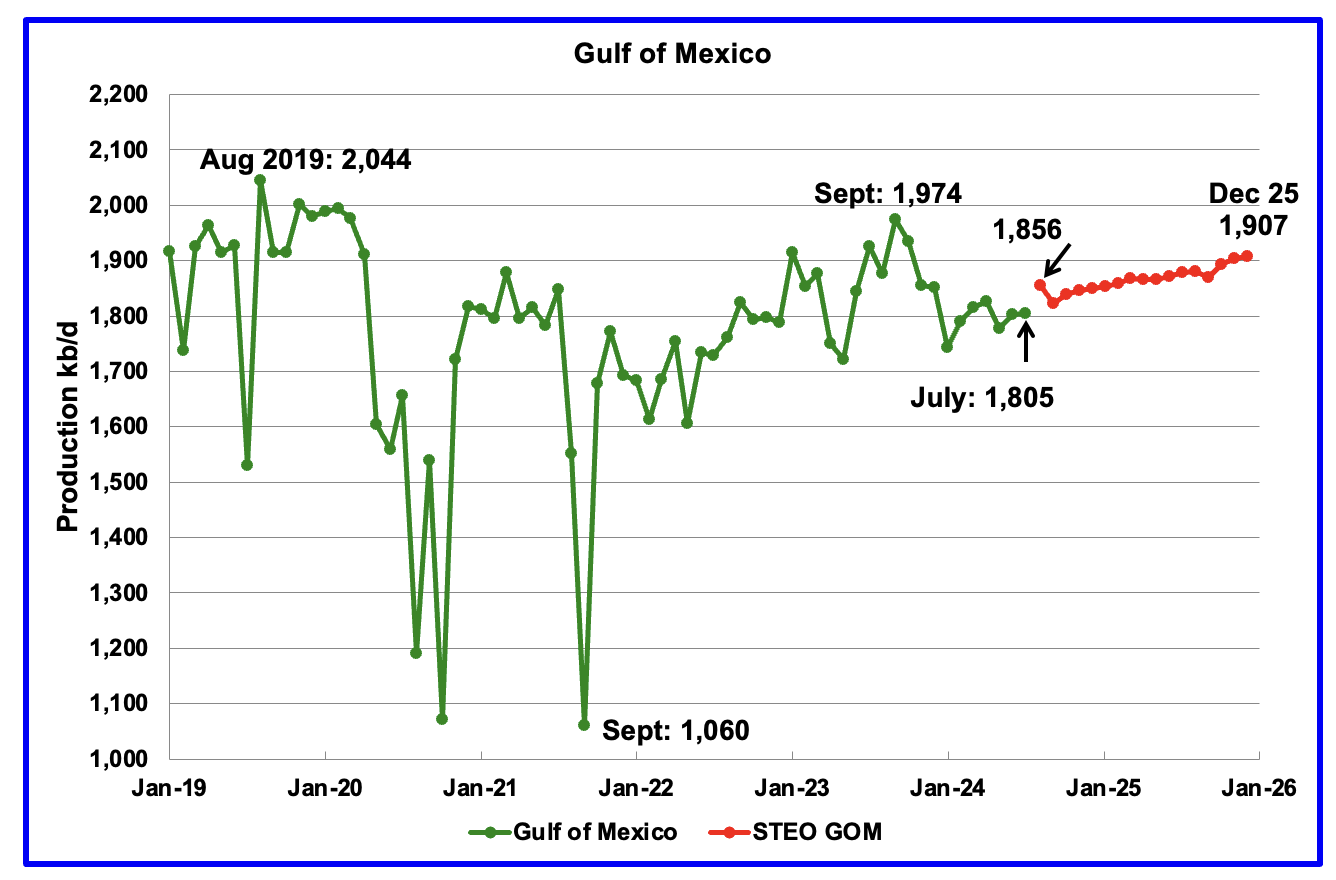
GOM production rose by 2 kb/d in July to 1,805 kb/d but is expected to rise by 51 kb/d in August to 1,856 kb/d.
The September 2024 STEO projection for the GOM output has been added to this chart. It projects production from August 2024 to December 2025 will rise by 51 kb/d to 1,907 kb/d.
A Different Perspective on US Oil Production
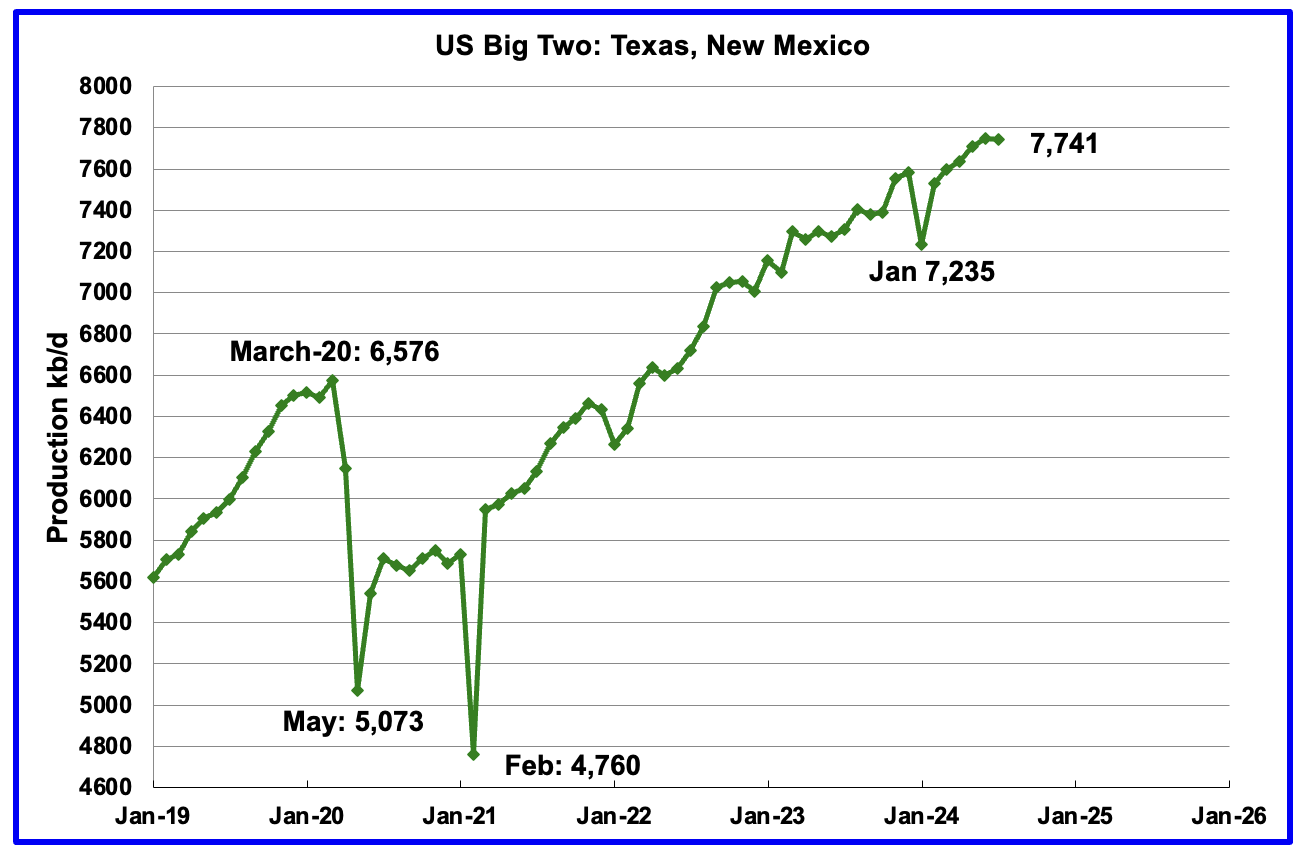
The Big Two states combined oil output for Texas and New Mexico.
July’s production in the Big Two states decreased by a combined 9 kb/d to 7,741 kb/d with Texas dropping 34 kb/d while New Mexico added 25 kb/d.
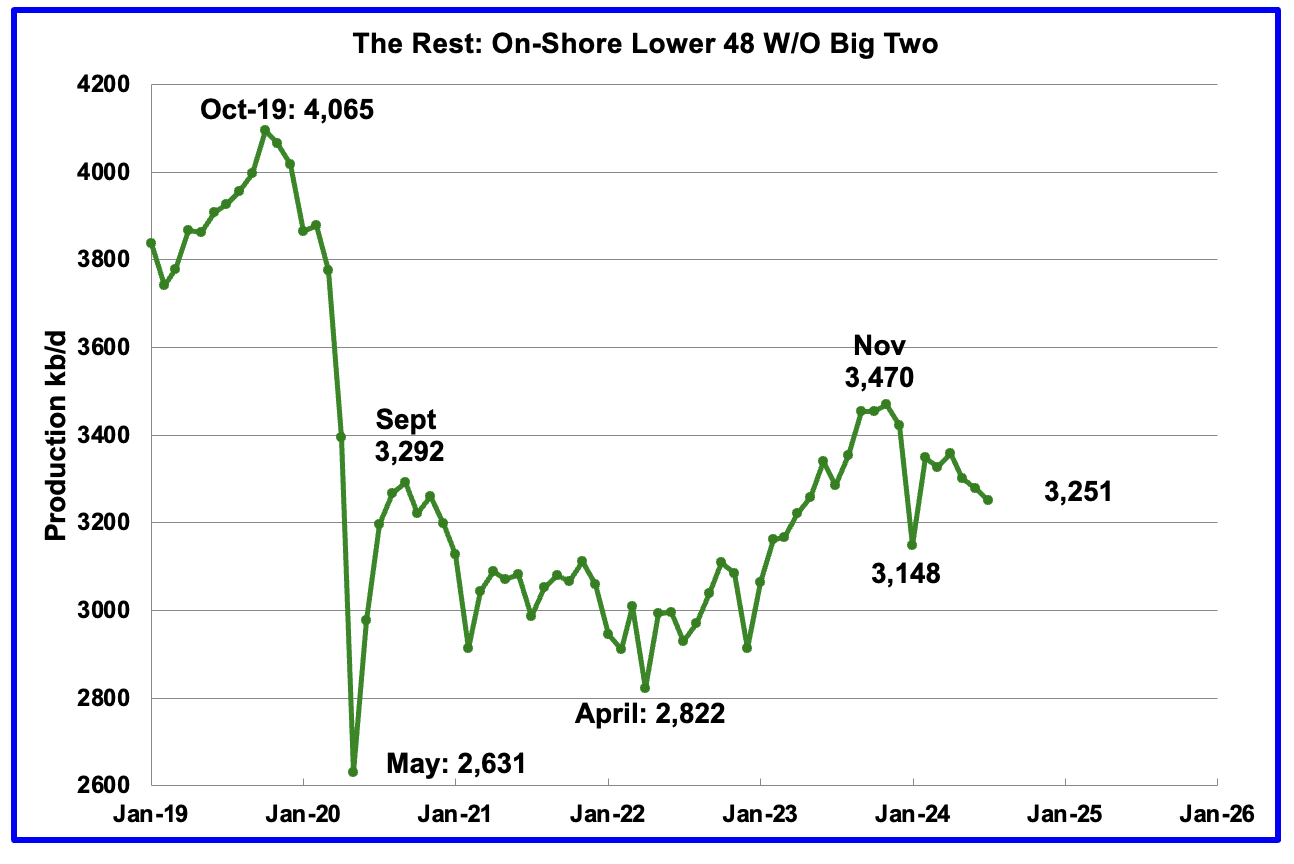
Oil production by The Rest
July’s oil production in The Rest dropped by 27 kb/d to 3,251 kb/d and is 208 kb/d lower than November 2023.
The main takeaway from The Rest chart is that current production is below the high of October 2019 and is a significant loss that occurred during the Covid shut down and will not be readily recovered. Note that production is now lower than Sept 2020 post covid rebound to 3,292 kb/d.
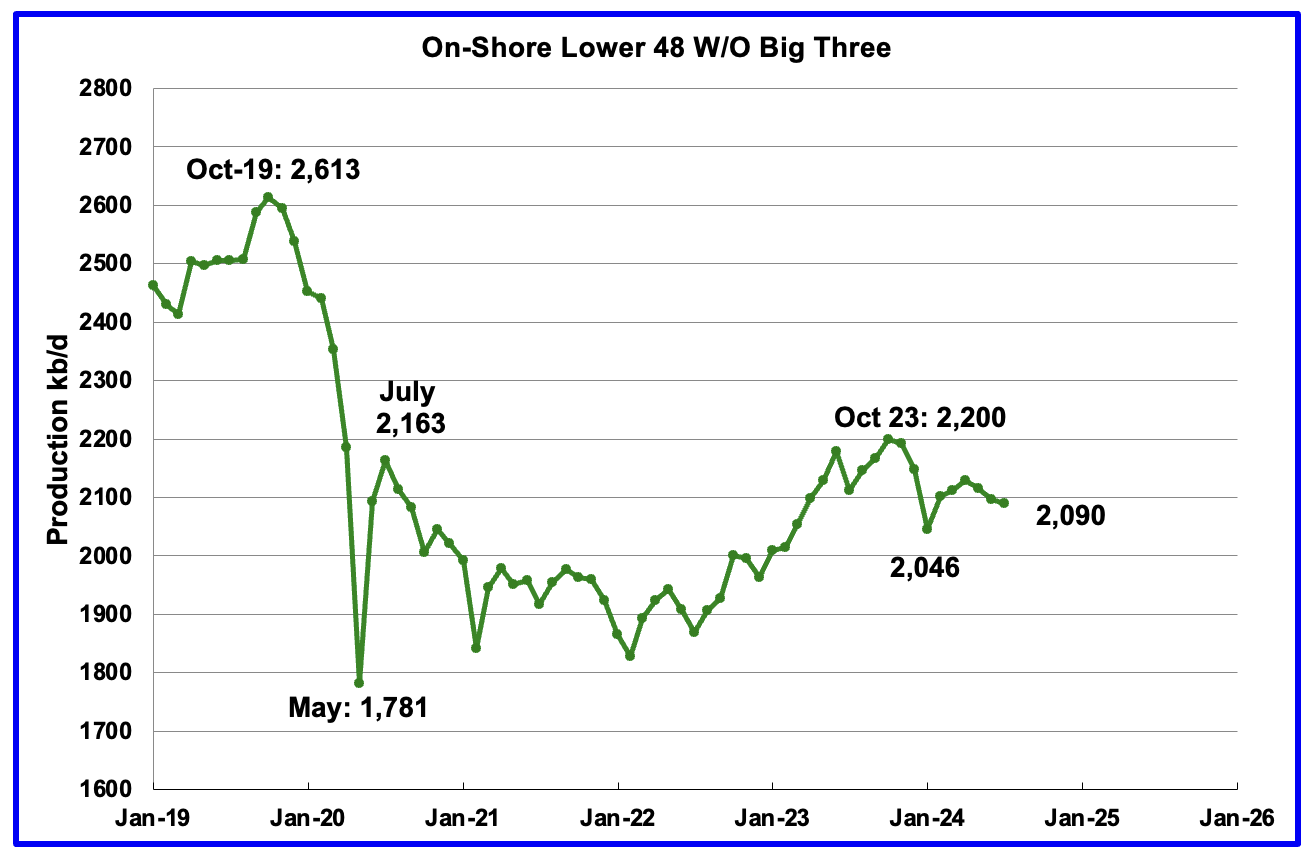
The OnShore L48 W/O the big three, Texas, New Mexico and North Dakota, shows production is on a plateau in the range of 2,125 ±75 kb/d from January 2023.
July’s production decreased by 7 kb/d to 2,090 kb/d. The two biggest contributors with declines were Texas with 34 kb/d and North Dakota with 20 kb/d.
Permian Basin Report by Main Counties and Districts
This special monthly Permian section was recently added to the US report because of a range of views on whether Permian production will continue to grow or will peak over the next year or two. The issue was brought into focus recently by the Goehring and Rozencwajg Report which indicated that a few of the biggest Permian oil producing counties were close to peaking or past peak. Also comments by posters on this site have similar beliefs from hands on experience.
This section will focus on the four largest oil producing counties in the Permian, Lea, Eddy, Midland and Martin. It will track the oil and natural gas production and the associated Gas Oil Ratio (GOR) on a monthly basis. The data is taken from the state’s government agencies for Texas and New Mexico. Typically the data for the latest two or three months is not complete and is revised upward as companies submit their updated information. Note the natural gas production shown in the charts that is used to calculate the GOR is the gas coming from both the gas and oil wells.
Of particular interest will be the charts which plot oil production vs GOR for a county to see if a particular characteristic develops that indicates the field is close to entering or in the bubble point phase. While the GOR metric is best suited for characterizing individual wells, counties with closely spaced horizontal wells may display a behaviour similar to individual wells due to pressure cross talking . For further information on the bubble point and GOR, there are a few good thoughts on the intricacies of the GOR in an earlier POB comment. Also check this EIA topic on GOR.
New Mexico Permian
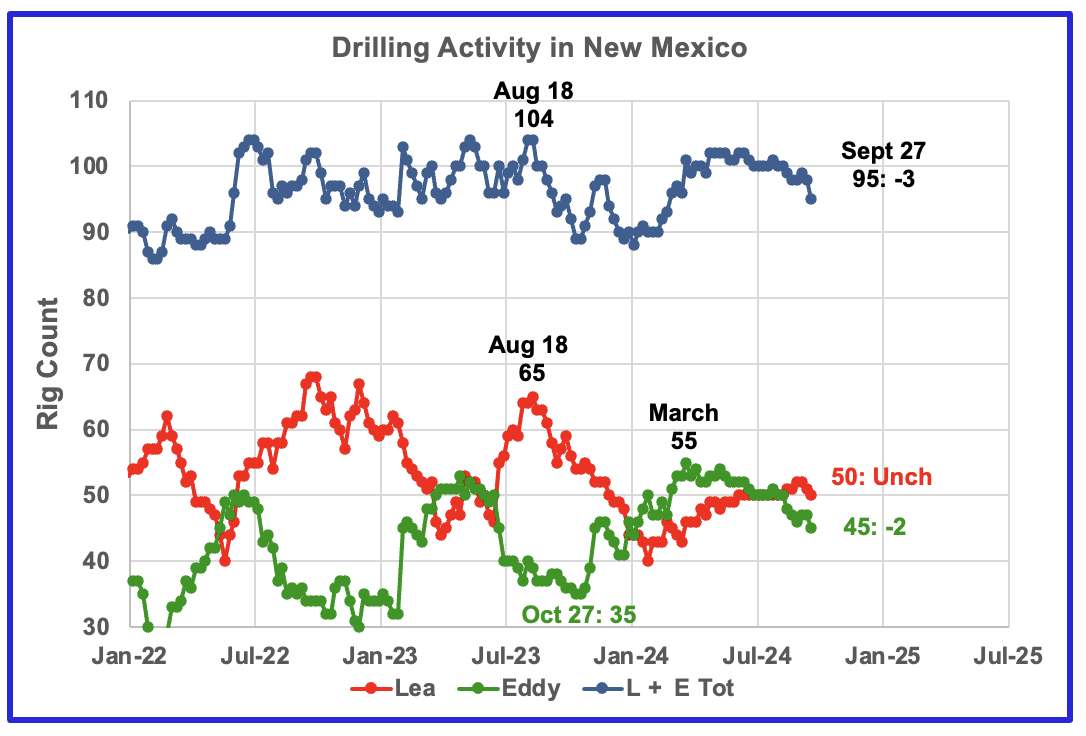
The total rig count in Lea and Eddy counties in late September 2024 is down 9 from the August 2023 high of 104 rigs.
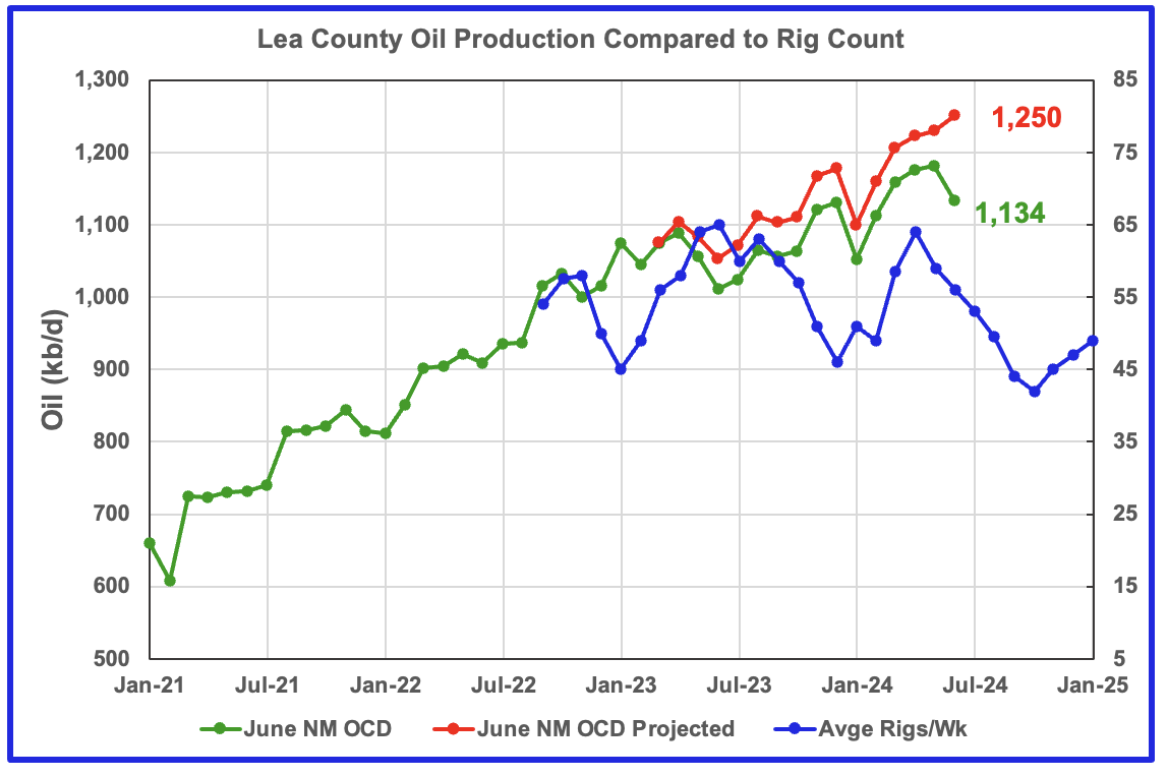
Since the middle of January, the Lea county rig count has increased from 40 rigs to 50 in late September. At the same time production has increased to 1,185 kb/d over the period January 2023 to May 2024. However due to a time lag between rig count and production, Lea County has entered a declining phase for the next several months before production may begin to rise again. See next chart.
At its peak in late March 2024, Eddy county had 55 rigs operating and are now down to 45 rigs at the end of September. However production is rising due to the increase in the rig count starting in October 2023. See Eddy oil production chart further down.
Comparison chart from last month to compare with the current July chart below.
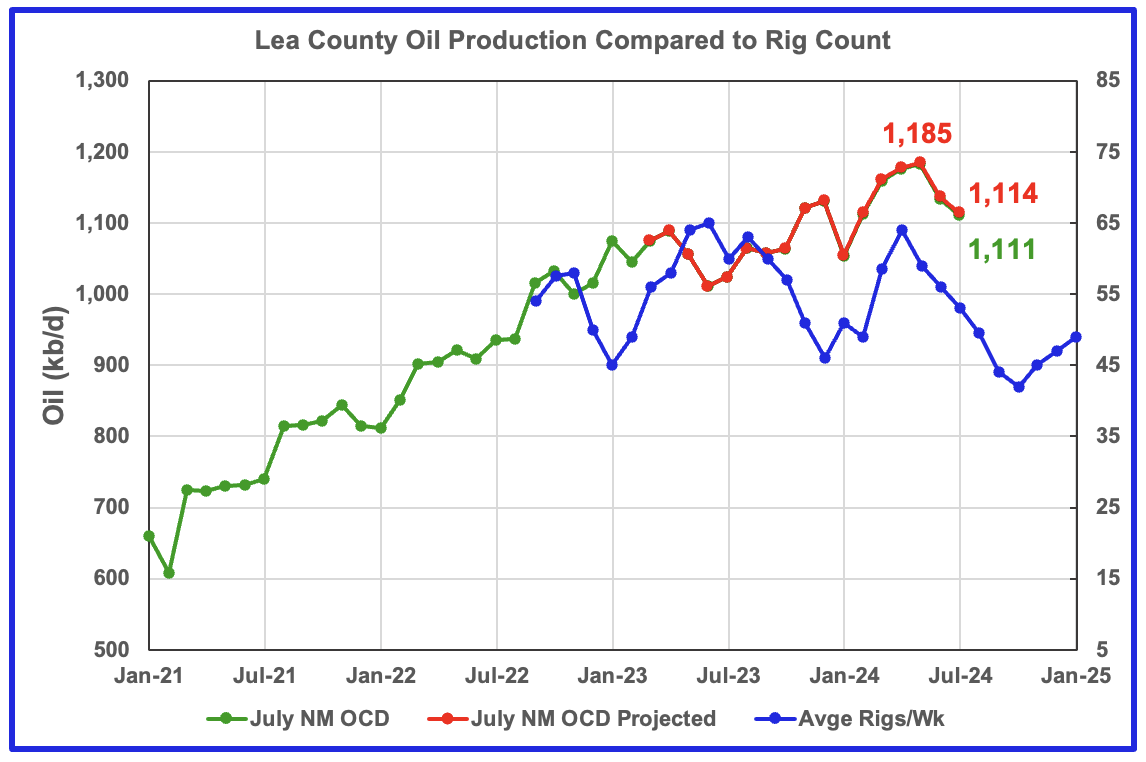
This chart is indicating that oil production in Lea County is following the drilling chart delayed by 8 months.
In the previous June update, the following was noted: “The June update made a total upward revision of 48 kb/d to production between the months March 2023 to June 2023. This revision shifted both the original June OCD data and the projection upward and created a big gap between the June data and the projection. The previous posts showed almost no changes between the original data and the projection after one year, see comparison chart above.”
Based on the above statement, this warning statement was added: ‘While this is what the model forecasts, I don’t think it is correct and it will be sorted out next month, provided the production revisions are more typical.
Next month has arrived, the revisions are more typical and the charts have sorted themselves out. As can be seen in the latest chart, the July OCD graph and July projection fall on top of each other because the New Mexico drillers get their data in on time and the NM government processes it very quickly. Note the difference between the July chart (no red/green gap) and the comparison June chart (red/green gap).
The biggest change from the June chart is that production appears to have peaked in May at 1,185 kb/d and has dropped for two months and should continue to drop for the next three months. July production dropped by 23 kb/d to 1,114 kb/d
The blue graph shows the average number of weekly rigs operating during a given month as taken from the weekly rig chart. The rig graph has been shifted forward by 8 months. So the 64 Rigs/wk operating in August 2023 have been time shifted forward to April 2024 to show the possible correlation and time delay between rig count and oil production.
Note that rig counts are being used to project production as opposed to completions because very few extra DUCs are being completed at this time.
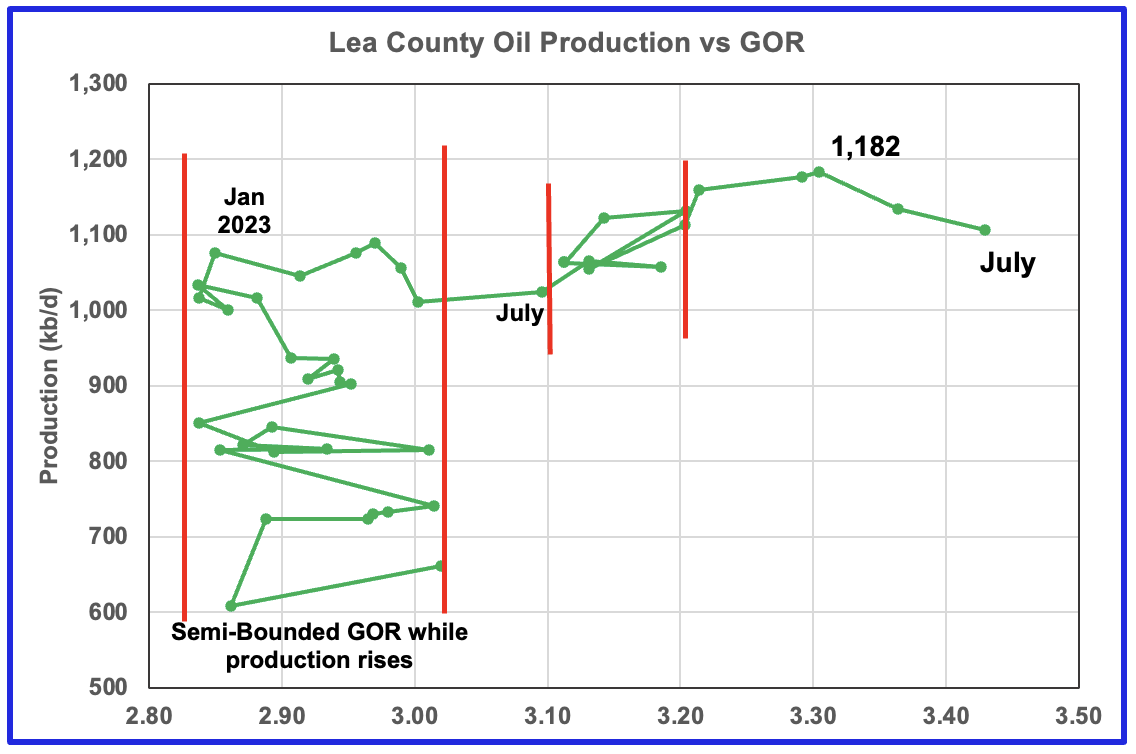
After much zigging and zagging, oil production in Lea county stabilized just above 1,000 kb/d in early 2023. Once production reached a new high in January 2023, production rose more slowly while the GOR started to increase rapidly to the right and entered the bubble point phase in July 2023.
Since July 2023 the Lea county GOR has continued to increase as production increased within a second semi-bounded GOR. This may indicate that the current production increase is coming from a new bench/field since the GOR’s behaviour since August 2023 to March 2024 time frame appears once again to be in a semi bounded GOR phase accompanied with rising production.
However in April, May and June 2024, the GOR moved out of the Second semi bounded GOR region and production reached a new high 1,182 kb/d in May along with an another increase in the GOR. The GOR increase since May along with dropping production is another indicator that Lea county has entered the bubble point phase for a second time and that production in the near term indicates that Lea County may be past its peak.
This zigging and zagging GOR pattern within a semi-bounded GOR while oil production increases to some stable level and then moves out to a higher GOR to the right has shown up in a number of counties. See an additional two cases below.
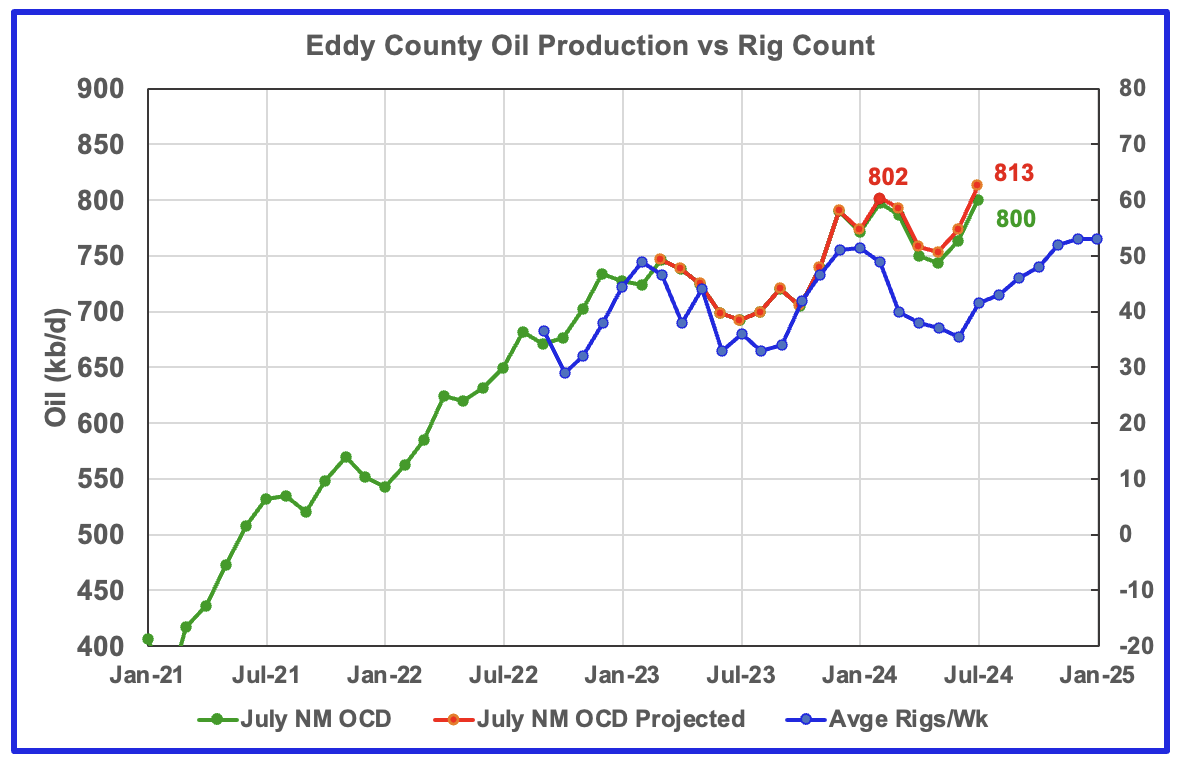
Eddy County oil production is now following the drilling chart. What is surprising is that July production is higher than February.
Eddy county oil production hit a projected high of 802 kb/d in February 2024. The NM OCD projection estimates that the production forecast for July increased by 40 kb/d to 813 kb/d, a new high. The large production increase in July is due to the average number of rigs increasing from 35.5 to 41.5. Those wells that were drilled approximately 8 months ago came online in July and boosted July production to a new high.
In earlier posts the following was noted “Something is happening in Eddy county which will take at least six months to show up.”
The results of that drilling increase are now starting to show up. The GOR chart below indicates that the wells are being drilled into a new bench or a new field nearby. If someone could provide some insight on where production is increasing in Eddy County, it would be appreciated. Is drilling occurring in a new field or has a new bench been found?
The blue graph shows the average number of weekly rigs operating during a given month as taken from the above weekly drilling chart. The rig graph has been shifted forward by 8 months to roughly coincide with the increase in the production graph starting in October 2023.
If production were to follow the rig count trend going forward, production should continue to rise for the next few months.
Last month the following was stated. “The beginning of a new rising trend does not mean that production will exceed the February peak of 802 kb/d. It is the increasing legacy decline that will limit how much production can increase from the May low.” My Bad. Time for a rethink
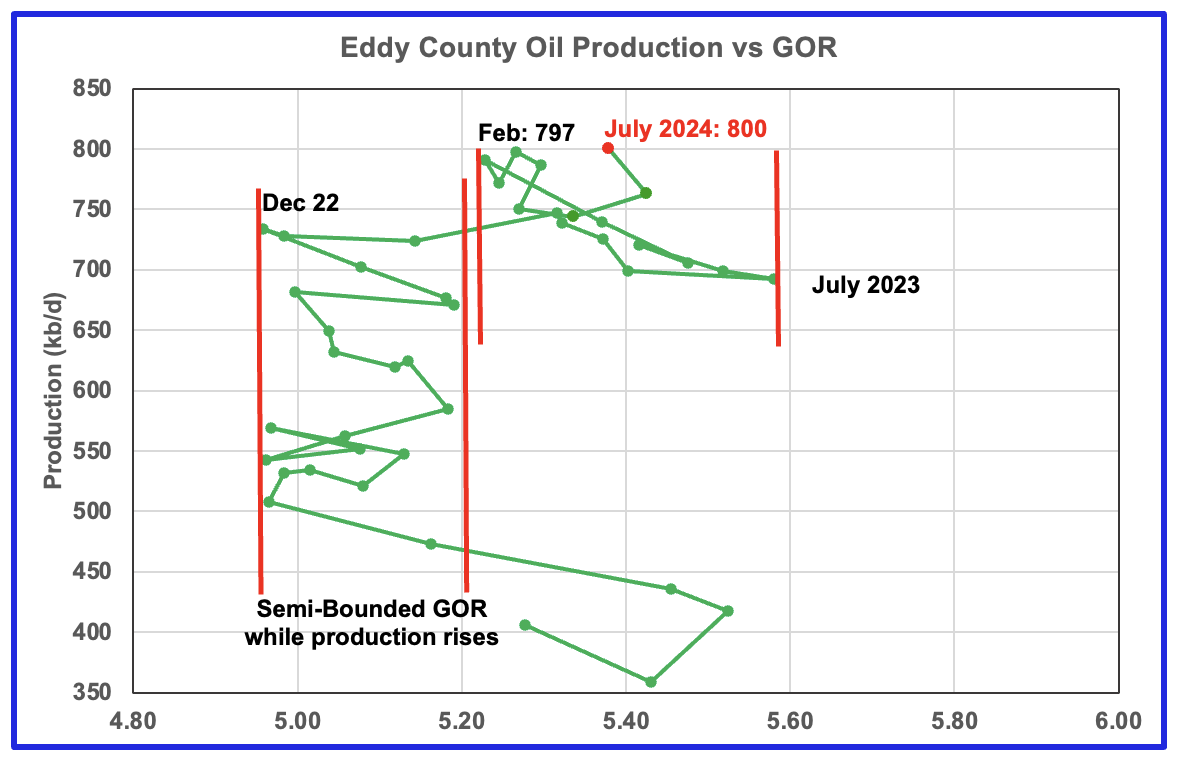
The Eddy county GOR pattern is similar to Lea county except that Eddy broke out from the semi bounded range earlier and for a longer time and then added a second semi bounded GOR phase.
August 2023 saw a reversal in the increasing GOR trend which then was followed by the current oil production increase which reached a new high in February 2024 of 797 kb/d and exceeded it in July, an atypical pattern. This behaviour appears to indicate a second semi-bounded GOR phase while production rises has started, possibly associated with production from a new bench or field.
Texas Permian
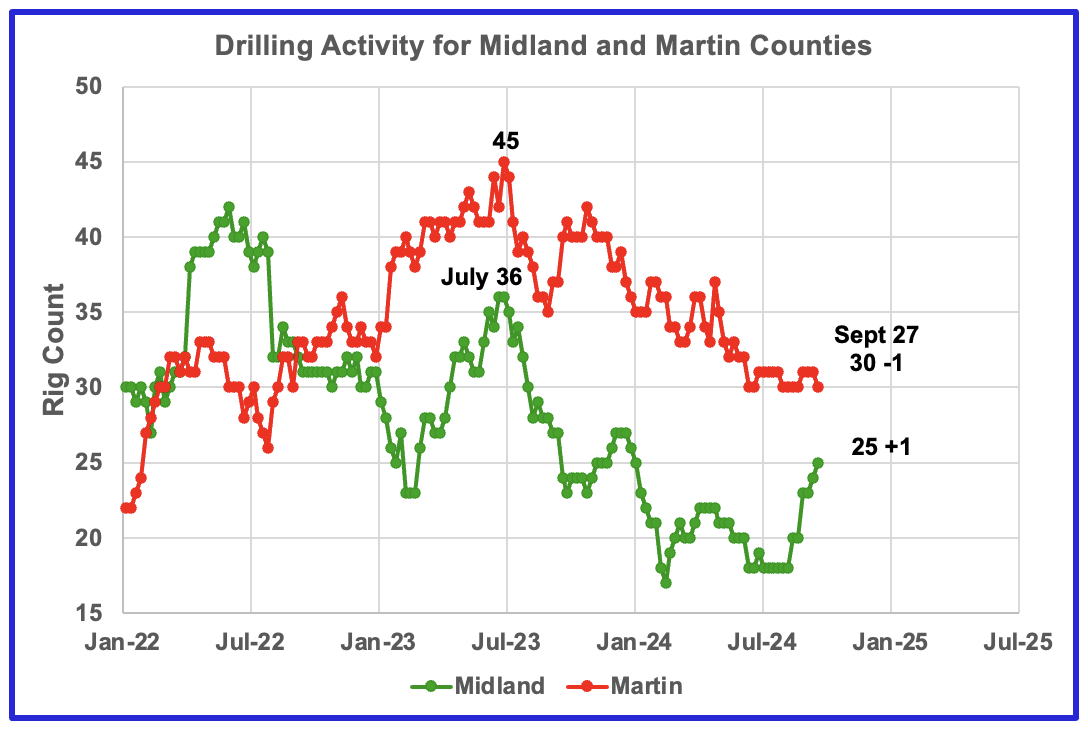
The rig count in Midland county has been dropping since July 2023. Midland county rigs have continued to drop and reached a low of 18 in July. They have rebounded to 25 at the end of September. Rigs are down close to 33% from where they were in July 2023.
Martin county rigs have bee rising rapidly since the beginning of August. At the end of September the rig count had increased by 7 to 25.
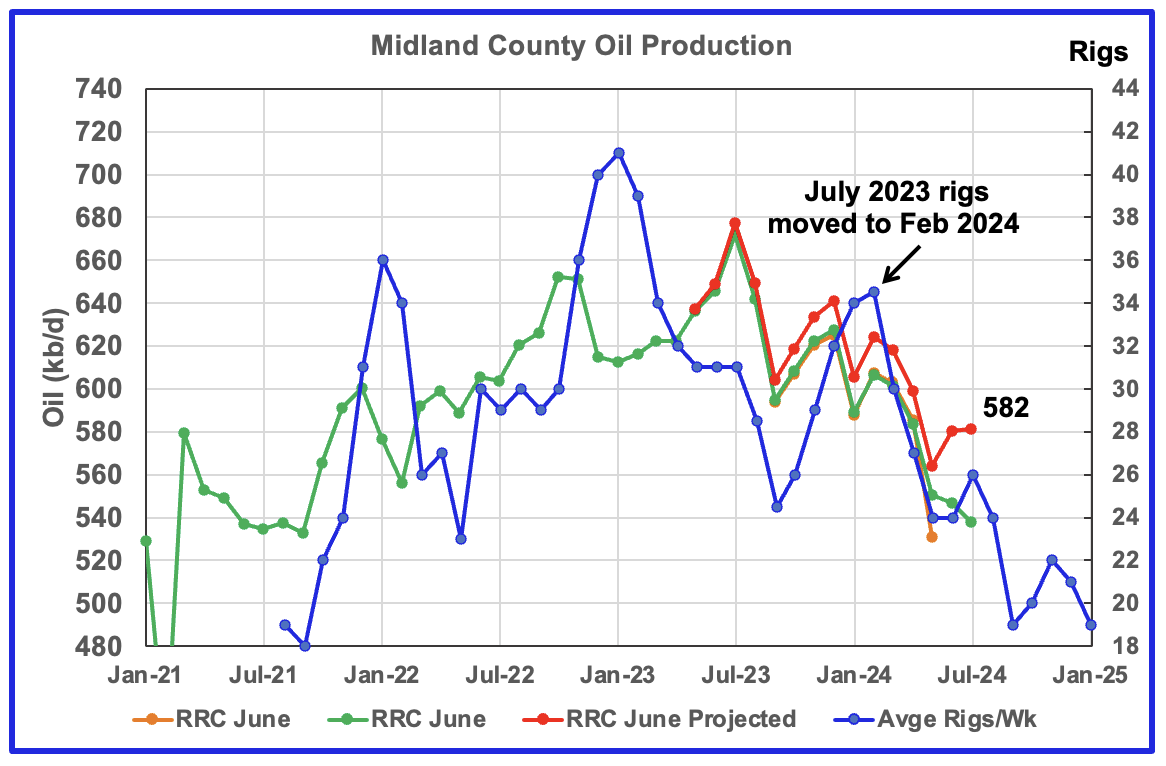
Midland County production has peaked.
Midland County’s slow and steady declining oil production phase started in August 2023. The green graph shows July’s preliminary production as reported by the Texas RRC. Midland county’s June preliminary production reversed the dropping trend and increased the projected production by 16 kb/d to 580 kb/d and is essentially flat for July at 582 kb/d.
The orange and green graphs show the production reported by the Texas RRC for June and July. Note that the last month in the July production graph is higher than the last month in the June production graph.
The blue graph shows the average number of weekly rigs operating during a given month as taken from the weekly drilling chart. The rig graph has been shifted forward by eight months. So the average 34.5 Rigs/wk operating in July 2023 have been moved forward to February 2024 to show the possible correlation and time delay between rig count and oil production. If the eight month shift in the rig count is approximately correct in that oil production can be tied to the rig count, oil production in Midland county should increase for a month or two before resuming its decline.
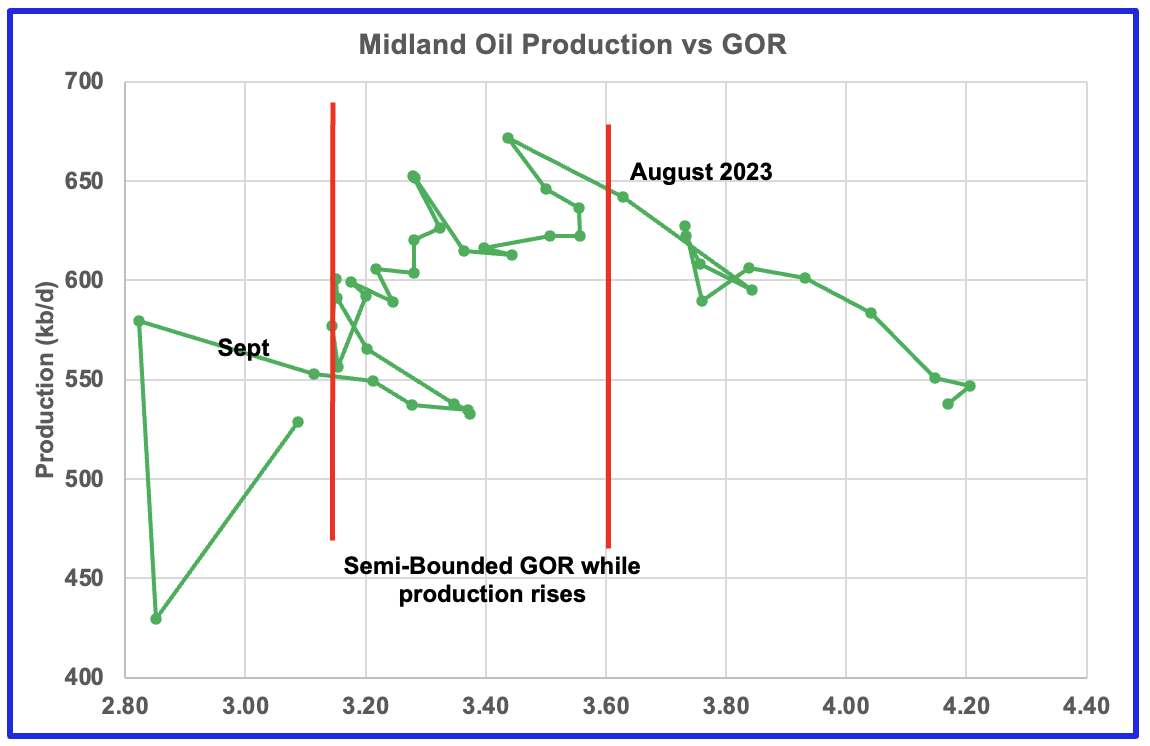
With Midland county deep into the bubble point phase, oil production has dropped significantly from October 2022 and the GOR continues to increase. Note that oil production and GOR in this chart is based on the RRC’s preliminary July production report.
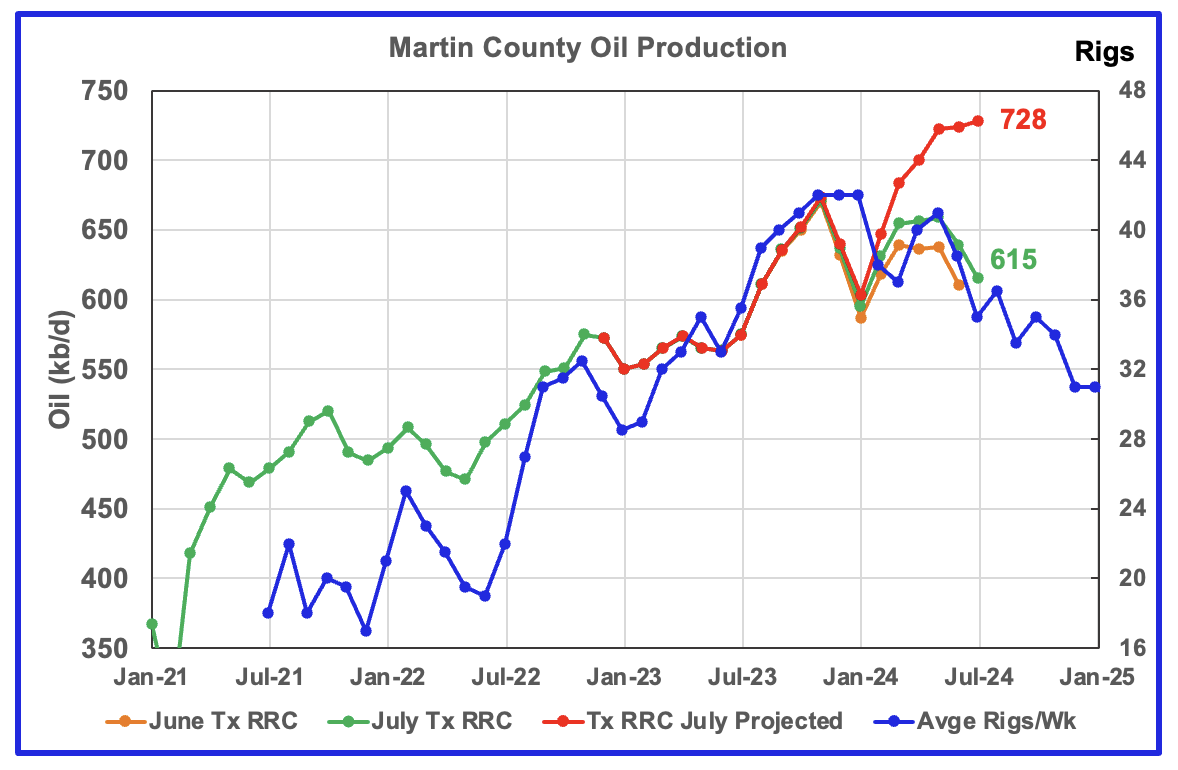
Martin County is on a plateau and close to its peak and could be on the verge of entering its decline phase.
This chart shows Texas RRC oil production for Martin County. It was showing initial signs of peaking in November 2023 but was then followed by declining production into January 2024. Production has been tracking the increasing rig count according up to May but has diverged since then. May, June and July production has been flat relatively flat, 723 kb/d, 724 kb/d and 728 kb/d respectively, 54 kb/d higher than the November peak of 674 kb/d.
The blue chart shifts the rig count ahead by 6 months. Note the three flat spots in the November, December and January rig count and similar flat spots in production a few months later.
The red graph is a production forecast which the Texas RRC could be reporting for Martin county about one year from now as the Texas RRC reports additional updated production information. This projection is based on a methodology that used June and July production and will be re-estimated each month going forward. Production is expected to fall in August since it has defied the rig count for a few months,
The orange and green graphs show oil production reported by the Texas RRC for June and July.
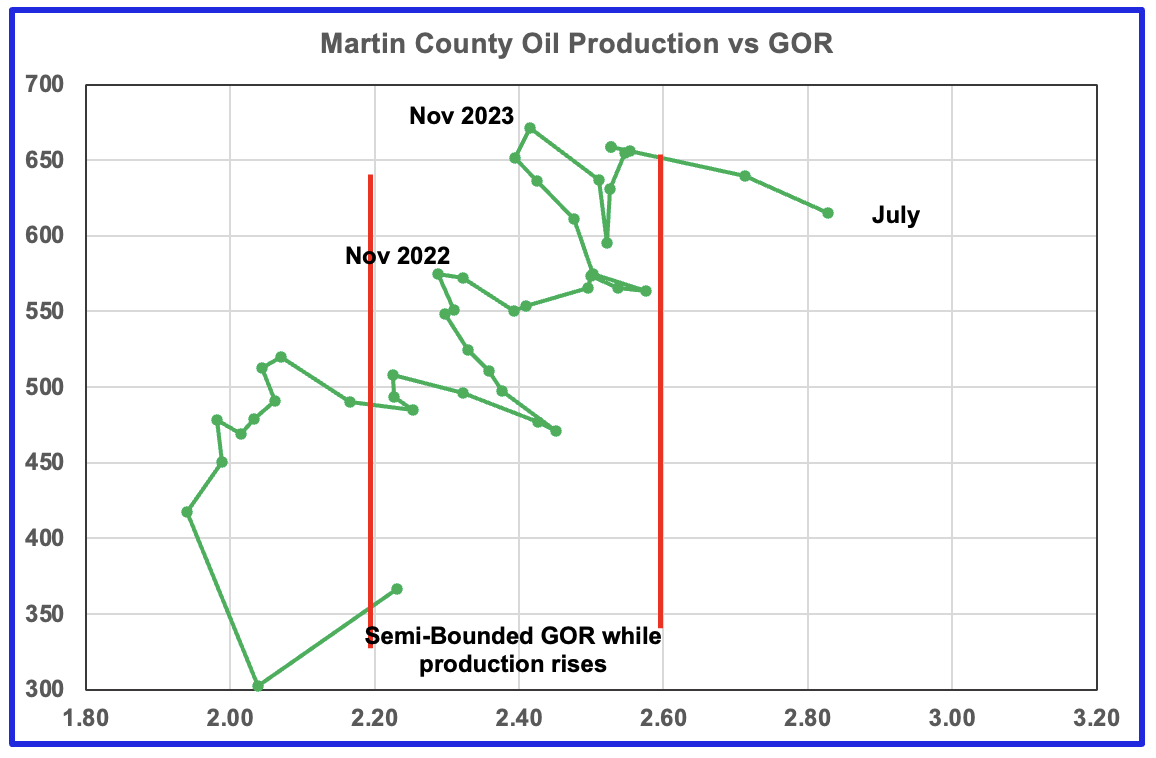
Martin county’s oil production after November 2022 increased and at the same time drifted to slightly higher GORs within the semi bounded range. July’s preliminary gas and oil production indicates that production was almost flat along with the GOR moving further out of the semi-bounded area.
Martin county has the lowest GOR of the four counties at a GOR of close to 2.60 but for July jumped to 2.83, out of the semi-bounded region. Martin County may have entered the bubble point phase that should result in a dropping oil production trend shortly.
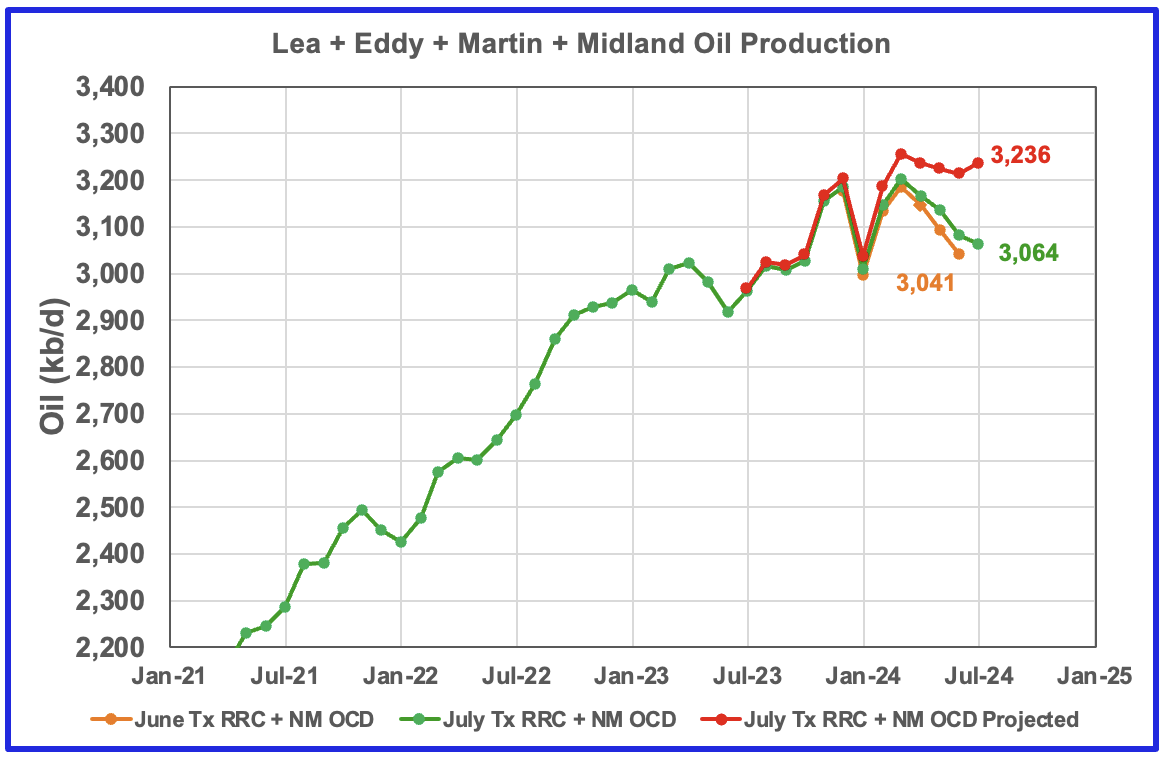
This chart shows the total oil production from the four largest Permian counties. Assuming that current July Permian production is close to 6,300 kb/d, these four counties account for close to 50% of the total. If their combined production has peaked, the Permian has peaked. A few more months of data is required to determine if the Permian has peaked or is on a plateau.
July production rose by 22 kb/d to 3,236 kb/d. The June and July initial production data is shown in the orange and green graphs respectively. The red graph uses the June and July data to project an estimate for the final July production. The increase in July production is largely due to the 40 kb/d increase from Eddy county.
Findings
– Lea County oil production is following the rig count graph and may have peaked.
– Eddy County oil production initially peaked in February 2024 but has now started a new increasing phase as it follows the uptrend in the rig count and has exceeded the previous February peak.
– Midland county peaked in July 2023.
– Martin County is on a plateau prior to heading into its decline phase.
A note on assumptions. In the above charts of production vs rig count, the rig count has been shifted forward by 6 to 8 months and the assumption is made that production follows rig count. The underlying assumption for doing that is that no more or very few DUCs are being used. Also implicit in making the above calls is that the drillers and frackers are using the latest technology, i.e. 3 mile laterals, max proppant and chemicals and some refracs. I have no basis for assuming this assumption is correct.
Texas District 8
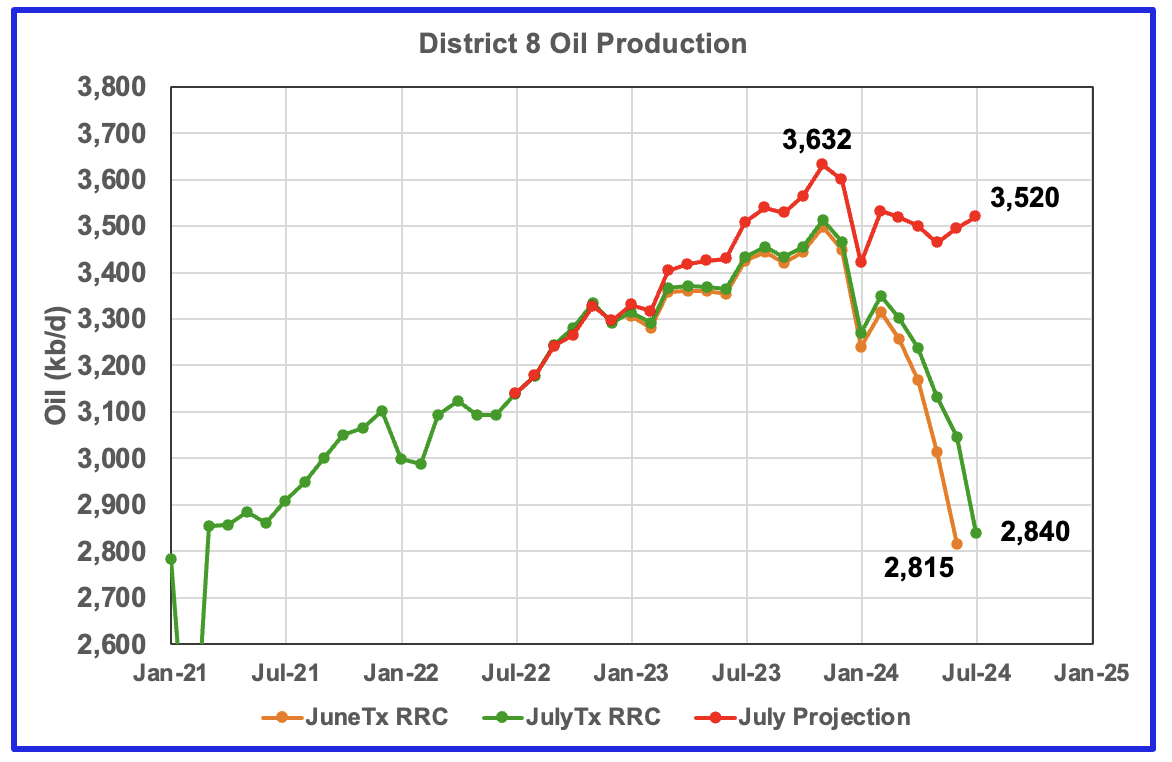
Texas District 8 has peaked.
Texas District 8 contains both the Midland and Martin counties. Combined these two counties produce close to 1,300 kb/d of oil. While these two counties are the two largest oil producers, there are many other counties with smaller production, Reeves #3, Loving #4 and Howard #5 that produced a total of 3,632 kb/d of oil in November 2023. Essentially the Midland and Martin counties produce close to 36% of the District 8 oil.
This chart shows a projection for District 8 oil production. The red graph, derived from the June and July production data indicates that oil production in District 8 has peaked. July production rose by 25 kb/d to 3,520 kb/d and is down 112 kb/d from the peak in November 2023.
The orange and green graphs show the production reported by the Texas RRC for June and July. Note that the last month in the June production graph is higher than the last month in the May production graph. This is why the projection shows July’s production is higher than June’s.
District 8 accounts for more than 50% of Texas production. With July’s preliminary production being lower than November’s 3,632 kb/d, it is difficult to understand how the EIA’s Texas production has continued to increase since February. However July saw the first drop in Texas oil production since January. Has District 8’s dropping production trend finally started to show up in Texas’ overall production? The next few months will tell the tale.
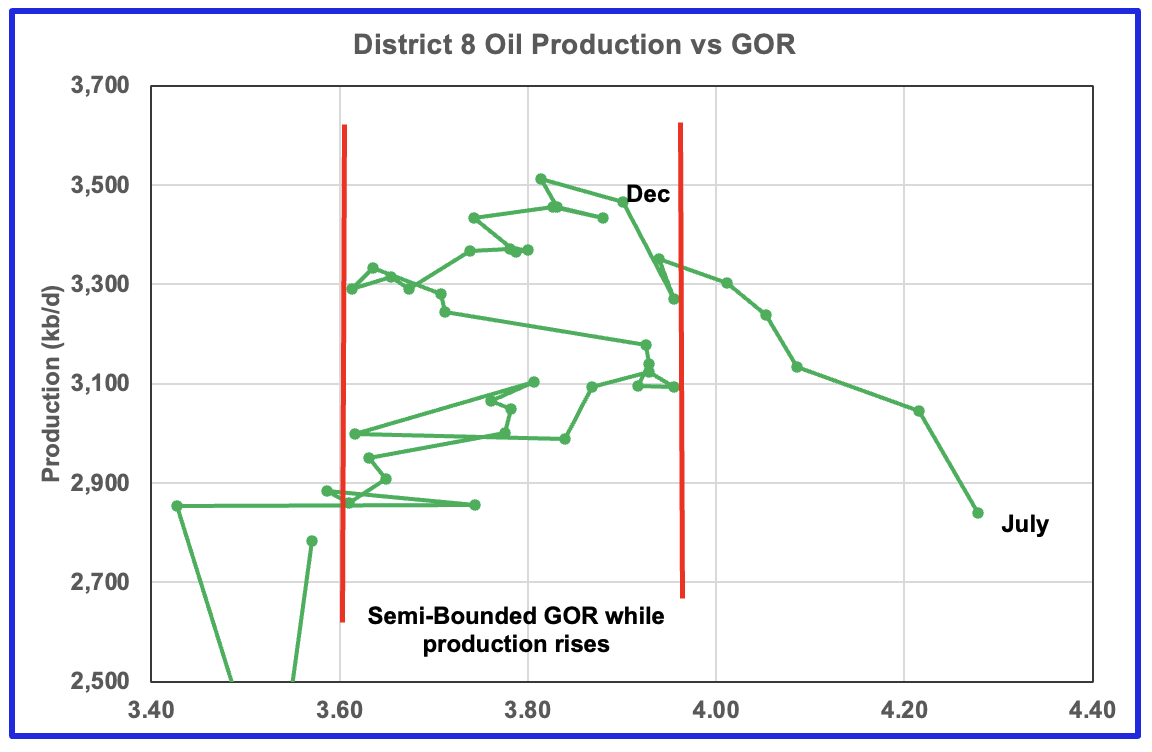
Plotting an oil production vs GOR graph for a district may be a bit of a stretch. Regardless here it is and it seems to indicate many District 8 counties may well be into the bubble point phase.
Three Texas Counties
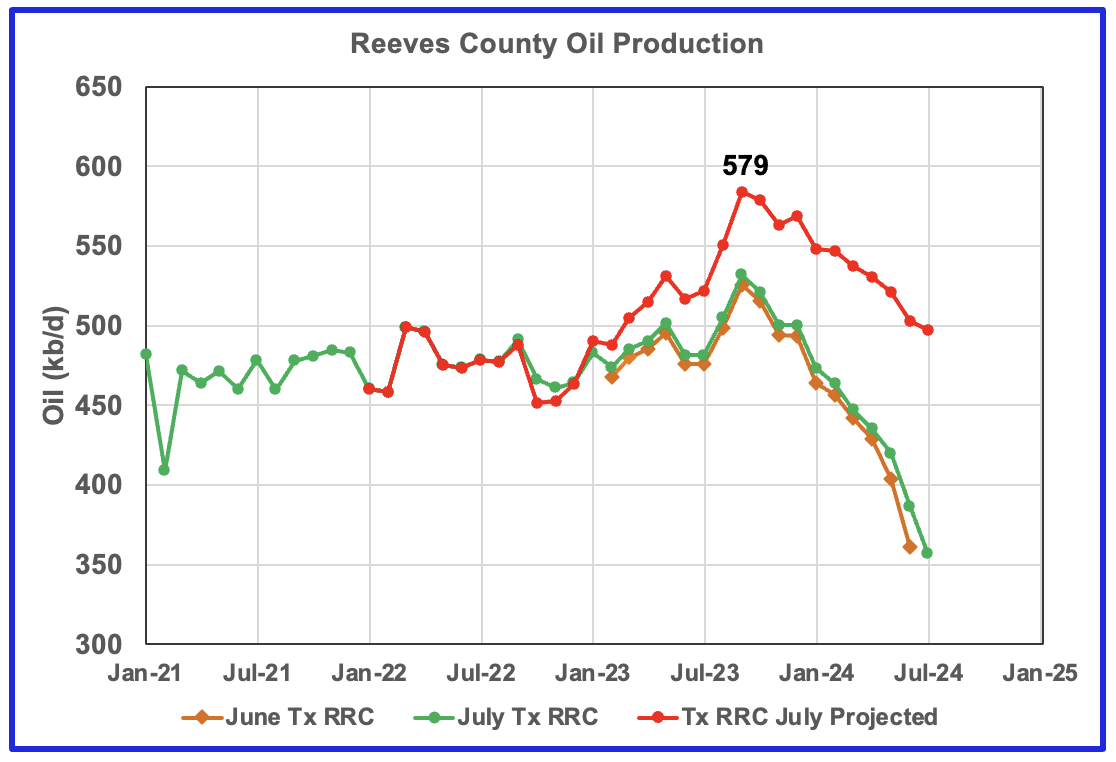
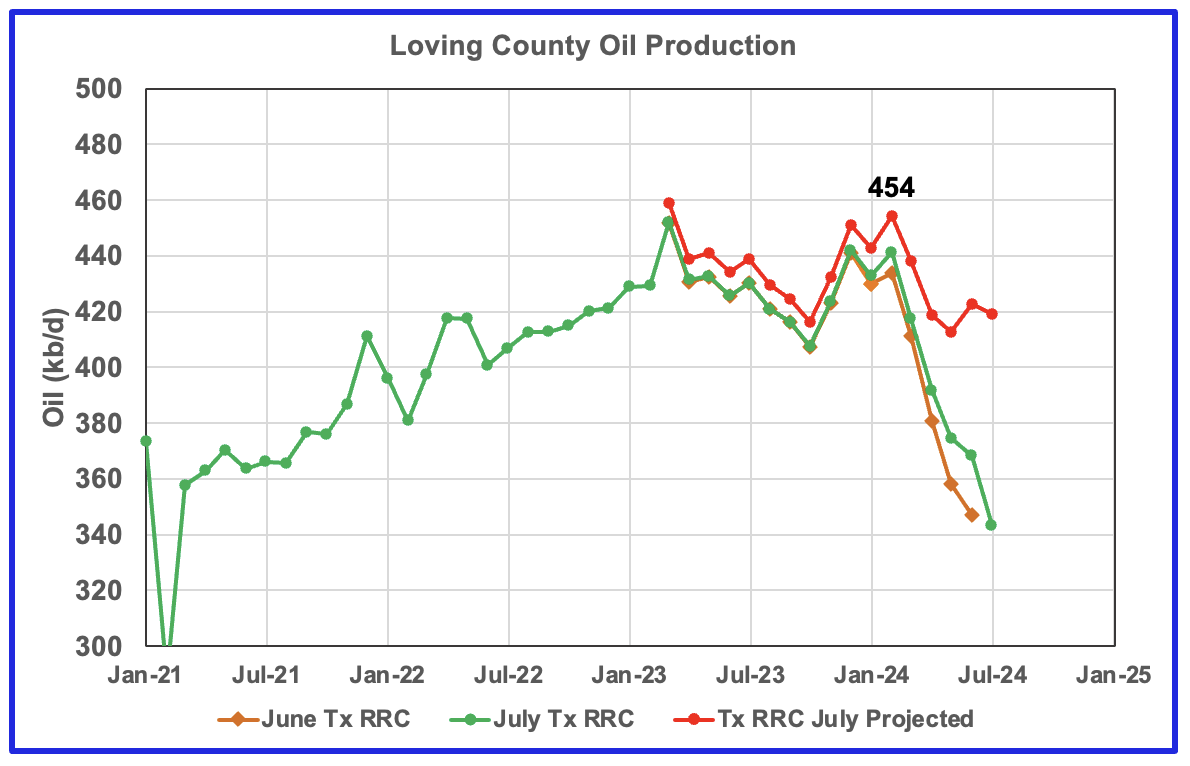
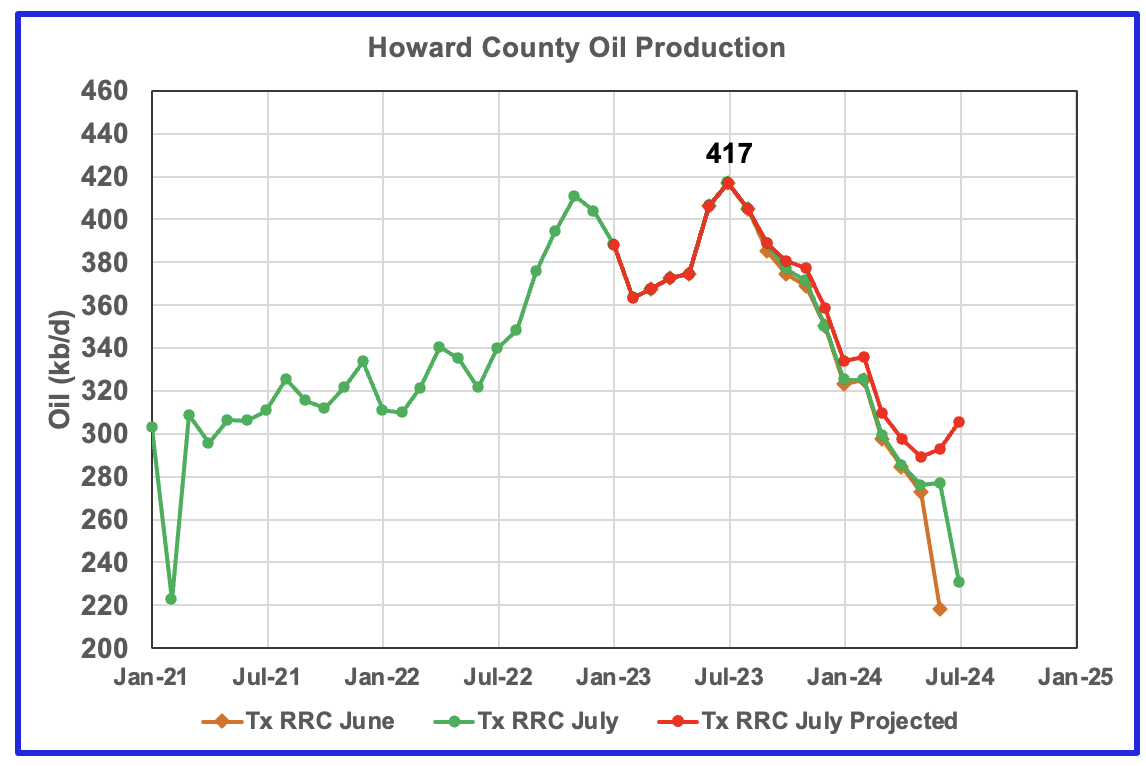
These three counties are ranked #3, #4 and #5 in terms of Texas oil production. All three have peaked.
Drilling Productivity Report
The Drilling Productivity Report (DPR) uses recent data on the total number of drilling rigs in operation along with estimates of drilling productivity and estimated changes in production from existing oil wells to provide estimated changes in oil production for the principal tight oil regions. The new DPR report in the STEO provides production up to August 2024. The report also projects output to December 2025. The DUC charts and Drilled Wells charts are also updated to August 2024.
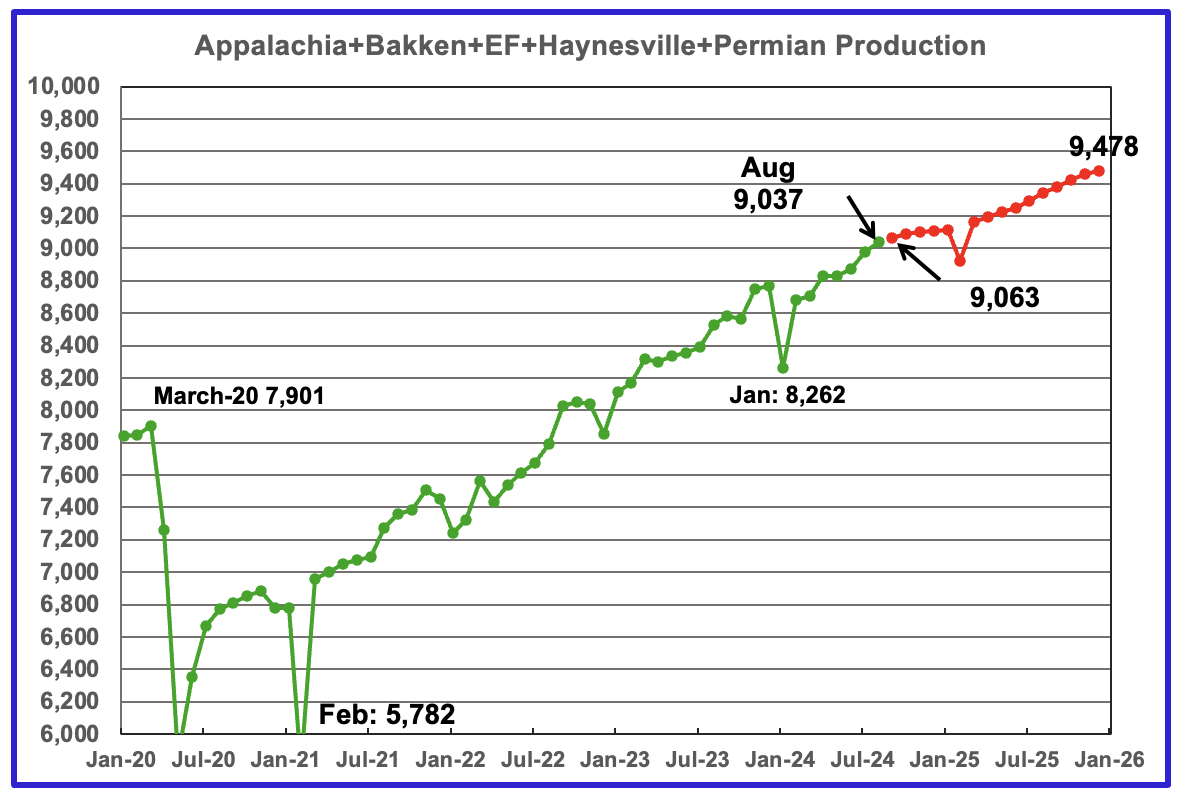
The August 2024 oil production for the 5 DPR regions tracked by the EIA is shown above. Also a projection by the STEO to December 2025 has been added, red markers. Note DPR production includes both LTO oil and oil from conventional wells. Production for the Anadarko and Niobrara regions is no longer available.
The DPR is reporting August oil output in the five regions increase by 59 kb/d to 9,037 kb/d. Production is expected to grow by 26 kb/d in September to 9,063 kb/d. By December 2025 production is expected to reach 9,478 kb/d. This is 29 kb/d higher than forecast in the previous update.
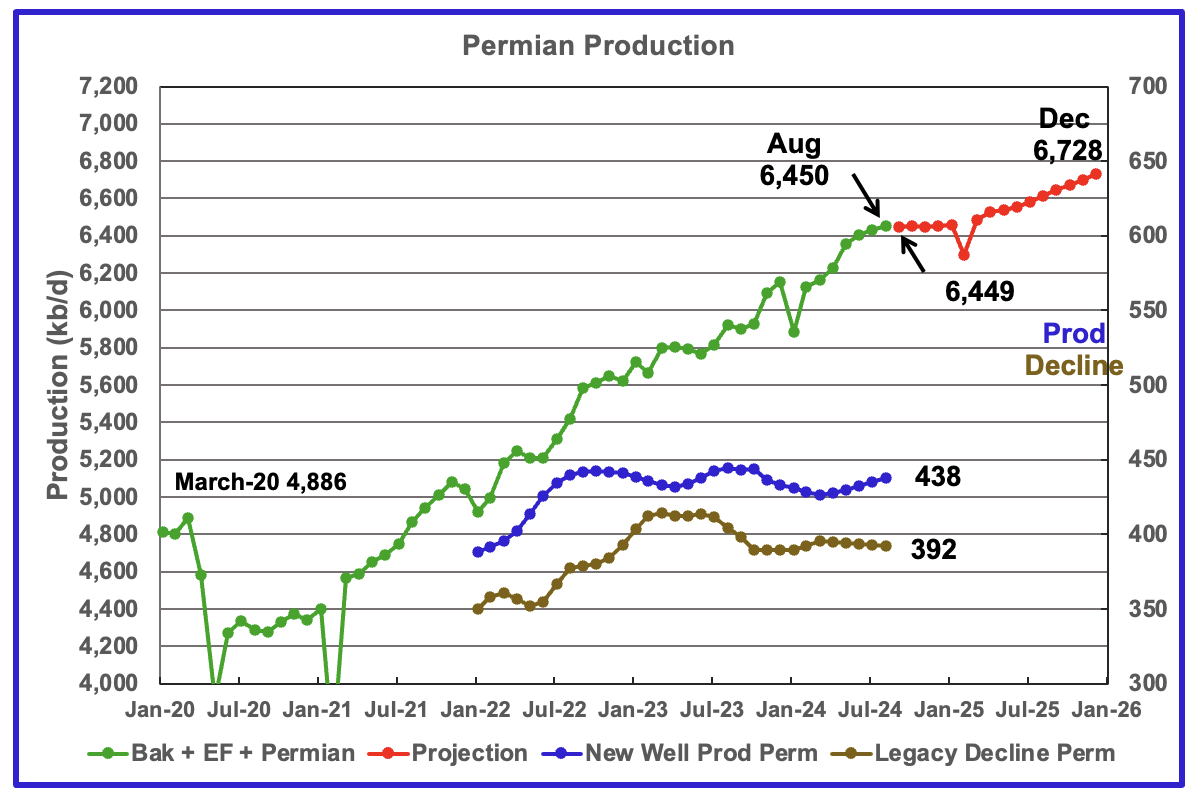
According to the EIA’s September DPR report, Permian output will be flat from August to January 2025. It is expected to decrease by 7 kb/d to 6,457 kb/d in January 2025. By December 2025 output is expected to be 6,728 kb/d, 22 kb/d lower than estimated in the previous report.
Production from new wells and legacy decline, right scale, have been added to this chart to show the difference between new production and legacy decline.
What is surprising is that production from new wells and legacy decline are different. They should be the same since production is flat? That has to make one question whether those numbers are correct?
The August production increase was 21 kb/d. According to the new production/decline graphs, August production should have increased by 46 kb/d?
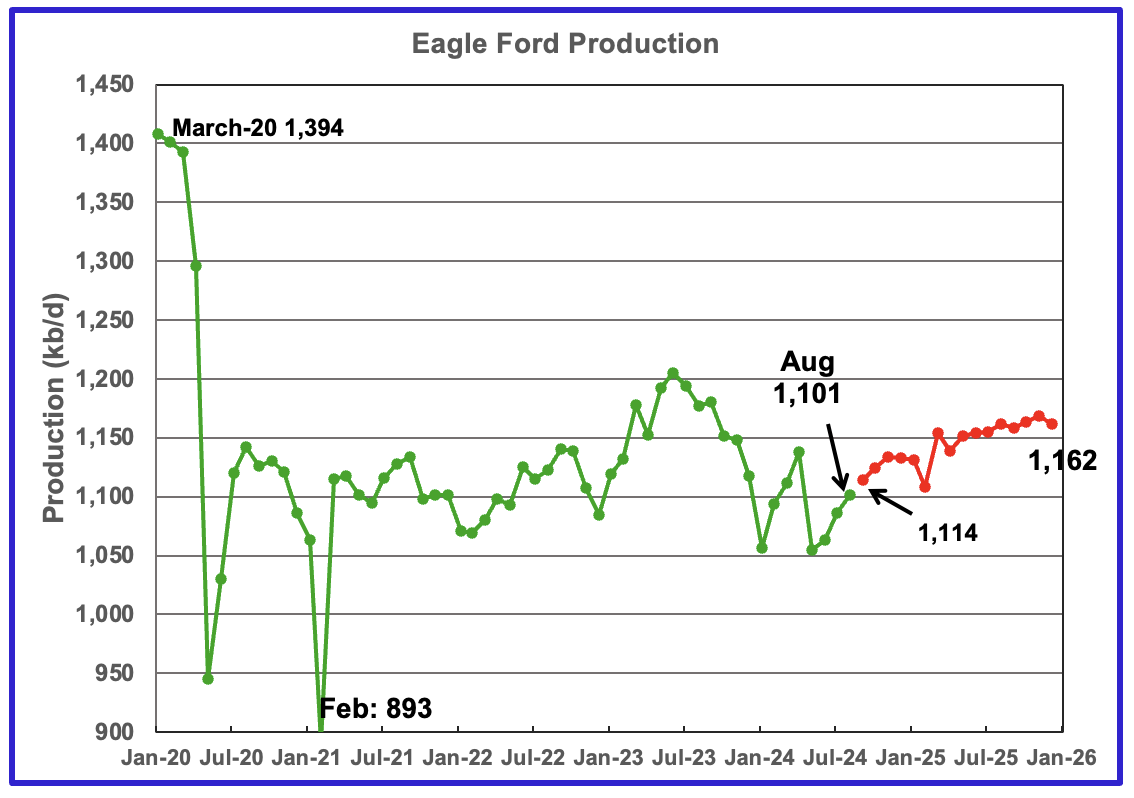
Output in the Eagle Ford basin has been declining since June 2023 but started to recover in June 2024. For August production increased by 15 kb/d to 1,101 kb/d. Production is expected to reach 1,162 kb/d in December 2025. The red graph is a production projection by the STEO.
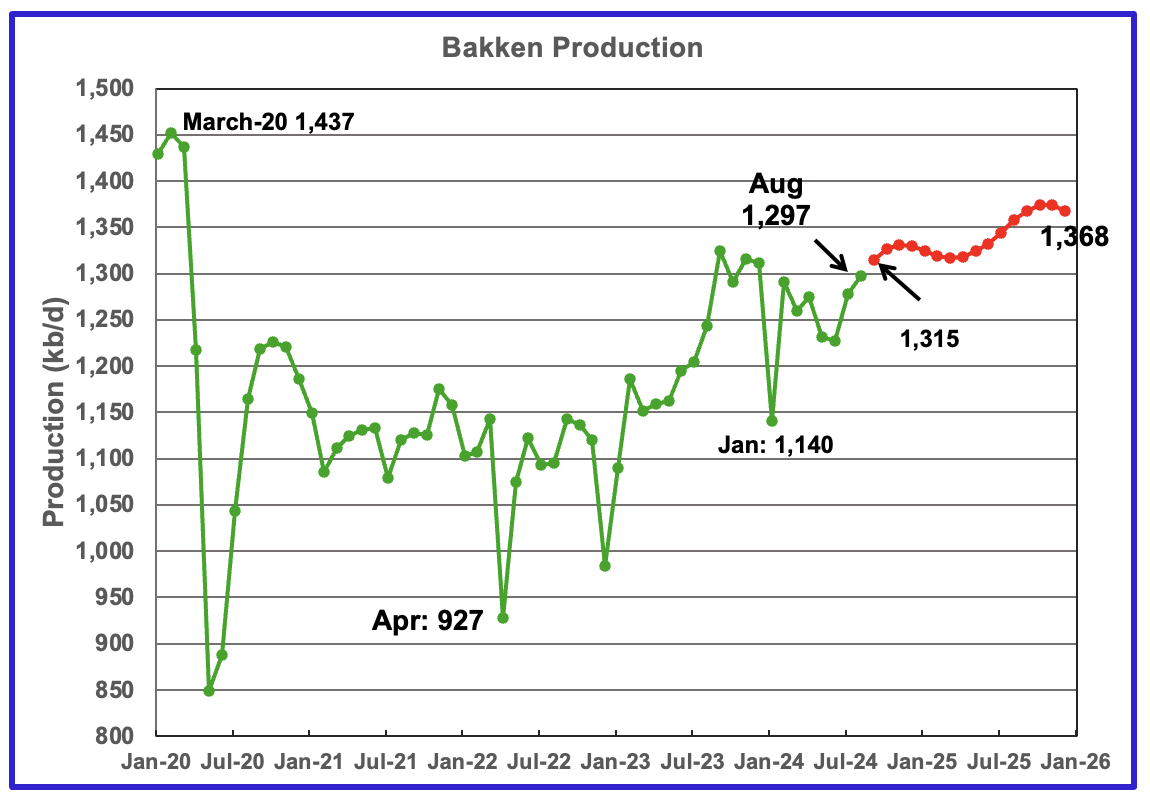
The DPR/STEO forecasts Bakken output in August will rise by 19 kb/d to 1,297 kb/d. The STEO projection out to December 2025 shows output varying between 1,300 kb/d and 1,370 kb/d over the next 18 months.
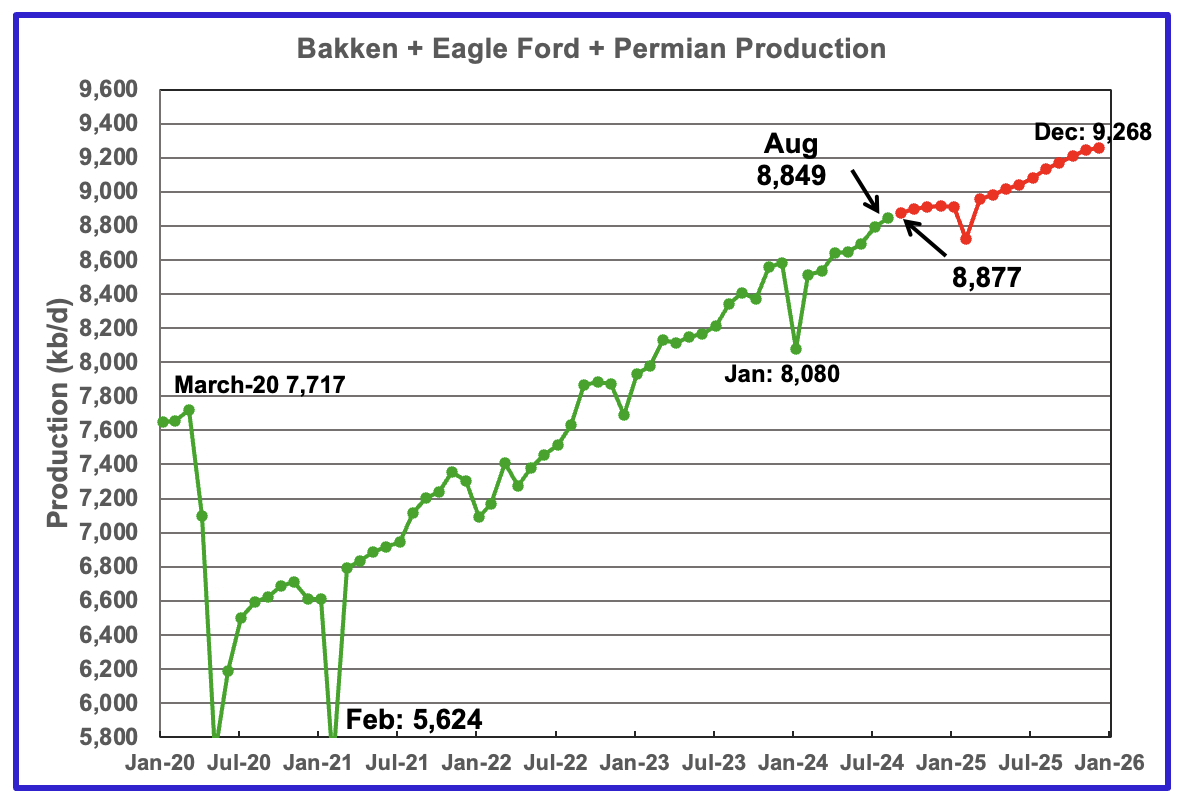
This chart plots the combined production from the three main LTO regions. For August output rose by 57 kb/d to 8,849 kb/d. Production in December 2025 is expected to reach 9,268 kb/d. This is 128 kb/d lower than forecast in the previous report.
DUCs and Dilled Wells
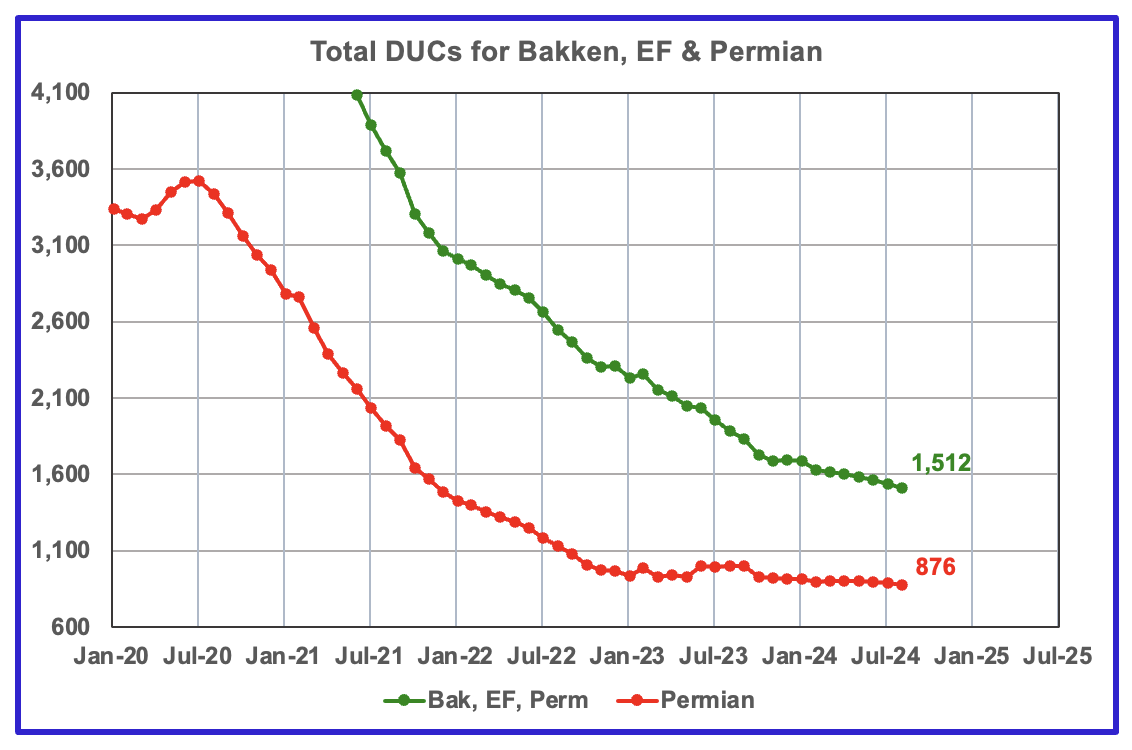
The number of DUCs available for completion in the Permian and the three major DPR regions has fallen every month since July 2020. August DUCs decreased by 27 to 1,512. In the Permian, the DUC count decreased by 8 to 876.
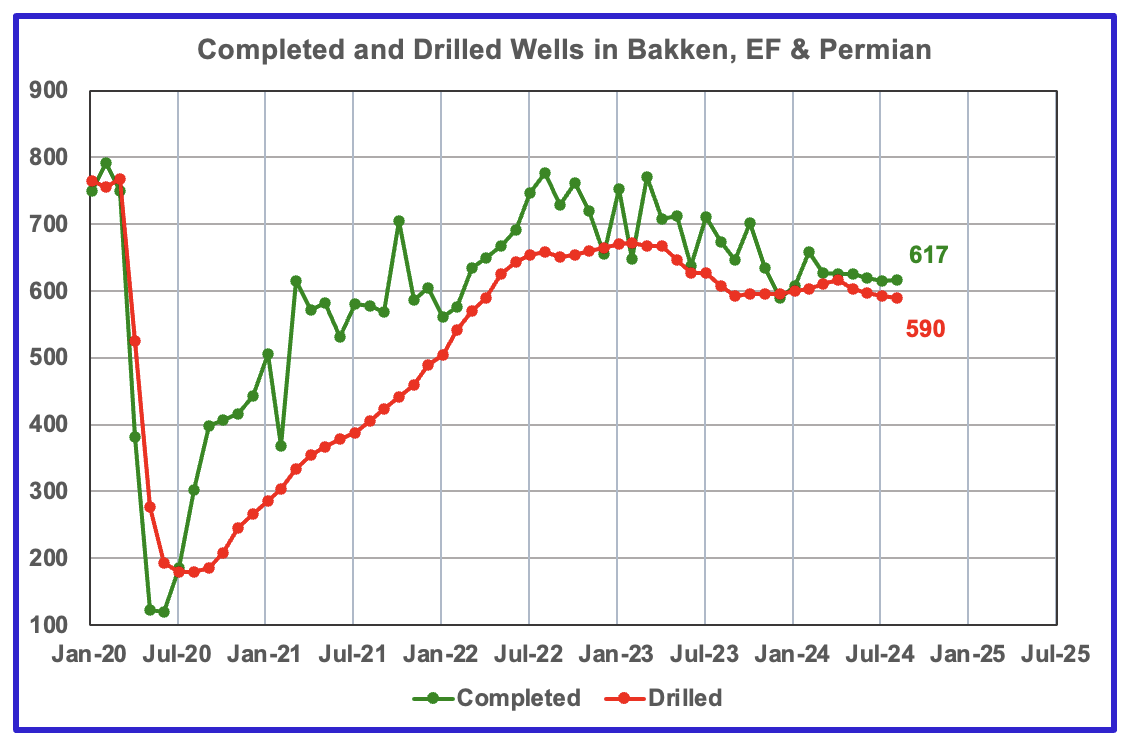
In the three primary LTO regions, 617 wells were completed and 590 were drilled, i.e. an extra 27 DUCs being completed. Of the 27, 12 extra were completed in both the Bakken and Permian. This indicates that there are still some profitable DUCs available.
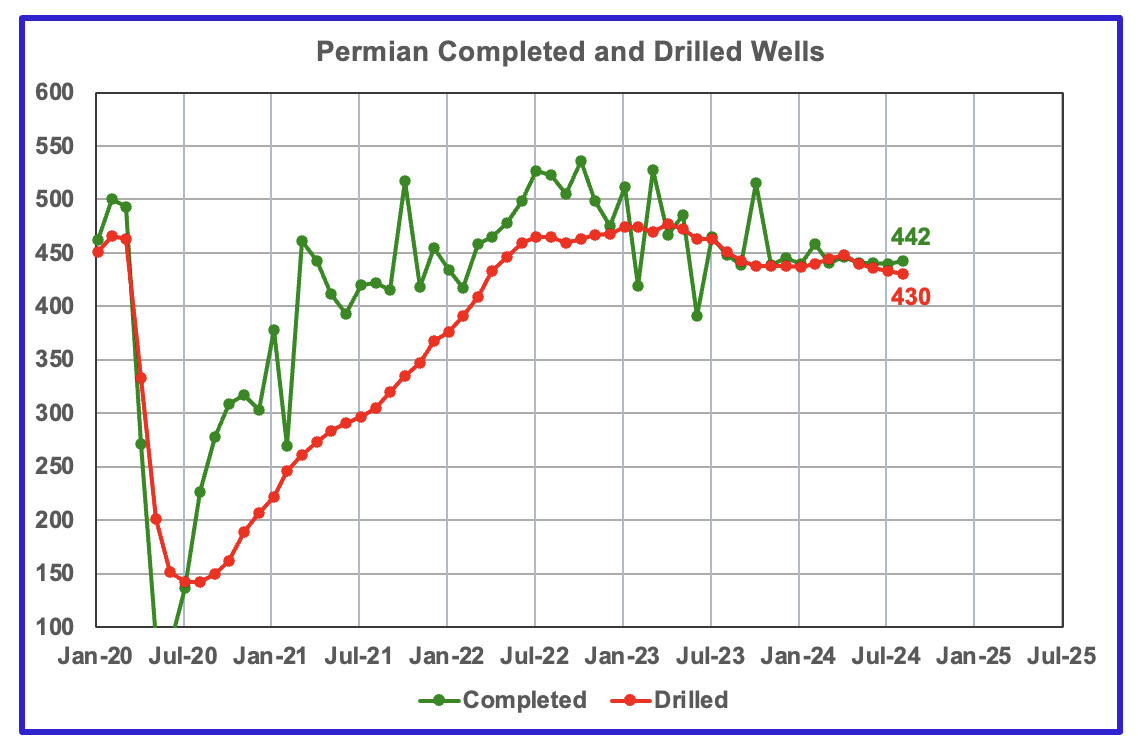
In the Permian, the monthly completion and drilling rates have been both stabilizing in the 430 to 450 range over the last eight months.
In August 2024, 442 wells were completed while 430 new wells were drilled. This is the Fourth month in which the number of wells completed exceeded the number of drilled wells. Based on the DPR Permian chart above. it appears that these extra 12 completed wells are allowing production to stay on a plateau.
137 responses to “US July Oil Production Falls”
Hi Gang, I have just posted a post over on the non-petroleum side. It has nothing to do with oil so that is where it belongs. Nevertheless, I would like for you to check it out.
Thanks, Ron
Ovi,
Thanks for the work.
Top table looks good.
Seems like you will be right and I wrong on ND. (Not/hitting 1.3 by year end.)
UT and OH remain interesting, but small states.
Nony
Thanks. Much appreciated
Right now my focus is on Lea, Eddy and Martin. Just wondering if the data over the next few months will give us a clue how close the US is to peaking. I must admit that I was shocked by Eddy. I knew it would go up. Didn’t expect a new high. Wondering if they hit some really great wells.
1. Yeah, I don’t really follow the county stuff that much. A little too in the weeds for me. Eventually it all comes to a state level. Fine if you do, of course. Just explaining, that I don’t even think about it.
2. I would be a little wary of NM state regulator data, overall or for the county. I suspect they have some of the same issues as Texas RRC. I.e. late submissions tending to make their always look like there was a peak (when it is just slow updating). I worry, you just go down the same road as the RRC worriers:
https://peakoilbarrel.com/texas-rrc-monthly-update/
https://www.eia.gov/todayinenergy/detail.php?id=35492
I don’t know that this is the case, haven’t read you that closely (see point 1). 🙂 But it would be the first thing I checked. I.e. Are you trying to make judgments about 914 inaccuracy based on state data that is actually systemically late?
Nony
1) Lea plus Eddy county is NM production. District 8 is more than half of Texas production, a good proxy IMO.
2) You say that you would be a little wary of NM data. I feel the same way about the initial EIA data. I am not saying it is wrong, I take it for what it is an initial guess based on their methodology. The EIA has an initial correction for the 914 data and a final correction. See my response to Dennis and chart below. It takes the EIA about 6 months to come close to a final update.
I am not making judgement call on the 914 accuracy, I am just saying it has to be corrected twice. I use a different methodology that tries to project where the EIA data will finally end up. If you look at the District 8 chart, you will see the June and July data and the projection of where I think the final production will end up.
Check the Texas and NM charts, note the projections are directionally the same as the EIAs but slightly on the low side. Looking at the chart attached to Dennis’ comment, the EIA sometimes over estimates and some time under estimates.
My main interest in reporting on Permian production is to see if it is really close to peak production. I guess that is why I am getting into the weeds like looking at the counties and trying to make a correlation with drilling rigs. All kinds of opinions are out there saying it is close to peaking. I am looking for evidence that it is near peaking and presenting it to our readers for comments and insight.
Based on Dennis’s comments below, sounds like my suspicion was right. The NM kvetching is a form of the “RRC peaking” delusion.
https://www.eia.gov/todayinenergy/detail.php?id=35492
Ten years later and we are still getting repeats of things that even Ron Patterson has moved on from. Lather, rinse, repeat.
I guess it is at least better than recycling 20 year old Twilight in the Desert scares. 😉
Just a reminder Anon, the peak was six years ago next month at 84,589,000 barrels per day, The production this past June was 81,105,000 barrels per day.
You can start crowing when the world starts producing about 3.5 million barrels per day more than it is now.
Ron,
That’s not even what we are talking about (NM production, not global). I realize there are tribes (peaker and cornie). But it’s important to disaggregate issues, or everything is everything.
Uh…but
1. You called the final peak to be 2015, before.
2. And for that matter, if you look at the historical record, it took us more than a decade to eclipse the 1979 peak. Give it time, baby. 😉
https://ourworldindata.org/grapher/oil-production-by-country?country=QAT~OMN~SAU~NOR~IRQ~USA~ARE~OWID_WRL
That’s not even what we are talking about (NM production, not global).
If that’s not what you are talking about, then leave my name out of it. I only commented on US production before the shale revolution. After that, I have never claimed that the US had peaked. At any rate, I have always only been concerned with world peak. And that was in November 2018. So if you are not talking about world production, then please leave my name out of it.
It wasn’t a general Ron Patterson reference, or a US one. I was referring to your remarks about RRC showing a Texas peak, when EIA did not. The same issue that applies with NM data. So the mention was on point, not just a personal thing.
Oh for Christ’s sake, I always pointed out that the RRC data was always delayed by several months and was displayed as it dribbled in. I thought that should be obvious to everyone, but just in case, I pointed it out to everyone. I never claimed that the RRC data indicated Texas had peaked.
Why in holy hell are you dragging up these ancient posts? Get with the goddamn program and talk about what is happening right now. What the hell did you predict ten years ago? Your post are worthless unless you can post some analysis of what is happening right now and what we can expect in the future.
I believe that Ron is right regarding the peak production in 2018. I recently launched this site, where you can add and exclude countries on the chart. For example, on this chart https://peakoilchart.com/peak-oil-chart?category=4&excluded=236.40 we can observe global production, excluding the United States and Canada. Here, the peak was reached in 2016, but production has not increased since 2005 and, furthermore, it is in slight decline.
I think that my site does not work very well on mobile devices. If you encounter any issues, please try using a desktop or laptop.
Albert, thanks for the post and the chart. I have never noticed it before but we have been on the bumpy plateau since 2005. And, we are now in decline. Hell, we were right all along. 2005 was actually the peak, or it would have been without the shale revolution. Well, damn close to it. But 2018 is definitely the peak.
Thanks, I feel vindicated.
Ron
Ovi,
Note that the EIA does its initial estimate (the 914 estimate) once. The final estimate is just the most recent State data available in August of each year and it is revised each year to whatever the state agencies say it is (except for the most recent 12 to 18 months (varies state to state). The 914 estimate is quite good from Jan 2015 to Sept 2021, the State data for 2022 may get revised over time and the final data may match the 914 data as closely as most of the data from 2015 to 2021. From Jan 2015 to Sept 2021 the cumulative output for Texas and New Mexico state data was 0.13% less than the 914 initial estimate, that is pretty much spot on. It seems likely this won’t change much and the EIA 914 estimate is quite reliable.
The Permian is currently running at a relatively stable rate since spring? I think the highest volume so far this year was March? I checked it the other day but darned if I can remember the exact month in the spring.
Thanks Ovi,
The chart below compares the New Mexico OCD estimate for statewide output with the EIA 914 estimate from Jan 2015 to July 2024. For most months up to Jan 2024 the EIA estimate has been fairly accurate (this uses the intitial 914 estimate and not the final estimate which is adjusted to match the state data). The average for statewide output from OCD for Jan 2015 to Jan 2024 is 965.67 kb/d and from 914 estimate for same period it is 963.46 (0.23% lower for EIA estimate compared to OCD data). I am confident that the EIA estimate will continue to be relatively accurate for Feb 2024 to July 2024.
Note that the output from new wells and output from existing wells in the Drilling productivity metric spreadsheet is now reported as an annual trend, possibly a centered 12 month trend (so it would use the STEO forecast for months from Sept 2024 to Jan 2025 for the August 2024 annual trend estimate).
This is my interpretation of these metrics, unfortunately I cannot find any documentation at the EIA website, so it is a guess, based on playing around with the data for the Permian basin in particular.
Dennis
I have taken a look at the increments added to the EIA 914 survey to get to their final production figures. There is the initial increment to get to the 914 production estimate and then there is the final increment to get to the final production figures.
The attached chart shows that from July 22 to January 24, the EIA added approximately 100 kb/d to the 914 survey to get to the initial 914 production estimate, red graph. The green graph shows the final correction. What is interesting is the dramatic rise in the correction volume starting in January 2024, from 100 kb/d to almost 160 kb/d. The initial and final corrections are the same after January 2024.
What does this sudden rise imply? Does this rapid rise imply the these new wells have a higher IP than earlier wells and that the EIA has to revise its correction factors?
I am also a bit confused by the wording for production in the DPR section. Maybe that is why the new well production and legacy decline don’t match up with the monthly production increment. The earlier DPR reports balanced out every month.
Ovi,
The final EIA estimates are just the state data in July of the most recent year. As you know the state data is revised monthly, so next July it will be different than July 2024, especially for the most recent 24 months. In my chart I showed the 914 estimate which is pretty darn good over the Jan 2015 to Jan 2024 period..
Ovi,
The 914 estimate is the EIA’s intitial estimate (sometimes it gets revised for the most recent 2 months reported, but after that it remains fixed) the EIA final estimate gets adjusted every August when the Petroleum Supply Annual (PSA) is published. The EIA Final estimate is the State reported output in the July before the PSA is published, in the most recent update the EIA Final estimate was updated through December 2023 for New Mexico. It varies by state depending on how quickly their data comes in, for Texas the PSA only has the Final estimate coinciding with State data through Feb 2023 (10 fewer months than New Mexico) because it takes longer for all of the pending lease data to make it through to the PDQ database at the RRC, New Mexico seems to have a more efficient process and also many fewer wells to keep track of than Texas.
Ovi,
Great chart, thanks!
The chart below looks at the percentage difference between 914 estimate and 914 survey (estimate minus survey)/ survey and state data and 914 survey (state data from OCD directly). It looks like it takes about 18 months for state data to be complete.
Ovi. Thanks once again!
I note that ND provides the BOPD per well data.
Are you able to provide that for any other state?
ND Bakken peaked at 144 BOPD per well in 2012, and was at 68 BOPD in July, 2024.
My focus concerns profitability of these wells. So I tend to focus on stats like this.
Not sure if that stat is very relevant to your analysis?
Shallow sand,
The BOPD per well depends on the ratio of new wells to old wells and tells us very little about the profitability of the new wells being completed.
I found an interesting document from the EIA which gives IP180 for various tight oil basins.
https://www.eia.gov/petroleum/drilling/pdf/February_2024_Supplement.pdf
Unfortunately Enno Peters told me he was leaving Novilabs as of the end of Sept 2024 and he did not expect there would be any more of the type of oil and gas updates he had been doing so we have lost an important resource for trying to analyze tight oil. It was nice while it lasted.
That’s too bad, Enno is great! I wish him well.
I wasn’t referring to profits on new wells only.
The old wells need to generate cash for the new ones to be drilled. Or need to be sold to someone else to generate cash for new wells.
Not sure how sub 25 BOPD wells generate a lot of cash for new wells plus the dividends that now seem to be required by investors?
Take a 25 BOPD well at $65 well head oil and negligible gas income with a 25% royalty burden. Maybe nets $200k annually?
That has to affect the number of new wells drilled, given every year there are more and more of those sub 25 BOPD oil wells and less and less (in percentage terms) of the 100 BOPD wells.
Shallow sand,
I suppose we could look at all tight oil wells and do an industry wide analysis. As of Dec 2023 the average tight oil well in the Bakken produced 66.4 bopd. There were about 19000 wells so about 1253 kbopd. In the Permian basin the average tight oil well produced about 117 bopd with about 47.5k wells completed as of Dec 2023. At a price of 75 per bo figure a third to royalty and taxes, leaving 50 and another 20 for costs leaving $30/b on 5600 kb/d output, so about 168 million of net revenue per day or 5040 million dollars per month. Figure 12 million per well and that allows 420 wells to be completed per month from net revenue. I have not accounted for natural gas and NGL revenue in this analysis and costs may not be right. Somehow these companies are finding a way to make it work, it is a bit of a mystery as it looks to be a low profit treadmill with a high risk of losing money.
SS
I do have it for Lea and Eddy county. Can’t do it now. Check back later.
SS
I just re-read your message and I don’t know where my head is these days. Somehow I was reading your message and I thought you were looking for the amount of water being injected into wells to produce oil.
I do not have well data for Lea and Eddy counties.
World C+C data is out through June. World C+C down 300K. Russia C+C down 142K. I am sure Ovi will have a world post out in a few days.
This US post today was fantastic. Thanks Ovi.
Click on chart to enlarge.
I was thinking about posting a link to a Simpsons clip on youtube suitable for the situation but changed my mind, this is rather serious.
Many thanks to the crew.
The Rig Report for the Week Ending October 4
– US Hz oil rigs dropped by 4 to 436 and are down 23 rigs from April 19. They are up 9 from 11 weeks ago.
– The Texas rig count added 1 to 241.
– Texas Permian rigs added 1 to 197 while the New Mexico Permian dropped 3 to 93. This is the second week in a row that the New Mexico Permian has dropped 3 rigs .
– In New Mexico, Lea dropped 2 rigs to 48 while Eddy dropped 1 to 44.
– In Texas, Midland dropped 1 to 24 while Martin was unchanged at 30.
– Eagle Ford was unchanged at 41.
– NG Hz rigs added 3 to 85.
As noted above, in New Mexico, Lea dropped 2 rigs to 48 rigs while Eddy dropped 1 to 44.
However note how both counties have entered into a new rig downtrend.
Frac Spread Report for the Week Ending October 4
The frac spread count dropped by 2 to 236. It is also down by 24 from one year ago and down by 36 spreads since March 8.
There are many countries that have reached or past their oil production peak due to simple geological factors. However many countries put into this group have declining oil production which is nothing to do with geology.
Experts looking at Iraq say that if Iraq had been run by a peaceful democratic government over the last 30 years it could easily be producing 7 million barrels per day. Various factors such as wars, corruption and embargoes affect many other countries. Venezuela is another obvious candidate which has been economically destroyed by a brutal and corrupt regime. It could easily produce 4 or 5 million barrels per day if it had been run by a decent government over the last 30 years.
Same can be said for Iraq, to a lesser extent Libya, Nigeria, South Sudan, Lebanon, Russia. Violence, corruption etc has effected so many oil producing countries that it can be argued that now above ground factors are more important then geological ones.
Then you also have environmental laws restricting drilling such as in Europe and Canada.
The world could probably produce another 15 million barrels per day if it really needed to.
https://en.wikipedia.org/wiki/Arctic_Refuge_drilling_controversy#/media/File:Northern_Alaska_National_Wildlife_Range_(ANWR),_Coastal_Plain_1002_Area_(41004364390).png
Let my people drill!
https://www.youtube.com/watch?v=fHbC8Nhd46s
Loads of oil,
If you mean C plus C output, I am skeptical that we could reach 96 Mb/d. I also doubt that demand for oil will reach that level. I expect we might reach 85 Mb/d by 2027 or 2028, might maintain a plateau for 2 or 3 years and then we are likely to see demand for oil decline. Difficult to know for sure. I expect World URR for C plus C will be around 3000 Gb.
Dennis
No, it would take the governments in Venezuela, Iran, Russia, Nigeria and several others to be overthrown. It would require corruption and theft and incompetence to be eliminated in countries such as Mexico, Egypt, Libya, Brazil, Angola Iraq etc. it would also require unrestricted production in Canada, Europe and The U.S.
So a global geological and political peak will probably be at around 85 million barrels per day.
“So a global geological and political peak will probably be at around 85 million barrels per day.”
November 2018
Paul,
Do you have a link to that quote?
Paul,
I tend to focus on the 12 month average output rather than single month records. So far the 12 month average peak for World C plus C is about 83 Mb/d in 2018. Back in 2018 when we wrote the book my best guess was about 85 Mb/d for the 12 month average of World C plus C. At the time I did not foresee the pandemic in 2029-2021, currently I expect we might surpass the 2018 peak, but probably more like 84 Mb/d, perhaps less.
Dennis, I was just quoting LoadsOfOil above
https://peakoilbarrel.com/us-july-oil-production-falls/#comment-781754
Not really sure what LOO is arguing about if LOO suggests 85 is peak.
“Back in 2018 when we wrote the book my best guess was about 85 Mb/d for the 12 month average of World C plus C.”
Recorded for posterity as Figure 9.15 in a scholarly fashion 🙂
Another chart posted on this thread was one we did assuming estimates of discoveries from TOTAL. This placed it at ~74 but that was extrapolating from an oil industry source only.
[i]So a global geological and political peak will probably be at around 85 million barrels per day.[/i]
No choice for the inhabitants of Florida, California (and a few other places worldwide)
Soon they will drill the Arctic: that seems a necessary insanity
The world is facing a runaway climate change
Said Chicken Little.
Ervin,
The risk of severe climate change is very real.
Some information from climate scientists at link below
https://www.realclimate.org/
Runaway may be an exaggeration but not climate change itself. RealClimate.org is good but I am always giving them a hard time. This is a comment I have in moderation
https://github.com/orgs/azimuth-project/discussions/6#discussioncomment-10923280
The question is how much in terms of fossil fuel resources the world will burn and water cooling is needed before they figure out the patterns of natural climate change.
Should switch to the other thread for this discussion. The head of climate science division at NASA, Gavin Schmidt, is frankly embarrassed that they can’t explain last year’s heat spike that’s continuing into this year:
https://e360.yale.edu/features/gavin-schmidt-interview
“Schmidt says that scientists still can’t explain the unexpected spike in temperatures. When I talked with him recently, he called the continuing confusion “a little embarrassing” for researchers.”
Temperature spike
Loadsofoil makes assertions that aren’t backed up in a scholarly fashion.
Paul,
Perhaps correct. Consider output at 95 Mbpd for C plus C, that is 34.7 Gb per year. My Shock Model (yours really) has World cumulative output at about 1700 Gb by 2030, if we guess that World URR is 4000 Gb (high end estimate from USGS) that would leave about 2300 Gb of remaining reserves which could potentially last 66 years at 34.7 Gb per year, if we only have 1300 Gb of remaining reserves they would be gone after 38 years at 34.7 Gb per year. Based on the oil price it doesn’t look like we will be seeing 95 Mb/d of C plus C output in the near term, and longer term demand for oil probably starts to fall.
He listed several factors. It was a decent post, in that effect. Obviously it is not verifiably true, like a Euclidean theorem. But I think “scholarly” is sort of an odd request.
I mean…Dennis’s poster for the Permian ended up shifting by 2x in EUR, the month before he presented it. That’s a method with some extreme dependency there…rather catastrophically sudden change. Was it scholarly? I donno. Not sure the poster was a paper. But a poster itself is I guess sort of academic. But regardless of the “shock” fancy terminology, the key feature of the model is just taking the USGS EUR and slightly shading it. And if it changes (and has often), you get a significant change to output. And we can hear the blabla about how USGS has converged. Maybe, maybe not. But even then Dennis didn’t wait for it to converge or know when it had. Since he went ahead with his model BEFORE USGS had shifted.
Oh, FWIW:
Iraq: 2
Iran: 3
SA: 2 (they have decades of oil, they could pump it faster, even if some infrastructure investment required, they don’t bother because of price control)
AK: 2 (done it in the past and there are massive amounts of land offlimits to drilling, right now.)
CA(nada, tar sands and piping heading it to the Gulf at therefore good transport costs: 2
VZ: 3
LI(bya): 1
——————
That’s 15 right there. Oh wait…I don’t have some “shock” mumbo jumbo model. Oh…and I didn’t write it up for Physical Review Letters. 😉
Nony,
And does it seem a realistic scenario that all of those increases would occur and that there would be no decline in output elsewhere. Is it your expectation that it would happen everywhere simultaneously? What would be the likelihood in your view? Trump held an auction on ANWR 1002 areas and there were part few takers. This is federal land and whether to drill or not is up to the US as a whole, not Alaska.
There is also the question of demand for oil. The USGS assessment on the Delaware sub-basin was released 6 days before my poster was presented. I underestimated Delaware TRR as I had no information on this prior to the assessment done in early Dec 2018, I corrected when the new information was available, that is how science is done. Unlike others I have never claimed omniscience.
Dennis,
I read his comment and considered it hypothetical what-ifs
Iraq: So what if it was at 7 MB/day? Maybe like Saudi Arabia it was a prosperous country, they’d be using 1/2 of it to power Baghdad’s air conditioning. They’d be at the same point as now.
Venezuela: Somebody would be refining heavy low-grade oil. Who?
Libya, Nigeria, South Sudan, Lebanon, Russia: Lebanon??? Sorry, the commenter is not serious.
I think it’s correct to say that the world is not producing as much as it theoretically could due to political problems in a whole slew of supplier countries. How much is hard to measure of course.
On the other hand, reduced production isn’t keeping prices particularly high. Maybe higher prices driven by more demand would provide more incentive to producers to overcome political issues. It would certainly reduce the tendency to embargo producers.
It is also possible that fewer political problems on the supply side would increase production enough to drive down prices, reducing the incentive to produce.
Political problems on the supply side may in part be a function of weak demand. At any rate we don’t see net consumer countries marching into producing regions to seize the oil WWII style. So despair hasn’t set in.
It is interesting to see that world population is approaching peak earlier than previously forecasted, perhaps as early as the 2040’s. China is said to have peaked last year.
And this is happening before any limiting effects of oil depletion [high prices, shortage of physical supply, or loss of maritime free trade].
Perhaps oil shortage won’t force population down, for the short term anyway.
Paul
According to your scholarly articles in The Oil Drum that you published around 2010, you asserted that global oil production would have fallen to 60 million barrels by now.
It is far better to read a variety of articles written by experts than to conduct so called scientific calculations based on false assumptions.
Loo, It’s true. Fracking was not well known at the time. Same with tar sands production from Canada. All the creative book-keeping in what constitutes “oil equivalent” wasn’t well known. As always, nation-state-owned oil companies tend to keep mum because they can.
Look at the 60 MB/day number now in context. The USA is apparently the #1 crude producer despite it producing much less than the 20 MB/day than it consumes.
As of October 2023, the top 10 countries extracting only crude oil from their territories are as follows:
United States – 11.1 mb/d
Russia – 9.9 mb/d
Saudi Arabia – 9.1 mb/d
Canada – 4.3 mb/d
Iraq – 4.0 mb/d
China – 3.9 mb/d
United Arab Emirates – 3.1 mb/d
Brazil – 2.9 mb/d
Iran – 2.4 mb/d
Kuwait – 2.4 mb/d
These figures represent the average daily production of crude oil, excluding other forms of petroleum liquids like natural gas liquids (NGLs) and condensates. The data reflects each country’s extraction within their own territories and does not account for any production from international ventures.
That’s 53.1 MB/day
the next 10
Nigeria – 1.9 mb/d
Mexico – 1.8 mb/d
Norway – 1.7 mb/d
Angola – 1.3 mb/d
Algeria – 1.3 mb/d
Kazakhstan – 1.2 mb/d
Qatar – 1.1 mb/d
Oman – 0.9 mb/d
United Kingdom – 0.9 mb/d
Libya – 0.8 mb/d
That’s another 12.9. Norway knows the writing is on the wall, and they are going all in on EVs, despite their production level. UK just shut down their last coal and realize crude oil is next. Mexico has a climate scientist as president and who knows what’s going to happen there.
Which brings it up to 66 MB/day for the top 20.
Who cares about the rest — they are all below 1 MB/day. They will never be major oil producers apart from perhaps Venezuela when things get more desperate.
So please comment in an anonymous fashion some more … on stuff I did before 2010, with zero funding.
Peakers: Where the heck are you going to get more oil from?
Cornies: New technologies or regions.
Peakers: Which ones?
Cornies: I donno. They will be new.
Peakers: I laugh at you. You cope.
——-
[Ten years later]
Cornies: Hey, you peakers were wrong about the old peak call.
Peakers: Yeah, but there were some new technologies and regions that we didn’t foresee.
—-
And the funny thing is even WHEN shale was known and growing, the peakers were all over themselves to talk it down AS it was growing. Art Berman, David Hughes, Piccolo, Rune, etc. etc.
We all know that the Green River formation in the Rockies contains a trillion in the oil shale, but the EROEI is so low that it will amplify the CO2 emitted into no-man’s land. So figure out how to magically do it emission-free, and w/o draining the Colorado River in the meantime.
… developing convolution models to illustrate how the Red Queen process plays out. And here we are, several years later and the Bakken in decline. Described in Mathematical Geoenergy, Chapter 9, published in late 2018.
Nony,
The EIA also underestimated tight oil output. Here is L48 (including GOM) estimate from EIA’s Annual Energy Outlook in 2010.
Loads of Oil and Nony,
Another chart with AEO 2010 for L48 including GOM for different cases. It was not only peak oil people who did not anticipate the tight oil boom in 2010.
Why would Petroleum Engineers predict there own demise? They don’t want to show dismal projections of crude oil production — instead they keep their heads down and keep at what they are paid to do, Yet, other factors come into play, such as climate change, and schools such as Stanford U that decide to eliminate their Petroleum Engineering degree. This is all so predictable, but you won’t get this from people internal to the system — only from outsiders or from the inexorable market forces anticipating changes.
Paul
That is a really long way of saying you were wrong. 🤣
20 million barrels per day wrong
Fact is real oil people who knew more than you were already talking about the possibility of tight oil and other areas if the above ground factors were right. They knew what they were talking about. You did not.
Direct quote from EIA
“EIA is not able to determine precisely how much of the crude oil exported from the United States is produced in the United States because some of the exported crude oil may originally have been imported from other countries, placed in storage, and then re-exported. The United States also produces and exports petroleum products, but EIA is unable to precisely track how much of these petroleum exports are made from domestically produced or imported crude oil. Also, some of U.S. crude oil exports are refined into petroleum products in other countries, which may be exported back to, and consumed in, the United States.
EIA’s data for 2023 indicates that U.S. total petroleum production averaged about 21.691 million barrels per day (b/d)“
Wasn’t sure what you were referring to,, but now realize that it is estimating what the current global crude oil production level is based on historical data only. The scholarly citation is from Mathematical Geoenergy, published in late 2018. The crude oil discovery data from TOTAL SA extended by a dispersive discovery extrapolation was fed into the oil shock model. This is not off by 20 million barrels per day.
BTW, perhaps you are having trouble understanding what applied mathematics is all about. It’s just what it says — applying appropriate and perhaps innovative mathematical methods to analyze or solve real-world problems. The book is foremost about sharing these ideas, and placed in the context of the real-world problem of fossil fuel depletion. That was the rationale proposed to the publisher, John Wiley, and what they used in making the decision to publish. As Dennis frequently says, these models will always be wrong, but we can always update to reflect current conditions.
Another Chart from Mathematical Geoenergy published in 2018, Figure 9.15 on page 141 of book (book has a misprint for C plus C minus XH minus LTO URR, this chart is correct.
The peak is about 85 Mb/d in 2026-2028 for this scenario.
Click on chart for larger view.
We did not foresee the Global pandemic which began about 12 months after the publication of this work, the scenario was done in April 2018.
Thanks Dennis.
Yes, that correction is on the book’s Errata web page (2800 mis-labelled as 800)
https://geoenergymath.com/errata-page-for-mathematical-geoenergy/
In retrospect this is obviously a much better estimate than basing on the TOTAL SA discovery numbers,
Paul,
Note that the Total Discovery numbers were probably conventional oil only, the green dashed line which excludes extra heavy oil (produced in Canada and Venezuela) and LTO produced in the US matches pretty well with the estimate in figure 9.13.
Dennis, Just learned that the publisher Wiley got a $44M deal to input academic books to LLMs . Claim “it is in the public interest for these emerging technologies to be trained on high-quality, reliable information.”
https://www.thebookseller.com/news/wiley-set-to-earn-44m-from-ai-rights-deals-confirms-no-opt-out-for-authors
Some Wiley authors are upset by this but not me. It seems a benefit for getting some adoption of ideas such as the Oil Shock Model, etc.
Load of Oil it is true that geology is only one of the limits to production. The human (mis)management factor is huge and if anything will become a bigger impediment to production over time.
But maximal is not the same as optimal, despite what humans tend to think.
Actually it is probably a good thing to have a lower level of production that could last longer. Much lower and much longer. But we don’t have good management of these kind of things.
And we certainly don’t have equal opportunity to purchase and consume. I expect that the current patchy market condition will get much less uniform over time. Houthis with drones and cruise missiles being just one small example of the forces at play.
Well take your word for it!
I just saw an interesting youtube video by Christine Guerro. Titled the Perian’s Watershed moment, it discusses a peak oil idea that’s been brought up here before, salt water disposal and earthquakes.
https://www.youtube.com/watch?v=E0WImM0l3rA
It seems well reasoned and insightful argument of why we are at a point where increased limits on produced water disposal should be merited given the risks of increased seismicity. I don’t see the state regulators agreeing until the politics changes there.
I’ve had a heated discussion with a seismologist that claimed the lubrication is more critical than the fracking impulse itself. The liquid lowers the critical threshold as opposed to boosting the force necessary to trigger an earthquake.
I’m not a geophysicist, but his is the normal explanation that you hear. That’s what state regulators think. But if you know better, will be some heavy burden of proof to show it. Maybe write a paper (or several). In good journals.
Perhaps you want to do a controlled laboratory experiment like they do in mature scientific fields. Instead, it’s all conjecture based on a combination of statistical inferences and educated guesses. Fracking in this situation is an uncontrolled experiment — unrepeatable with countless degrees of freedom.
BTW, there’s no such thing as a proof in physics. Proofs only exist in math.
Paul,
If you come in from left field (not a geophysicist) and start making arguments about that field, you’ll need to demonstrate your case, strongly, to get taken seriously. Nobody needs to consider you, unless you do that. Right now, nobody in Stanford Ph.D. petroleum engineering is studying the “WHUT methods”. They are blogosphere chatter (and some very meager and low impact publications).
I have asserted several times in the past** that the days of a “petroleum engineering” degree are numbered. Stanford now only offers a degree in “Energy Science and Engineering” https://majors.stanford.edu/majors/energy-science-and-engineering. It’s offered in the Doerr School of Sustainability where also can study Earth & Planetary Sciences or Geophysics as well.
** If you want to search for when I said that, go ahead, I have a citation ready.
You can still get the Ph.D. in petroleum engineering at Stanford:
https://web.stanford.edu/dept/registrar/bulletin1112/5029.htm
But in any case, you are not a serious scholar in geophysics or petroleum engineering. Don’t have the knowledge/training, don’t publish high impact papers in good journals, don’t have an R1 teaching post. I know Academia, dude.
Why don’t you call up Stanford and see if it’s still valid?
“This archived information is dated to the 2011-12 academic year only and may no longer be current.
For currently applicable policies and information, see the current Stanford Bulletin.”
Nony,
the Petroleum Engineering program is no longer listed for 2024-2025 at Stanford, but one can go to Texas for that.
Looks like there might only be 9 PhD programs for Petroleum Engineering in the US as of 2025.
https://www.collegefactual.com/majors/engineering/petroleum-engineering/rankings/best-graduate-schools/doctorate-degrees/
OK, Stanford doesn’t have a named PE program any more.
Paul, you are still not a serious scholar in the geosciences or engineering. Lack the training, don’t have a job in it, and have a very low/fringy publication record. I know academia. I know h indices. I know piled higher and deeper. You are so incredibly far from being a player in this area. Nobody in industry takes you seriously. Nobody in academia.
” have a very low/fringy publication record”
So why aren’t you going on https://PubPeer.com and critiquing and debunking and falsifying my publications? That’s what it’s there for — if you believe something is wrong, you can make a case and the publisher or author can decide to retract.
Loads of oil.
At the time many thought URR would be in the range of 2000 to 2500 Gb. That proved to be too low. It is possible 3000 Gb will also be too low if future oil prices rise.
Hideaway and JT,
I have watched the events of the past two weeks unfold as the the usual suspects can quite see to comprehend what you both are pointing out in rather clear English; that is at least my understanding. Maybe it is an Upton Sinclair moment for some, not wishing to understand something as their salary depends upon them not understanding it.
Try as hard a we might there seems to be a thorough misunderstanding on the first and second laws of thermodynamics. If they cannot cope with the first and seconds laws then thy have no hope on the third.
I am not against unreliables (in fact I have a rather complicated tracking PV array) but I fully accept their limitations. I have repeatedly stated that they are not the solution to mankind’s electrical energy needs for the future; and that a rapid build out will only get us to the cliff edge sooner.
In the EU, where I live, the reality of unreliables leading to astronomic delivered electricity pricing is all too apparent., and the adoption of BEV’s is stalling as the limitations of BEV’s and charging are all too real..
We have many critics who are unable to provide proofs of the cost competitiveness of unreliables (aka Wind and PV) at grid scale.None has yet to come up with realistic options for the production of base petrochemicals, which will be required in large amounts to build and maintain these unreliable means of power generation.
Few new technologies make it to market. Wind and Solar has only been possible because of subsidies- big subsidies. PV might work at Latitudes of 30 degrees N/S but never is the cost of storage or grid inertia taken into account.
Over my 46 years in the oil, gas and petrochemical business I turned from an optimist to a sceptic with good reason. I saw many projects come across my desk, few of which has any chance of commercial success. Some were pseudo perpetual motion processes.
I will close with this short video from Carl Sagan – a very clever and astute scientist, but he also had his critics. The title says it all
https://fee.org/articles/carl-sagans-final-warning-on-the-importance-of-scientific-skepticism/
Footnote: A coal heap is a much cheaper and more reliable source of electricity storage.
“Footnote: A coal heap is a much cheaper and more reliable source of electricity storage.”
There is a lot of truth in that, especially if you have domestic supplies of decent grade.
But everything at human industrial scale has its downsides.
For just how long is the experiment based primarily on coal combustion survivable?
Hickory, Carnot never said nor did he imply that electricity should be primarily based on coal. He was just point out the simply fact that power from coal is cheaper and more reliable than 50 trailers of lithium batteries. On this issue your not to be confused by the facts
Ervin, I believe you misunderstand my comment. I understand what he was saying about coal, and was not arguing against it.
Carnot,
The Earth System has a substantial input of energy from a nearby star. The energy can be utilized to counter the effects of entropy. In a billion years or so the planet will no longer have enough water to support life, in the next few million years humans may be able to survive if we get greenhouse gas concentrations down.
Dennis, this is garbage …. ” The Earth System has a substantial input of energy from a nearby star. The energy can be utilized to counter the effects of entropy.”
We have to mine minerals and metals, then build machines to harvest the sun’s energy. It does not counter the effects of entropy. The building of these machines is an increase of complexity by using fossil fuel energy to build them.
They then suffer from entropy, just like everything else, so have relatively short lifespans.
Meanwhile we have used up more high quality energy to build them and added more CO2 to the atmosphere in the process. If anything they hasten the process of entropy…
Hideaway,
Consider a deck of cards in a specific order thrown on the floor. The entropy of the disorganized deck of cards can be reversed by the expenditure of energy to put the deck back in the previous order. Solar energy can be utilized in the same way. In fact, it is the source of the reduction of entropy that is a living organism. These are basic facts. As to how thing will progress for the Earth system over the next million years is difficult to predict. Many scenarios can be imagined, an infinite number. There will only be one that is correct, odds of choosing the correct scenario is zero.
Dennis …. ” Solar energy can be utilized in the same way. In fact, it is the source of the reduction of entropy that is a living organism.”
Dennis within the overall process of entropy, there are areas where complexity increases for a period of time, before returning to the overall energy gradient decline of entropy.
Dennis … “The entropy of the disorganized deck of cards can be reversed by the expenditure of energy to put the deck back in the previous order.”
This is ridiculous, it doesn’t matter how much solar energy there is or any other type of energy there is, the cards will not go back into order by themselves, you need an organised complex entity to pick them up and reorganise them.
Energy has to go into the construction of whatever entity re-organises those cards.
You continue to look at only the energy that is used in the process and never in the building of the entity…
We have used many millions of years of stored energy to build our modern world. In the process we have used untold other energy used by Earth’s processes to partially concentrate metals and minerals for us. We’ve used all the most concentrated forms of metals, minerals and fossil fuels first, now only have the lower in organisation ones left.
We never count the ancient energy used over billions of years to concentrate metals and minerals to the much higher levels that we used to build our modern world, which is why we now do have to pay a higher energy cost as all the metals and minerals left are less organised, as in lower concentrations…
Hideaway,
The Earth system has not always had complex living organisms, the energy input from the sun has allowed a decrease in entopy. The fact is it is only for an isolated system (universe for example) that the second law of thermodynamics applies, the Earth system is not an isolated system.
Dennis,
You said: The Earth system has not always had complex living organisms, the energy input from the sun has allowed a decrease in entropy.
Not sure what that means exactly. Photosynthesis has used the sun energy which eventually lead to complex life, even though the Cambrian explosion still remains a mystery.
I assume you mean life = lower entropy. While this is probably true, it is more complex than that. For e.g. there is a window of opportunity for life to procreate to lower entropy via reproduction. Specifically for humans say from the first period to menopause. Because entropy is increasing and why we get old and the surrounding environment is constantly working hard to turn our bodies into thermal equilibrium.
So again simplistic views like the earth is an open system because the energy from the sun is reducing entropy is misleading for me.
Entropy seems to be always increasing hence it is defined as the arrow of time. Life has created the ability to procreate to “cheat it”. Even with that, extinction level events and competition etc has made 99% of all the species that lived on the earth to go extinct.
Humans have the special ability to utilise energy to decrease entropy for our specific needs which is the basis of civilisation. The way i think of civilisations “entropy” is via the environmental destruction we cause in terms of garbage dumps, pollution, mines, oil spills, deforestation etc etc.
One of the more interesting things to come out of this is, if life by definition is reduced entropy. Then as we go back in time in the universe entropy decreases, with the beginning of the universe being the lowest state of entropy. Does that mean life would have been abundant then ? Probably not.
Hence there is a contradiction there. Possibly an error with the definition of life = lower entropy but yea i don’t know.
Iron Mike,
I am thinking of entropy in a non-rigorous way as randomness or disorder, a living organism has some order in how molecules are arranged and the life cycle of a species allows this created order to exist while the species survives while physical laws are obeyed. The point is a rather simple one, in a system that is not isolated and receives energy from some external source, entropy for the system in question can decrease as the energy can be used to reverse the natural tendency for entropy to increase.
Yes organisms age and die and species become extinct, but for the Earth system for the last 3.5 billion years life has continued on the planet in some form (based on article below.)
https://en.wikipedia.org/wiki/Earliest_known_life_forms
Dennis,
Again, a very simplistic view. By that logic all the planets in the solar system are open systems hence they should have life. But they don’t. Things are much more grey than black and white.
The conditions were right here no one knows whether it was abiogensis or panspermia or whatever it was that kicked off life. But life managed utilise the suns energy, or thermal energy from underwater volcanoes to reproduce. Again to “cheat” entropy, it was the only way around it.
It is all good and well to sit in a thermodynamics class and draw boxes with arrows and equations, but when it comes to real life it gets much more complex than that. And nature seldom complies to our definitions.
Iron Mike,
Do you disagree that it is possible for the entropy of a system to decrease when there is an input of energy to the system? Obviously life seems to be a special case as we don’t have empirical evidence for life elsewhere in the Universe. Energy is likely a necessary, but not sufficient condition for life to exist. Also although we have no evidence there is life on other planets doesn’t mean that we know there is none, it is unknown.
Dennis,
Do you disagree that it is possible for the entropy of a system to decrease when there is an input of energy to the system?
Firstly in my physics classes we strictly defined a closed system as one in which energy can be exchanged but not mass. Which is similar to the current conditions of the earth. So i don’t see earth as an open system.
However i don’t disagree with that part of the system receiving energy can reduce entropy, even though the overall system has increasing entropy.
Consider an open system like refrigeration so the reduction of temperature (and humidity) in the compartment is reduced entropy. But the overall process net entropy always increases as the inputs and efficiency is taken into consideration.
The earth is not refrigeration, it is a completely different and much more complex bag of worms.
Discussing entropy in this way never allows much room for specific configurations to analyze quantitatively. That’s why thermodynamics was formulated, and statistical mechanics to show how it relates to a finer, even quantum mechanics, scale.
For example, the amount of energy to create the order in a defect-free crystalline semiconductor is enormous for the amount created, and to quantitatively calculate the disorder accumulated as a byproduct of energy needed but generated elsewhere is an impossible task.
IRON MIKE —
Firstly in my physics classes we strictly defined a closed system as one in which energy can be exchanged but not mass.
The term is isolated system.
https://www.wikiwand.com/en/articles/Thermodynamic_system#Isolated_system
Such systems don’t exist in reality, except for the universe as a whole. A theoretical isolated system tends towards thermodynamic equilibrium.
Alim,
No an isolated system is one in which neither energy or mass can be exchanged.
IRON MIKE
Which is what we were talking about
Carnot
I fully agree.
“Some were pseudo perpetual motion processes.”
Without a solid understanding of thermodynamics people base their belief on Popular Science. I’ve spent 40 years involved in some form of thermal transfer systems and understanding mass flow and phase change. The basic laws are simple and never change.
JT,
Air conditioner or heat pump, are these possible? How does that happen? Energy input to the system. Same applies to the Earth system, large electromagnetic radiation energy input from about 93 million miles away.
Obviously your field of vision is very narrow Dennis. The power required to run AC and heat pumps increases entropy. The net effect is times arrow it only runs one way. Low to high. The entire universe operates in decay. In theory the universe will eventually reach heat death. Meaning that once all transfer is complete there is no temperature differential that has created our present circumstance. Even the Bible knows more about entropy than you do.
Ps 102:25,26
Long ago you laid the foundations of the earth, And the heavens are the work of your hands. 26 They will perish, but you will remain; Just like a garment they will all wear out. Just like clothing you will replace them,
So several thousand years ago long before we learned about thermodynamics it was understood that the universe is in a state of decay by this Bible writer. I think anyone here that understands science will agree there is no stable state. Not from a purely physical perspective.
Isa 45:18
For this is what Jehovah says, The Creator of the heavens, the true God, The One who formed the earth, its Maker who firmly established it, Who did not create it simply for nothing, but formed it to be inhabited: “I am Jehovah, and there is no one else.
In the absence of the above Hideaway Carnot HHH and myself are completely correct this present system is in collapse it is a mathematical certainty.
Our hope is based on a promise of someone far greater than we can possibly imagine.
Ps 37:29
The righteous will possess the earth, And they will live forever on it.
I don’t think it’s enough to still have oil, coal, natural gas in the ground and renewables.
Everything we do is based on the concept of more. The monetary system that allows us to have more. Via growth comes to an end when said growth stops.
Try to imagine a world where borrowing money from the future is no longer a thing.
No bank will lend money when there is a 100% certainty it will not be paid back. No money to be made by lending money.
Government stimulus will cease to have any effect. It doesn’t matter what China’s government comes up with to stimulate the economy. Without a surplus of energy to use beyond what is already being used. There is no growth there regardless of whatever talking heads say about their GDP numbers.
China’s money supply is in deep contraction. Remember this is a command economy not a free market economy. The energy needed to make new loans is simply not there.
Stimulus implies higher GDP and more money leaving China to buy all the stuff they import. Who exactly is going to be buying the new production? If there was available energy it would just lead to an over supply market and lower prices as they are forced to dump their products on the market below cost.
We can cut interest rates here in the US and over in Europe. That doesn’t mean more loans will be made. There has to be energy available to use in order to stimulate the economy.
Low interest rates are a sign of tight monetary conditions. I’d argue monetary conditions are tightening because lack of energy to grow with.
When the Permian production heads lower. And US oil and gas exports head lower. It’s going to equal tighter monetary conditions. Not just here in the US but to every country who is receiving the oil and gas.
I’m going to use Mexico as an example. 80% of Mexico’s electricity is produced from natural gas. 90% of the natural gas used to make the electricity comes from pipelines via Texas.
If the flow of natural gas to Mexico slows due to the Permian rolling over and AI data centers and EV’s here in US. Monetary conditions in Mexico will tighten dramatically as businesses are forced to leave Mexico due to lack of energy.
But before those businesses left they’d face dramatically higher electricity costs and a plummeting peso.
HHH,
There is plenty of energy, the World economy is growing in real terms and energy prices are relatively low because supply is adequate to meet demand. Perhaps in the future we will be short on energy, I doubt it as solar, wind and batteries will ramp up faster than the decline in fossil fuel, nuclear power could supplement if needed (I don’t htink this will be necessary, but it remains possible).
Dennis,
China will be at net zero carbon emissions long before their 2060 target. As they won’t have a domestic source of coal after about 2050.
Their domestic oil production will be gone sooner than 2050. Kazakhstan where China imports uranium from has roughly 40 years of uranium left. That is at current production. If you ramp up nuclear energy it’s less than 40 years.
If everybody ramps up nuclear the global 90 year supply of uranium will be gone in a lot less time. Only good I can see is nuclear weapons would be dismantled in massive numbers to meet demand.
And please don’t talk about uranium in sea water or any other non economic sources.
The energy needed to grow from our current lofty standards doesn’t exist.
Indonesia has about 48 years of coal reserves left at current rates of extraction. They can and will ramp up extraction so they can ramp up aluminum and nickel production for EV’s.
We are going to ramp up use of fossil fuels to buildout renewables that we can’t replace after about 20-30 years from now.
HHH,
Solar and wind rely on energy from Sol, this energy will continue for many millions of years. The amount of fossil fuel needed to produce the materials needed is far smaller than the energy produced. You assume current rates of production of fossil fuel will be needed in the future, a very poor assumption, future levels needed will be much smaller.
Dennis,
What I’m saying is in 20-30 years from now all the solar panels and wind mills will have to be replaced with new solar panels and wind mills.
All the EV’s made over the next 10 year’s will have to be replaced in the next 20-30 years.
I think the assumption that fossil fuels usage will continue on at the maximum rate possible is a pretty safe bet.
Fossil fuel usage may indeed go down but it will be due to depletion not replacement.
HHH,
The energy needed to provide the replacements will come mostly from wind, solar and batteries in 30 years, demand for fossil fuels will fall as fossil fuel energy use is replaced with wind and solar.
A relatively short term question, how will Milton affect current GOM production?
I presume not in a good way, and likely short term as mentioned, but you never know in these situations in my view.
Not much. If the predicted track is correct, it will be way too far south to affect GOM production.
Hurricane Milton is a Category 5. Florida orders evacuations and scrambles to clear Helene’s debris
Chevron sells oilsands assets to Canadian Natural Resources for $6.5 billion
The asset sale comes as Chevron focuses its growth plans increasingly in other parts of the world, notably the Permian basin in the United States and the Tengiz field in Kazakhstan, where a US$48.5 billion expansion project is nearing completion.
Chevron is also in the process of acquiring Hess Corp. for US$53 billion, a deal that would give it a stake in a massive offshore oil field in the South American country of Guyana, one of the world’s exploration hot-spots.
The Duvernay shale formation is in southwest Alberta and a rich producer of condensate, light oil and gas. Chevron has been one of the largest drillers in the region. Canadian Natural Resources expects its production from the assets will average the equivalent of about 60,000 barrels of oil per day in 2025, with about 179 million cubic feet per day of natural gas and 30,000 barrels per day of liquids, the company said in a statement.
Canadian Natural Resources is financing the deal with a US$4 billion term loan from The Bank of Nova Scotia and the Royal Bank of Canada. Canadian Natural Resources also announced it would increase its quarterly dividend by 7 per cent.
I follow closely a dozen or more Canadian oil and gas companies. Every one of them, from the big oil sands producers like SU and CNQ, to the smaller ones like OBE or BNE or CJ have plans, based on solid estimates of reserves, to increase production each year going forward. At least in Canada, peak oil is a long way away.
The last barrel of oil will be produced i Iraq.
https://www.energymanagementcentre.eu/views-on-energy-news/last-oil-barrel/
At a time when oil prices were rising and new sources were scarce The United States and others decided to remove a government of a country in order to bring that oil to market. A concocted story of weapons of mass destruction was feed to those who needed to hear a lie/ reason and then the U.S. attacked Iraq.
If the same situation arises where the world needs oil from a safe country the same kind of game plan will be played out. Venezuela is a very likely candidate for several reasons and a friendly government would allow the right firms contracts to develop the 300 billion barrels there.
We will never run short of oil for geological reasons
The oil-related motives of USA’s foreign interventions are certainly the cause of much speculation. Iraq’s oil production is indeed up since the Gulf War 2. Do you know who benefits from the increased production, and how the spoils are divided?
I asked chatGPT who replied:
Iraq works with many international oil companies under technical service contracts (TSCs) or production-sharing agreements (PSAs). These companies provide capital and technical expertise in exchange for a share of the revenues or fees. Major international companies that have invested heavily in Iraq’s oil sector include:
BP (UK)
ExxonMobil (US)
Shell (Netherlands/UK)
TotalEnergies (France)
Lukoil (Russia)
CNPC (China National Petroleum Corporation)
———
It’s curious that, if this was a package deal from USA, that China and Russia were written into the script.
I have no idea.
Your last sentence would seem demonstrably silly.
DJ
You just managed to show how ignorant you are
https://edition.cnn.com/2013/03/19/business/iraq-war-contractors/index.html
And that is only part of the story
Well, information that’s 5 years old from CNN, the world’s leading source of unbiased truthful information. Right.
The Halliburton exclusive contracts are well documented.
U.S. tax payers paid for the destruction of Iraq and it’s reconstruction and the rich companies made billions from it.
https://watson.brown.edu/costsofwar/files/cow/imce/papers/2021/Profits%20of%20War_Hartung_Costs%20of%20War_Sept%2013%2C%202021.pdf
https://watson.brown.edu/costsofwar/papers/2023/IraqSyria20
The full reports do have a lot of words but give it a go.
20 years ago, the US was producing about 5.5 million barrels of oil per day (BOPD). Now the US puts out 13 million BOPD. Most US oil and gas comes from a couple of dozen sedimentary basins. The world has hundreds of sedimentary basins that could contain oil and gas. Many are lightly explored or drilled. Of the 5 million or so wells that have been drilled in the world, 4+ million are in the US.
Bottom Line: There’s plenty of oil and gas in the world. Most of it is classified as a resource, i.e., non-proven hydrocarbons. BTW, 20 years ago, 2/3’s of the 13 million BOPD that the US currently produces were barely classified as a ‘resource’. Don’t worry about running out of gas and oil. Hopefully, we’ll find cleaner/better alternatives before we must tap into all this extra oil and gas!
Source: EIA, USGS
“could contain oil and gas”
There is no time for could. We knew that next in line was shale, after it is kerogen- Green River.
It is not going to happen.
Vaca muerta is already in play. Drop in the bucket given the needs. It is not a coincidence that US drilled most of the wells, it is unique, not to be repeated. Read more as to why US did it and will find out that is not going to materialize elsewhere.
STEO is out for October.
World C plus C centered twelve month average (CTMA) forecast based on STEO crude oil forecast and average of ratio of crude to C plus C for World minus US for July 2023 to June 2024 period.
The STEO has the Brent average 12 month oil price (nominal) falling in 2025 compared to 2024, it seems strange that they expect the response of producers to be a strong increase in output, in my view. Notice that the average 12 month price decreased from 2023 to 2024 and led to flat annual average output. I believe the continued decrease in average annual Brent Oil price in 2025 would lead to relatively flat World C plus C output in 2025 with perhaps a 250 kb/d increase rather than the roughly 1800 kb/d increase in average annual output that is forecast by the recent STEO by the EIA.
Article on STEO revisions in October compared to September
https://oilprice.com/Energy/Energy-General/EIA-Slashes-Forecasts-of-Oil-Demand-Growth-and-Oil-Prices-in-2025.html
The above posts on the ready availability of global oil reserves fail to take into consideration the 8-year absence of CAPEX for exploration and development. There is a lead time of about ten years for a major new field to be brought online. No super-major company is currently willing to make the tens of billions investment toward that goal–it’s very similar to the concept that no new refineries will be built in America. If you had ten billion to invest in energy production would you rather put it into nuclear buildout, subsidized renewables, or fossil fuels?
A corollary is that the world community has poor methodology in place for solving climate issues. Right now, with worldwide subsidies for renewables and EV’s, the use of coal is reaching new highs. With one-half the GHG emissions, think of what an immediate exchange of coal for NG would do.
“ an immediate exchange of coal for NG”
How would that work? How would the speed of development compare to renewables?
Nick G,
Incentives for using existing natural gas power plants over coal would be one method or using carbon taxes to discourage the use of coal, oil, and natural gas is another option. The second option has the benefit of encouraging nonfossil energy.
Coal-based electrical plants can run natural gas. But not the converse. It is a normal feature, in the US, when natty drops to insane price lows (e.g. in an abnormally warm winter) for plants to “switch”.
It has limited impact and is more periodic than long term. But. That is how it works. Just Google coal to natural gas switching.
Also, new plant construction can vary also. If environmental hurdles get too high, people stop building coal plants (e.g. in the US), especially if natty has long term good prices. But this is different in the US, from China. Or even Germany.
So, it’s cyclical. Big deal. Chemical plants take 6 years to build also. Sometimes 8 if you include pre-FID work. So, we get cyclicality from over/under build. From not being able to guess right. That’s a big difference from “ain’t none, we burned it all”.
The resource is there, how much is economically recoverable is unknown. It is only ERR that matters. Also rate of production is what determines the peak, not area under the curve. Another unknown, for annual average peak it might be in the next 5 years, unless 2018 remains the peak, guesses which will certainly be incorrect.
D. Coyne
You are certainly right about that.
As for how much potential is left there when it comes to oil; it is a moving target.
A lot has been said about the potential in Iraq, Iran and Russia here. There are a lot of smaller producer basins (countries) as well going forward. The Zagros fold (between Iraq and Iran) has not been utilised properly for a myraid of reasons and it seems to extend pretty far to the north. Landlocked for sure. The political instability of the region would mean that there should be more geological oppurtunities here than most places. But I have to side with P. Pukite; there it is no such thing as a free lunch. In Iraq, the Kurdish and Sunni areas were relatively more underdeveloped, but also landlocked. And in some cases we are talking about heavy oil. In Iran, Chinese contractors helped build out the most obvious opportunties. In Russia, they are developing the cold east Siberia and Artic regions. Every known opportunity is in the process of being exploited. The wild cards are in the form of exploration activities, and have been for decades.
I still do think the “anti renewable” crowd here are wrong about how useful it can be to have a very high proportion of renewables in the future burdening the steadliy more “tired” fossil fuel based economy.
The best governed response would be to have enough oil to allow for building renewables and to replace parts necessary after “a max buildout” for a long time. Probably not doable to time it that way. Oil supplies will most likely be at a substantially lower level at some point in the future. The fat, long tail of oil supply is important.
Gerry,
You qualify ‘renewables’ as subsidized, but not nuclear or fossil fuels? Does the US need 9 carrier strike groups to prevent Canada and Mexico from invading? No fossil fuel subsidies elsewhere in the world either?
Sarcasm aside, it’s clear that all three of these have a wide range of subsidies globally. Both direct and indirect.
Interesting piece on shale oil and gas.
https://oilprice.com/Energy/Crude-Oil/Shale-Producers-Prioritize-Profit-Over-Growth.html
Excerpt:
Helped by recent high-profile mergers and acquisitions (M&A), US shale’s output growth is becoming increasingly concentrated in the hands of a few large players. The research shows that the top six companies in the Permian Basin, the largest shale play in the US, now control over 60% of the remaining commercial net oil resources in the region. This consolidation is likely to continue, as smaller players struggle to compete with the scale and efficiency of their larger rivals. The industry is rapidly becoming a game of scale, and only the largest and most efficient players will be able to compete in the long term.
Oil oversupply could send prices tumbling in 2025, energy analyst says
Oil could see a decline to a “much, much” lower price, according to crude analyst Tom Kloza.
Oversupply will weigh on oil prices in 2025, Kloza predicted.
Other forecasters have also made bearish calls, with price forecasts as low as $50 a barrel.
The oil market is headed into a troubled year in 2025, and crude prices may fall “much, much” lower, according to Tom Kloza, global head of energy analysis at Oil Price Information Service.
The oil analyst said crude prices would experience more downward pressure in 2025 despite concerns that conflict in the Middle East could escalate and send prices higher.
Traders shouldn’t bet on supply disruptions in the Middle East, and the world is already so oversupplied with oil that prices are bound to drop, he said in an interview with CNBC on Wednesday.
The US produced more oil than any other country in history in 2023, according to data from the Energy Information Administration. The production boom will likely last until at least 2026, Goldman Sachs previously estimated, pointing to factors like increased drilling efficiency.
OPEC+, the oil cartel led by Saudi Arabia, is also expected to churn out more crude oil by the end of the year, Kloza said, pointing to a recent ministerial meeting that reviewed oil market conditions.
“It was pointing lower, and I think it’s still pointing lower. Because, you have to consider that there’s probably around 600,000 or 700,000 [barrels] of additional crude for export that’s going to come out as temperatures moderate in Saudi Arabia and Iraq,” Kloza said. “You have a market that’s pointed to the downside.”
Prices might fall to $70/b for Brent crude oil, but anything lower than this will likely result in lower US tight oil output in my view as the large tight oil companies will reduce their rate of development (number of new wells completed per month)if oil prices fall below $70/b for Brent (which usually means $65/b for WTI and perhaps $60/b at the wellhead).
I also think that OPEC will increase output very slowly if oil prices are low (or perhaps not increase output at all).
Oil production in Yugra by the end of 2024 is expected to be at the level of 205 million tons
11 October/ 07:15
Khanty-Mansiysk. Oil production in Yugra by the end of 2024 is expected to be at the level of 205 million tons, in 2025 – 212 million tons, and in 2026-2027 – 210 million tons. This is stated in the forecast of the socio-economic development of the region for 2025 and for the planning period of 2026 and 2027.
The Khanty-Mansiysk Autonomous Okrug is the main oil-producing subject of the Russian Federation – it accounts for about 40% of the total Russian production. Revenues from it form more than 70% of the regional budget. In Yugra in 2022, its production reached 223.1 million tons, which is 3.4% more than in 2021.
“Oil production in the Khanty-Mansi Autonomous Okrug: 2023 – 216 million tons, forecast for 2024 – 205 million tons. In 2025, 212 million tons are expected, in 2026 – 210 million tons, in 2027 – 210 million tons,” the report says.
Among the factors associated with limiting the extraction of hydrocarbon raw materials from the subsoil are Russia’s voluntary commitments to reduce oil production by 500 thousand barrels per day.
The Rig Report for the Week Ending October 11
– US Hz oil rigs dropped by 2 to 434 and are down 25 rigs from April 19. They are up 7 from 12 weeks ago.
– The Texas rig count added 3 to 244.
– Texas Permian rigs added 3 to 200 while the New Mexico Permian dropped 2 to 91.
– In New Mexico, Lea was unchanged at 48 rigs while Eddy dropped 1 to 43.
– In Texas, both Midland and Martin were unchanged at 24 and 30 respectively.
– Eagle Ford dropped by 1 to 40.
– NG Hz rigs dropped 1 to 84.
Frac Spread Report for the Week Ending October 11
The frac spread count rose by 5 to 241. It is also down by 22 from one year ago and down by 31 spreads since March 8.
The June Non-OPEC and World Oil Production update has been posted.
https://peakoilbarrel.com/june-non-opec-world-oil-production/
A new Open Thread Non-Petroleum has been posted.
https://peakoilbarrel.com/open-thread-non-petroleum-october-12-2024/