The EIA’s Short-Term Energy Outlook data is presented as “Petroleum and Other Liquids”. The EIA definition:
“Petroleum and other liquids: All petroleum including crude oil and products of petroleum refining, natural gas liquids, biofuels, and liquids derived from other hydrocarbon sources (including coal to liquids and gas to liquids). Not included are liquefied natural gas (LNG) and liquid hydrogen.”
Other liquids include biofuels. Most biofuels come from Brazil. Brazil produces about one million barrels per day of ethanol during its winter months there and none during its summer months. The cane is cut in the fall and has fermented to alcohol by the winter months. So they have huge seasonal swings in production. In order to get a meaningful chart of other liquids, you must remove the Brazil biofuels from the mix.
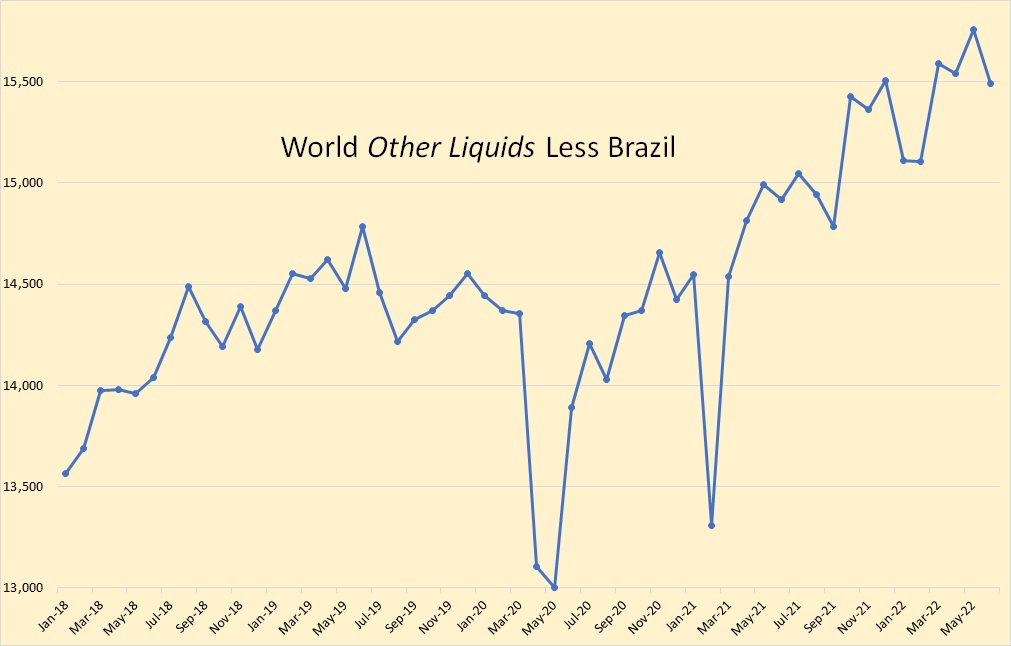
From January 2018 to June 2022 World Other Liquids, less Brazil, increased by two million barrels per day. The data in the chart above is in thousand barrels per day. Total World Other Liquids, in June 2022 stood at 15.5 million barrels per day.
All charts below are Petroleum plus Other Liquids unless otherwise specified. None of the charts, except the OPEC C+C chart, and the World Liquids chart above, includes OPEC countries.
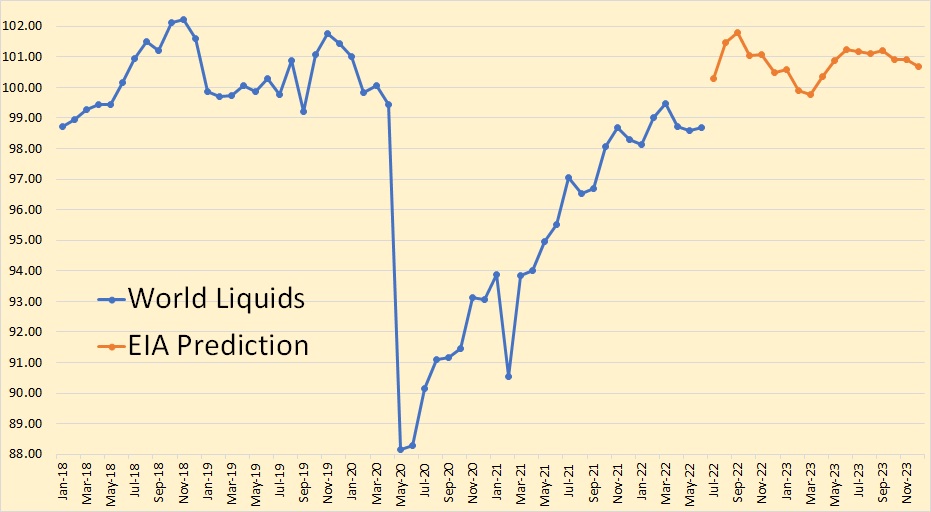
The EIA has World Petroleum plus Other Liquids approaching the 2018 peak but not quite making it before falling by two million barrels per day by March then finishing out 2023 about a million bp/d below September 2022. The known data, in blue, is through June 2022. Data in this chart and all charts below is in Million barrels per day.
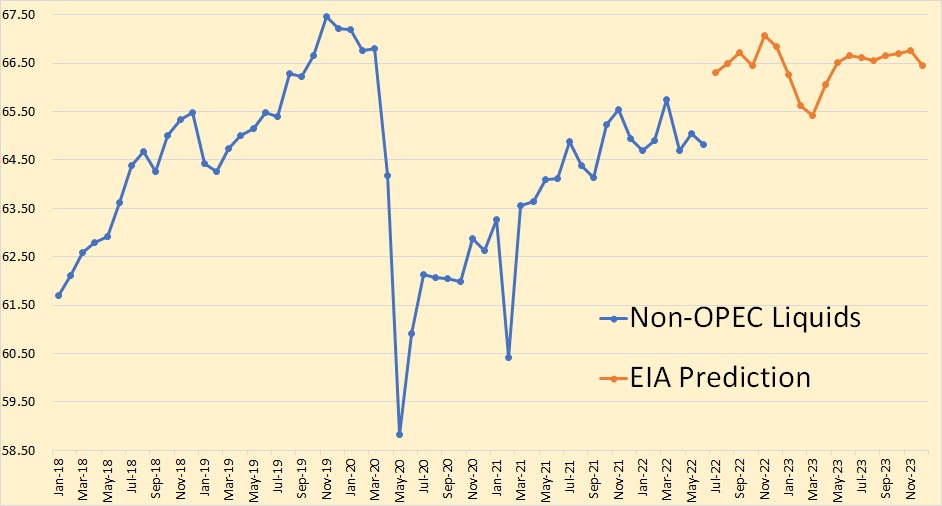
The EIA has Non-OPEC liquids dropping by about a million barrels per day by March then finishing 2023 at about the same level it held in August 2022. The known data is through June 2022.
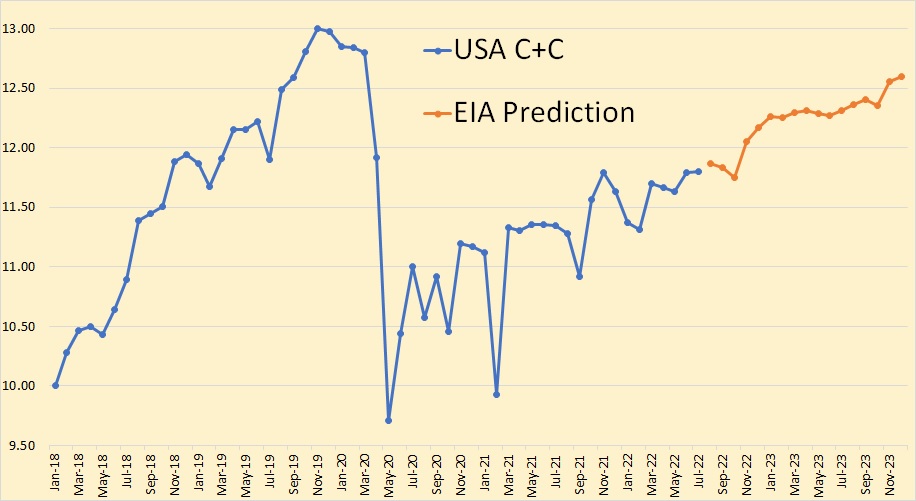
The EIA had US C+C continuing on its current upward track, increasing by another 800,000 barrels per day by the end of 2023. The known data is through July 2022.
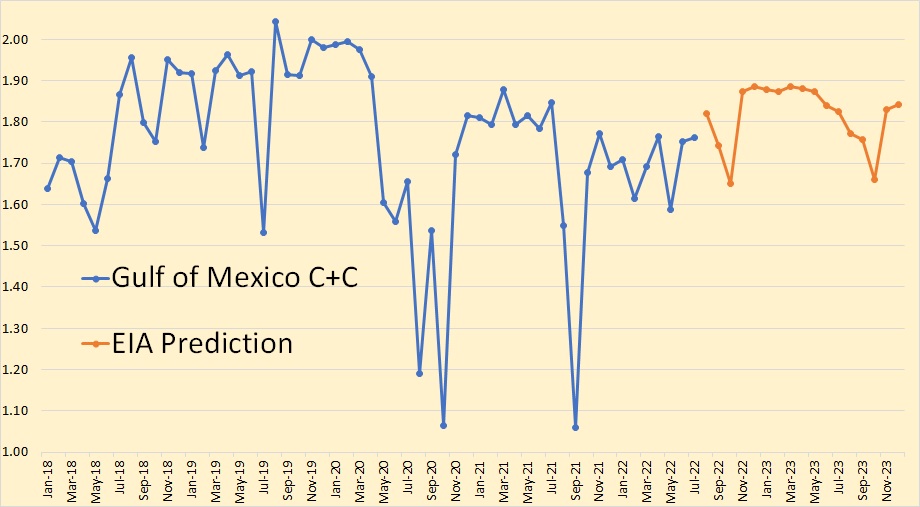
The EIA has the Gulf of Mexico dropping in October of 2022 and 2023. I think that is supposed to be the height of the hurricane season. They have the GOM finishing 2023 up only slightly from where it is today. The known data is through July 2022.
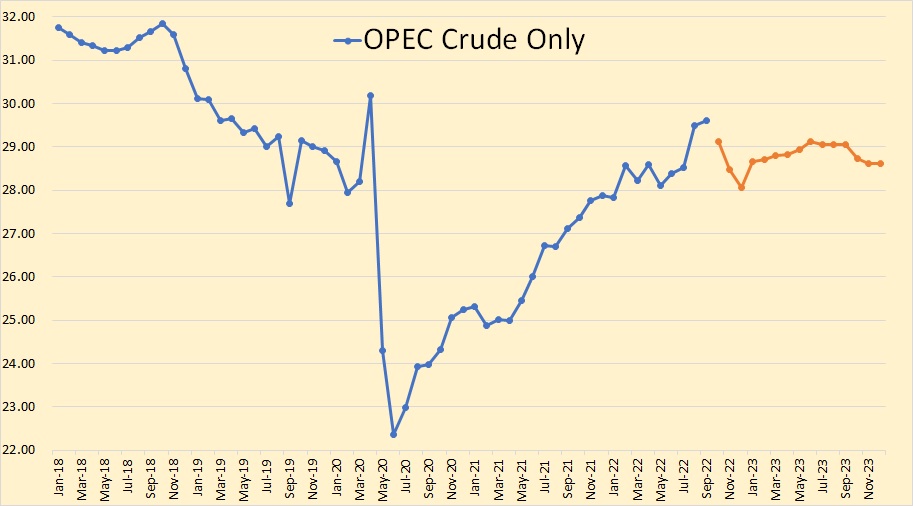
The EIA has OPEC crude only at 29.61 barrels per day at the end of September and dropping about 1.5 million barrels per day by December 2022, then recovering before finishing 2023 at about 1 million barrels per day below the September 2022 level. The known data is through September 2022.
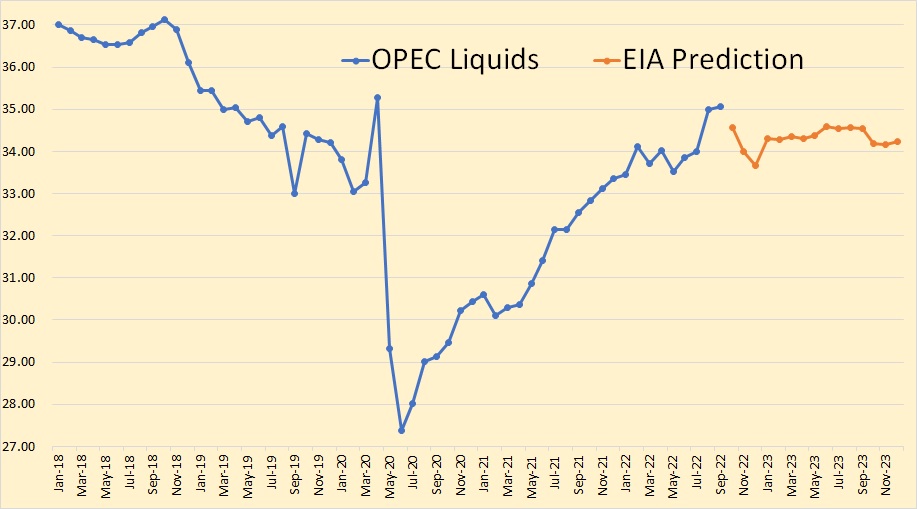
OPEC Liquids look about the same as OPEC Crude only except they average about 5.4 million barrels per day higher. OPEC Liquids added only 200 Kbp/d from January 2018 to June 2022 compared to over 1.8 million barrels per day Non-OPEC added over the same period.
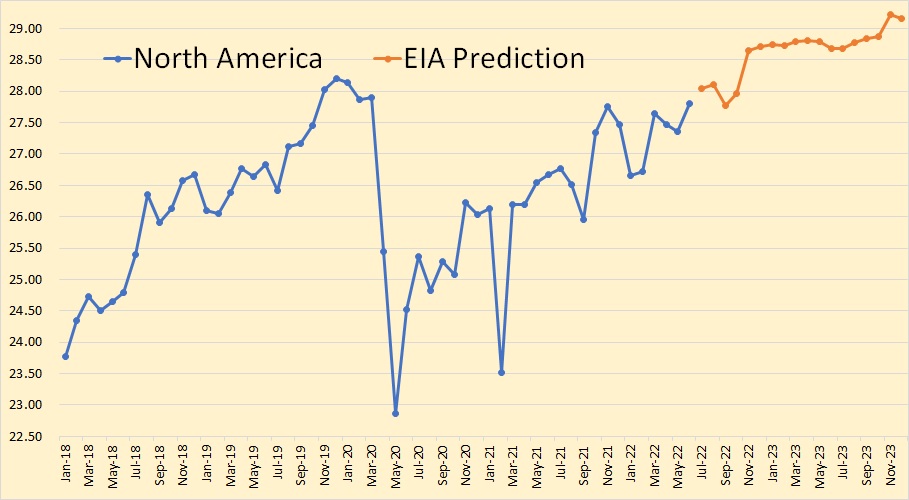
North America is the USA, Canada, and Mexico. Remember this is petroleum and other liquids. And in the past few years, other liquids have grown while C+C has declined. The EIA sees North American liquids growing by just over 1 million barrels per day by the end of 2023. This data, as well as the data for all the charts below, is through June 2022.
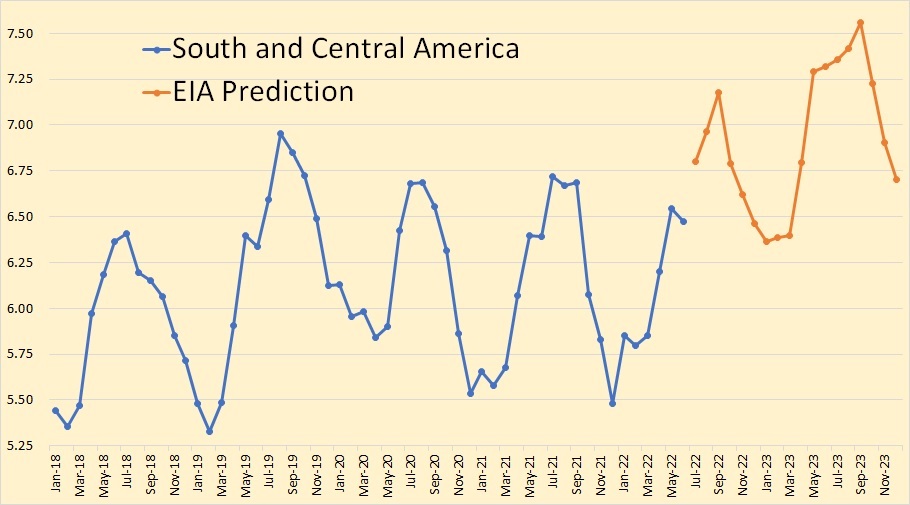
Brazil, Colombia, Argentina, and Ecuador and .75 million barrels per day from various other countries make up South and Central America. The approximately 1 million annual swings in production is because of the seasonal production of sugar cane ethanol in brazil.
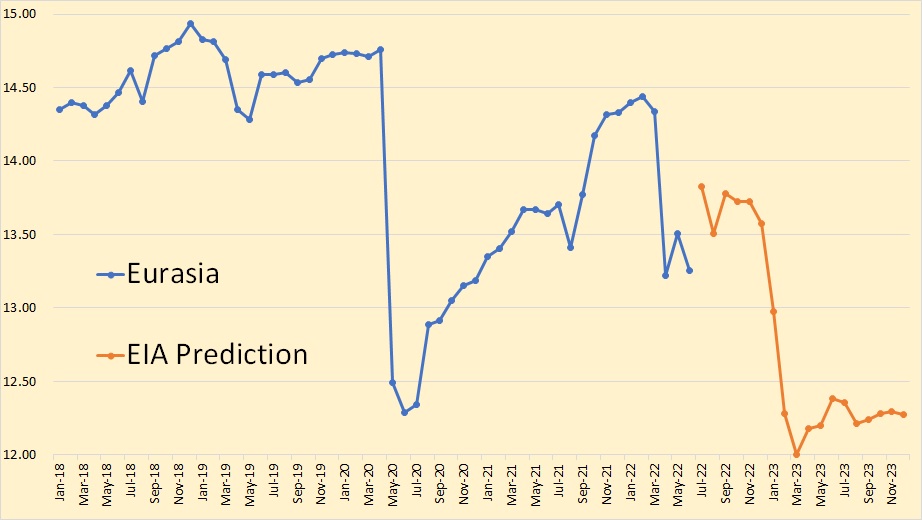
Eurasian liquids production comes from Azerbaijan, Kazakhstan, Russia, Turkmenistan, and a few smaller producers. The 1.8 million barrel per day decline between September 2022 and March 2023 was all Russia.
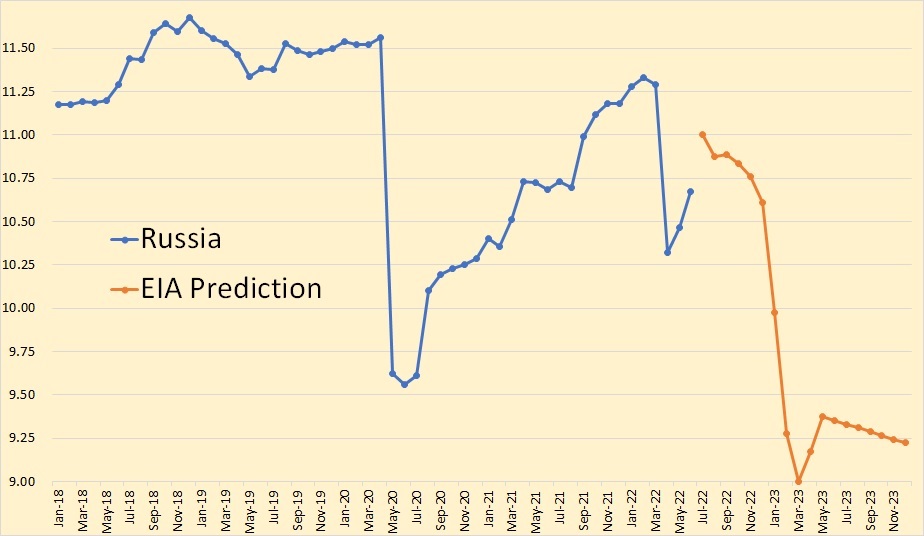
The EIA has Russia dropping 2 million barrels per day between July 2022 and March 2013, then recovering a bit before holding in slight downward trend. Remember, this is petroleum plus other liquids. If you were to convert this to C+C only you would need to subtract at least half a million bp/d from that data. That would mean Russia would produce about 8.75 million bp/d throughout 2023.
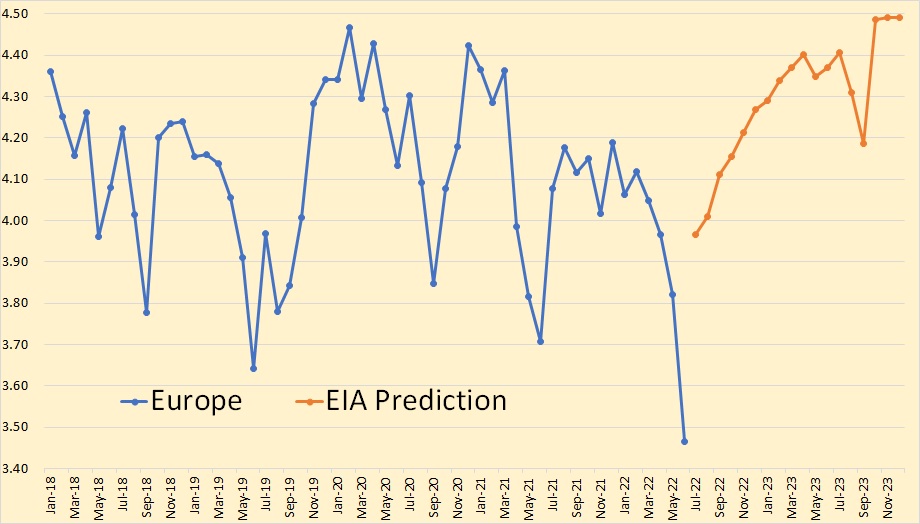
Europe is mostly the North Sea, Norway, UK, and Denmark, with a bit from other places. The EIA sees their production increasing from about 4.1 to 4.5 million barrels per day by the end of 2023.
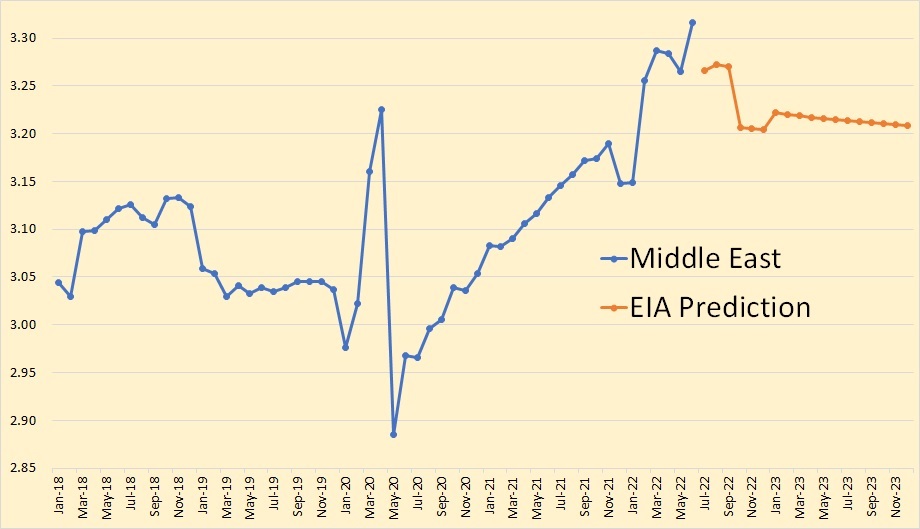
Oman and Qatar, are the only major Middle East country that is not OPEC. There are other small producers.
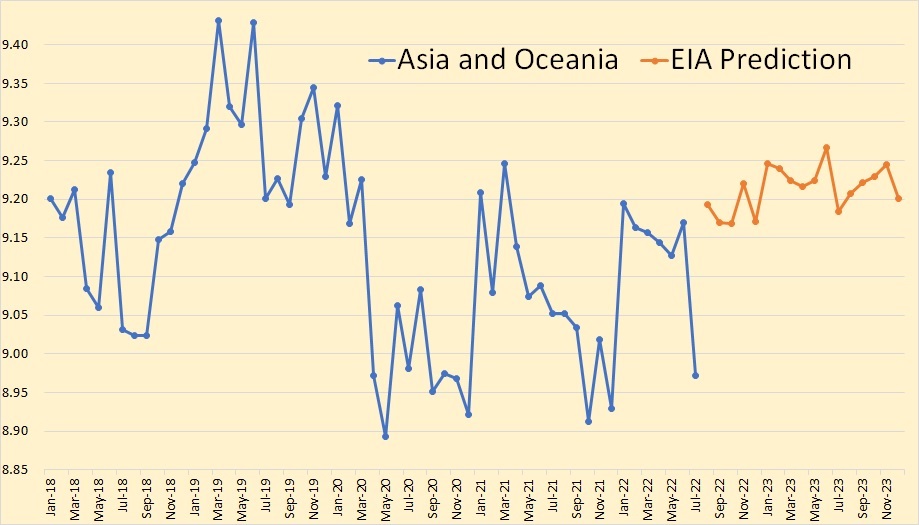
Australia, China, India, Indonesia, Malaysia, and Vietnam are the nations that makeup Asia and Oceania. The EIA has them increasing production by 220 Kbp/d from July to August.
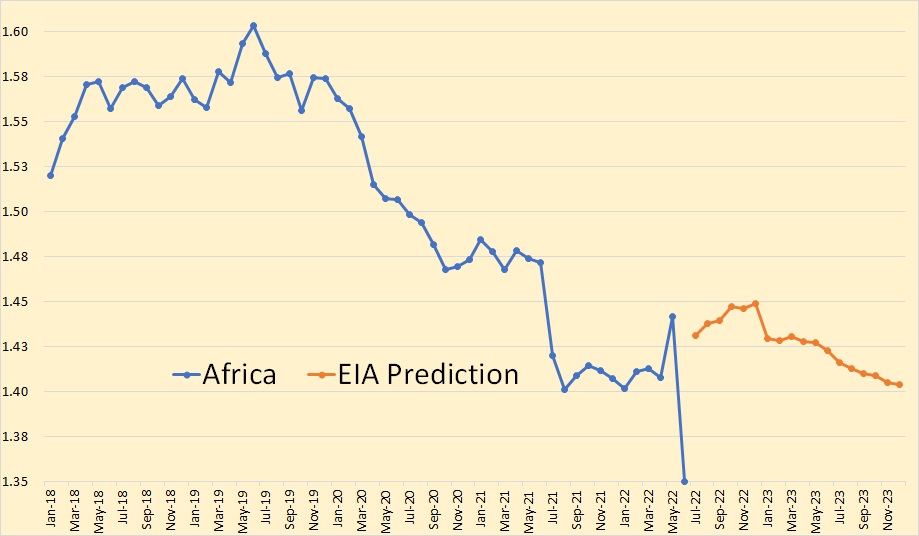
Egypt and South Sudan are the only major African producers that are not OPEC. There are a few other small producers.
So far, both World C+C and World Petroleum and Other Liquids peaked in November 2018. In June 2022, World Petroleum and Other liquids production stood at 3,536,000 barrels per day below that November 2018 peak. In the same month, World C+C stood at 5,270,000 barrels per day below that November 2018 peak. It is my prediction that this 2018 C+C peak will never be breached. However, I will not make that same prediction for Petroleum and Other Liquids, especially since the latter, in additional to natural gas liquids, includes biofuels. I really don’t think cane and corn ethanol should be added to the mix.
165 responses to “The EIA’s Short-Term Energy Outlook”
Here is a sneak preview of a chart that will be posted in this afternoon’s US update.
As George notes, we have been tracking this decline in the use of DUCs for a while.
The attached chart shows that in theses four basins, the total number of DUCs just dropped by three in September. However in the Permian, the DUC count has dropped by 14 for the last two months.
Thanks for the link George. Will use it in the Update.
Lightsout posted this link on the last post. I thought it important enough to repost it here.
Oil output from Brazil’s Petrobras dips nearly 7% in third quarter Bold mine
SAO PAULO, Oct 24 (Reuters) – Brazilian state-run oil company Petrobras PETR4.SA said on Monday that its crude oil production during the third-quarter fell 6.8% compared to the same period last year.
Petroleo Brasileiro SA, as the company is formally known, pumped 2.115 million barrels per day (bpd) in the July-to-September period, according to a Petrobras statement.
Brazil is Latin America’s top oil and gas producer, ahead of other major regional petroleum suppliers Mexico, Colombia and Venezuela.
Including natural gas output, the Brazilian oil giant produced a daily average of 2.644 million barrels of oil equivalent, down 6.6% from the same quarter last year.
The Rio de Janeiro-based company attributed the declining output to fewer barrels from its Atapu and Sepia fields, the stoppage of operations at its FPSO Capixaba unit as well as what it described as the “natural decline” of mature fields.
Around 73% of Petrobras output came from Brazil’s so-called pre-salt fields, an oil-rich offshore region off the country’s southeastern Atlantic coast.
In the same quarter last year, 71% of the company’s oil production came from the same area.
“Natural decline in mature fields” is what is happening all over the world.
Ron,
Yep, started around 1870.
Yes, Dennis, reserves started to decline when the first barrel was pumped out of the ground. But we are not talking about reserves here Dennis, we are talking about production. Brazil’s production is starting to decline because their mature fields have peaked in production and are now declining in production.
Production Dennis, we are talking production here, not reserves.
Ron I am referring to “natural decline of mature fields”, which started right from the beginning. Much of the decrease may have been due to the FPSO being offline, much like Norway this past summer or GOM during a Hurricane.
OPEC forecasts Brazil’s crude output will rise by about 100 kb/d in 2022 over the 2021 level and by another 200 kb/d in 2023.
OPEC’s forecasts are almost as bad as those of the EIA. 🤣
Ron,
Here is a forecast that I think was excellent at the time (March 2021), and may still be the best we have until we see another update. In the comments in the original post you said it was pretty good.
https://peakoilbarrel.com/brazil-summary/#more-30556
Chart below is from post linked above.
Dennis, I don’t have a problem with that forecast. It looks pretty accurate to me also. Brazil still has a bit to go before they peak, though as they admit, they do have some fields in natural decline.
Notice they fall off a cliff beginning in the early thirties. That chart should scare the hell out of anyone who thinks we have many decades of crude oil before we run into problems.
Ron,
Sometimes more oil gets found making the cliff less steep. In the post Mr Kaplan essentially assumed no new discoveries in the future, a fairly conservative assumption ( and perhaps accurate ).
Depletion started when the first barrel was pumped out of the ground. Reserves go up and down based on price, all the time. Come on Ron, you’ve been around this game to learn at least some of the important definitions, and this happens to be one of them.
Depletion started when the first barrel was pumped out of the ground.
That is exactly what I said. So why the hell are you repeatiin my words as if you are telling me something I did not know?
Reserves go up and down based on price, all the time.
Of course economicly recoverable reserves go up and down according to the price. And you are lecturing me like you are telling me something I have not said myself many times on this blog.
But goddammit RGR, as I told Dennis, the subject discussed in the article, as well as in my post was: “natural decline” of mature fields. That is production RGR, not reserves. I was not talking about reserves, I never mentioned reserves, the article I posted did not mention reserves, it only mentioned production decline and I only mentioned producion.
If for some reason you have reserves on the brain, the go argue with someone else. I only wish to discuss production.
Go reread what you wrote Ron. Reserves and depletion aren’t synonmous, and reserves is non-sensical in the context you used it.
Here is what I wrote in the first post that started the whole debate:
“Natural decline of mature fields” is what is happening all over the world.
Here is what I wrote in the next post”
Yes, Dennis, reserves started to decline when the first barrel was pumped out of the ground. But we are not talking about reserves here Dennis, we are talking about production. Brazil’s production is starting to decline because their mature fields have peaked in production and are now declining in production.
Production Dennis, we are talking production here, not reserves.
That was it RGR! I used “reservess” once when I was simply agreeing with Dennis. Then I used the word again to inform Dennis that we were not talking about reserves, we were talking about production.
Now tell me wher in those two posts that I used the word “reserves” in a non-sensical way. Please do that because you are starting to piss me off.
This is what you wrote that was non-sensical. All the rest of your commentary was further commentary which I did not investigate as this comment signifies, right from the beginning, that you do not know what reserves are. There was nothing to decline when that first barrel was pumped, because before that moment, there were zero reserves. Depletion, on the other hand, did start in that instant, and the original endowment decreased in that moment by the first barrel pumped.
“Yes, Dennis, reserves started to decline when the first barrel was pumped out of the ground.”
RGR, if there were a zillion barrels of oil in the grond before the first barrel was pumped out then after that barrel was pumped out, there would be one less than a zillion barrels of oil in the ground. Total reserves would have declined by one barrel.
That is so damn simple a third grader could understand it. Now please shut up.
Petrobras is not Brazil. Petrobras has been selling some fields off to clear debt and foreign IOCs have recently become more active there as Santos fields come online. Brazil output will almost certainly start rising over the next two years as more FPSOs are bought online. It has probably not done as well as expected five or ten years ago and recent exploration results haven’t been great, but there are seismic programs planned for the Foz do Amazonas, which may have some similarity to Guyana (though TotalEnergies tried there before and gave up in 2020).
So bad for the EIA’s STEO concerning South and Central America. We can see in plain light the accuracy of EIA’s prediction.
Interesting piece at EIA
https://www.eia.gov/petroleum/weekly/archive/2022/221019/includes/analysis_print.php
Recent pipeline maintenance is likely causing further price differentials between Waha Hub and Henry Hub. Beginning on October 3, El Paso Natural Gas (EPNG) cut westbound flows of natural gas by more than 300 million cubic feet per day (MMcf/d) on the southern part of its system due to maintenance that it expects to continue until October 21. On October 4, EPNG also announced a 300 MMcf/d cut in westbound flows along the northern part of its system due to a force majeure event. Maintenance will likely last until October 24.
Although crude oil producers could flare excess natural gas, the Texas Railroad Commission regulates the amount of flaring allowed in the portion of the Permian region in Texas. As natural gas takeaway capacity approaches its limits in the Permian region, the Commission may grant flaring permits, which could alleviate oil production constraints. The number of flaring exceptions the Commission grants can vary year-to-year.
Our latest Natural Gas Pipeline Project Tracker indicates several new projects coming online over the next two years that will add natural gas takeaway capacity to the Permian region. Nonetheless, the emerging wide price spread between Waha Hub and Henry Hub indicates that the region is currently facing capacity constraints. As a result, the amount of crude oil and natural gas produced from the Permian region faces may be limited in the fourth quarter of 2022 and into 2023.
See chart showing differential between WAHA Hub(Permian basin) and Henry Hub Natural gas prices.
The chart below shows the EIA’s nominal Brent oil price forecast (right vertical axis) and World real GDP percentage annual growth rate (YoY) on left vertical axis from the october Short Term Energy Outlook. The average World real GDP growth rate in 2023 is forecast at 2.2%, vs 3% growth in 2022. So what we have in 2023 is a slowdown in demand growth due to slow World real GDP growth. Note that the IMF expects annual real GDP growth in 2023 at 2.7%, and OPEC forecasts (in October 2022 MOMR) 2.5% real GDP growth for the World in 2023 (this forecast seems the most realistic to me.) Data in the chart is quarterly data.
The US is the biggest biofuel producer, with Brazil number two. These two countries account for the large majority of global production.
Its a huge swath of prime farmland for corn ethanol in the US, and huge swath of subtropical forest for sugar cane ethanol in Brazil.
In the US the roughly 30 million acres of prime farmland devoted to corn ethanol produces enough net energy for transport fuel that could be replaced by less than 100,000 acres of photovoltaic energy for transport on sparse range land.
Yes- that is less than 1/300th as much land, and dramatically less productive land at that.
And yes, the transport energy provided would be much less expensive per mile.
But alas, there is a big vested interest in the ethanol industry.
The table shows ‘Leading countries based on biofuel production worldwide in 2021 (in petajoules)’
Hickory,
Could you please provide a source for your ethanol-PV area:energy comparison?
Thanks
This information underlying this analysis was based on a series of articles, reports and energy conversion calculations.
Some of the information required to make the conclusions is straightforward and easily found, and a few components are harder to come.
By far the biggest variable in the whole equation is ‘just what is the net energy yield of US corn ethanol production?’ The most comprehensive and unbiased by industry report on this I could find was produced by the USDA- The Energy Balance of Corn Ethanol: An Update
https://www1.eere.energy.gov/bioenergy/pdfs/energy_balance_of_corn_ethanol.pdf
which provides the hinge-pin conclusion that “The estimated net energy value (NEV) of corn ethanol was 21,105 Btu/gal”
I have not found a better analysis on that particular factor, and therefore there is an assumption of rough accuracy on this.
No other aspect in the overall analysis has much uncertainty.
For example, published data shows how many acres of corn are utilized for ethanol, and what the average yield/acre is. And we have clear reports on the per acre average annual electricity output from US utility scale photovoltaic installations.
Is there some particular aspect of this that you are interested in? I’d be glad to share the other sources of information or key aspects from which straightforward calculations can be made.
My apologies for not responding sooner. Thank you, this information is helpful. Determining net energy from biofuel is complicated, for certain. Often overlooked in these discussions is the impact of biofuel on the eutrophication of freshwater and coastal marine systems.
Thanks again.
World Liquids centered twelve month average (CTMA) from July 2017 to July 2023 using EIA STEO data and projection. Note that non-crude liquids increase by about 3 Mb/d over the 2019 to 2023 period so crude plus condensate output is about 3000 kb/d less than the 12 month peak of 83000 kb/d (August 2018 for centered average) in Dec 2023 based on the trend in non-crude liquids and the STEO projection of World liquids in Dec 2023.
Welcome Back Ron
In case you did not notice, Ron has agreed to take over the monthly STEO post from me. Much appreciated.
Nice job
Thanks
Thanks for your good work OVI
Hightrekker
Thanks. I will continue to report US production by State and Non-OPEC production.
Thank you Ovi and Ron for the posts. I am sure everyone appreciates the effort and data visualisations.
The biggest threat to world economic and political stability from peak fossil fuel will not be the global rate of decline in production.
Rather it will be the exacerbation of pre-existing disparity in distribution among countries, and between the wealthy and not wealthy within countries.
Some will still have access to plenty, and the big majority will get priced out of the market as time goes on.
That will probably cause exasperated refugee crisises around the world. Which in turn will get more right leaning leaders elected.
Yes I think that is true.
And not just right leaning, but also autocratic and nationalistic.
The repercussions of that trend is the growth of resource nationalism and a decline in globalization/free trade. Whether one considers that trend as good or bad, it is none-the-less fairly likely.
All of us are dependent on a globalized system with free-ish trade more than we realize.
There is big risk here.
The Canadian National Energy Board is out with Canadian C+C production through July 2022. They have July production at 4,802,000 barrels per day in July. That is slightly above their 12-month average. However, the EIA is predicting they will average about 300,000 barrels per day above that in 2023.
Ron,
See also
https://www.cer-rec.gc.ca/en/data-analysis/canada-energy-future/
Canada predicts for the “current policies” scenario about a 250 kb/d increase in 2023 and about a 280 kb/d increase in 2022 from the average 2021 level. These may be all liquids or at least include NGL, not really clear but the numbers in the future scenario don’t quite match the crude output numbers for 2015 to 2021, they are roughly 200 kb/d higher.
Ovi is probably more familiar with the Canadian publications.
Ron/Dennis
The Canadian Energy Regulator (CER) indicates that July production was 4,802 kb/d. However the EIA subtracts approximately 250 kb/d from the CER report. Accounting for the EIA’s reduction, Canada’s projected July output, when the EIA reports July, will be closer to 4,550 kb/d.
As Dennis notes below, the numbers he is looking at differ by 200 kb/d. Not clear if the Cdn numbers are all liquids and the EIA just subtracts a set amount. I once looked at percentages but they were not consistent.
The Saudi’s comment regarding the United Sates needing to be careful about depleting the Strategic Reserve is curious. I think they are covering up their inability to sustain 11 million barrels a day. Their cutback of production is uncharacteristic for them unless they just don’t have capacity to produce any where near 11 million barrels a day without buying two million barrels a day from Russia “indirectly”. I also thought it was interesting that they are talking about selling off their 4% interest in Aramco. It doesn’t add up. Appreciate some thoughts here.
Note a recent opinion survey in USA saying 57% approve the use of the strategic oil reserve as a tool to reduce gasoline prices. Carpe Diem?
Are the Saudis just padding their defense in case the US pursues anti-monopoly legal action against them?
I would conclude that 57% of Americans are stupid.
I was wondering if the announced cut was in part a test to see if the US and others can respond.
Assuming the some of it is a lack of capacity, can the US easily increase production by 1 million barrels a day? 2 million barrels day?? Or am I missing something?
You’re missing Stephen. The US government does not control what the oil companies produce. The oil companies themselves do whatever they wish to do. The oil companies know what they are doing. No, they cannot “easily” increase production. They can only, very slowly, and with great effort, increase production. But they will only do that if it benefits the company and its shareholders.
Stephen,
OPEC believes there will be a surplus in oil output, if they continue producing at the rate of September 2022, this is in part because they expect less demand for oil due to slower economic growth as central banks raise rates to reduce inflation. US producers are also worried about overproducing and crashing the price of oil. OPEC and non-OPEC may raise output if oil prices stabilize around $110/bo +/-$10/bo, but it may take 6 to 12 months before we get there as we are likely to see slower economic growth for the next 6 to 12 months.
The ARAMCO CEO warned us a couple of months ago that the world was running out of spare capacity. He knows a lot more about Saudi, and the rest of OPEC than he does about the rest of the world. Of course, Saudi knows the world is in a pile of shit as far as oil production capacity is concerned.
They also know their oil will be worth a lot more in a couple of years. But they also realize there is a grave danger that falling oil production will push the world into a deep recession, reducing the value of their oil. They have to warn the world in hopes the world will voluntarily cut back, lessening the chance of a recession.
LTO Survivor,
Perhaps the Saudis are simply saying what many observers are saying which is that it is a dumb move to deplete the SPR in an attempt to affect an election. It may indeed be that simple. If you read the October MOMR, it is clear that OPEC thinks there will be an oversupply of oil if they continue to produce at the September level. I think their estimates are likely too optimistic for both the slowdown in demand and future non-OPEC output, but they are simply going by their own analysis which they believe to be correct (or at least that’s their best guess of the future, obviously all forecasts are wrong.)
Yes I agree with you that pumping oil from the strategic petroleum reserve just to win an election is a very irresponsible move. There should be a governing board that determines when petroleum is removed from the reserve that is isolated from politics. The country is now heading quickly down the drain with accelerating unplayable debt and dwindling energy and other resources. Everyone should prepare for this as best they can because disaster is quickly heading our way financially, morally, and socially.
“There should be a governing board that determines when petroleum is removed from the reserve that is isolated from politics.”
Agree. Probably would good for many other policy decisions as well.
Nonsense, the point of the reserve is to prevent spikes in oil prices, and that is exactly what it is being used for.
The American economy is surprisingly strong right now, as is the EU economy. That means demand should go up. The OPEC production cuts are probably in anticipation of much weaker numbers. So the Biden administration is right to use the strategic reserve.
I’m sorry, but I can’t take anyone seriously at face value if they think the EU economy is doing well.
The UK Foreign Office has just today advised against travel to Spain due to civil unrest. Germany has shuttered up to 50% of heavy industry, and France is catching up with the rest of the nations in the bloc with increasing inflation. Most countries have gov’t plans to support any degree of energy price increases temporarily, and the only reason we aren’t seeing major issues with those plans is because of an unusually mild autumn so far.
Stateside, you have people using up most of their savings they managed to acquire over the COVID period. Repossessions of cars are spiking, and mortgage rates are becoming untenable. The FAANG sector is imploding, diesel is <25 days supply and dropping, and the idiot president is throwing out a critical reserve to appease people who see him as completely unfazed by their suffering at the bottom of the ladder.
Other than that, sure, the GDP numbers means it’s all good, and GDP number going up is all we care about.
Ok – have to ask. If the Saudis are buying 2 million barrels a day from Russia ( I presume to prevent a total price collapse – if true) then why wouldn’t they buy/bid up the sales from the SPR for same reason?
Thanks Folks
Because Russia is a member of OPEC and USA isn’t.
Because Russia sticks to agreements and USA doesn’t.
Because Russia is developing a very long term oil trading business into the East and beyond via Iran, India, China, and middle East oil and goods trading countries and USA trading is ephemeral.
Ovi,
The difference I noted is between the CER crude estimates and the numbers in the canada energy futures forecast.
https://www.cer-rec.gc.ca/en/data-analysis/energy-commodities/crude-oil-petroleum-products/statistics/estimated-production-canadian-crude-oil-equivalent.html
vs
https://apps.cer-rec.gc.ca/ftrppndc/dflt.aspx?GoCTemplateCulture=en-CA
The historical estimates in the Canada’s energy futures page seem to be about 3 to 5% higher from 2012 to 2021 (using annual averages to compare).
If I am not wrong there is a periodic signal in the production of oil in Canada. I don’t know where it comes from but the fact that EIA’s prediction doesn’t reproduce this periodicity shows that there is something wrong in their calculations.
Attached are two charts that show what is happening with NGPLs in the US.
The first chart shows the steady weekly growth in NGPLs in the US since 2019. While there are some ups and downs, there is no doubt to the steady uptrend. This uptrend continued through the winter and summer of 2020 while oil production in the US was dropping. The OLS line indicates an overall increase of 29.3 kb/d/mth. There was a big step up in the last two weeks to 6,144 kb/d.
Also attached is a chart that show the ratio of NGPLs to C plus C. Notice how in the first half of 2020, the ratio was close to 0.3. In early September as C plus C production was trying to recover, NGPLs started to increase and the ratio moved up into the 0.48 area and has remained there ever since except for a few short excursions above and below that level. Over the last two weeks, it has moved above 0.50.
Ratio Chart
A longer term look at US NGL output from 2010 to 2021, average annual rate of increase was about 325 kb/d or a monthly average rate of increase of about 27.1 kb/d. Generally the annual data from the EIA tends to be more accurate than the weekly data and I cannot find monthly data for NGL output.
I found the monthly data (look under petroleum rather than natural gas at EIA). From 2016 to 2022 the curve steepens, this is more apparent with the monthly data, so using OLS regression on data from August 2016 to July 2022 (I prefer to use 12 month blocks in case there is seasonality in the data set) I find an average annual rate of increase over that 6 year period of 418.9 kb/d, the average monthly rate of increase over those 72 months was about 34.9 kb/d. My previous estimate may have been a bit low. An OLS on annual data from 2016 to 2021 gives a more reasonable estimate of 35.6 kb/d, similar to the estimate on the monthly data (though the periods are slightly different Jan 2016 to Dec 2021 vs Aug 2016 to July 2022).
Dennis
The bottom line whether short term, long term or weekly, 30 kb/d/mth is the long term stable trend for NGLs growth. More critically one has to decide if the the short term trend is different than the long term trend. You will note in my chart above how June of this year shows sharp increase in NGPLs and another bump up in the last two weeks
As you are aware, there is increased demand for LNG in Europe due to the war and this has also caused a sharp increase in NGPLs as a side benefit. So the breakout in June signals a new market trend for NGPLs unrelated to its historical trend.
As encouragment to the NG drillers the world has given the gas drillers more incentive to drill. See attached chart.
Ovi,
You are absolutely correct, my intention was just to bolster your argument by seeing if the long term trend had changed. From what I can tell, it changed a few times and this probably tracks changes in rate of change in natural gas output. Note that for the Permian, where a fair amount of increased gas production is occurring, we are seeing natural gas prices go negative due to pipeline capacity constraints and maintenance.
In any case from 2005 to 2022 the US dry natural gas has increased steadily at about 4.2% per year. Though price crashes in 2015 and 2020 slowed output followed by return to trend, in 2018 and 2019 output was above the long term trend.
https://www.argusmedia.com/en/news/2384618-waha-spot-gas-prices-negative-for-a-second-day
Henry Hub spot prices are at about $5.50/MMBtu as of week ending 10/21.
Ovi,
When I looked at rate of change in NGL it was around 9%, so I decided to look at how barrels of NGL per unit of dry natural gas produced has changed. Since 2012 the average cubic foot of natural gas has become wetter in the US with the average annual rate of increase in kb of NGL per TCF of dry natural gas at about 2.29 per year from Jan 2012 to July 2022. So in early 2012 we had about 30 kb of NGL per TCF of dry Natural gas and by July 2022 this had increased to about 62 kb of NGL per TCF of dry natural gas.
Fear of recession is the big story with OPEC as well as the rest of the oil-producing world. And Biden is begging them all to increase production.
Exxon Mobil Stock: Will Energy Giants Exxon, Chevron, Follow OPEC’s Lead?
Coming off record profits in the second-quarter, Exxon Mobil (XOM) and Chevron (CVX) are expected to again see Q3 earnings skyrocket when they report on Friday. Capital spending guidance from the two energy giants will be will be of crucial interest, as U.S. oil producers have sat on their hands, keeping production essentially flat, while gasoline and diesel prices soar. Both Exxon Mobil stock and Chevron shares swung higher early Thursday.
Now with recession and possible demand destruction in the forecasts, it remains to be seen whether Exxon Mobil and Chevron will heed President Joe Biden and increase production or follow OPEC’s lead and keep the production reins tight.
In early October, the Organization of the Petroleum Exporting Countries and its key allies including Russia, known as OPEC+, decided to cut their oil production by 2 million barrels per day in November. The group had been warning of a possible production cut, due to forecasts calling for economic slowing and a lower outlook for energy demand.
Meanwhile, Biden has been releasing millions of barrels of oil from the U.S. Strategic Petroleum Reserve, attempting to hold down U.S. oil and fuel costs ahead of the looming midterms elections.
“My message to oil companies is: You’re sitting on record profits, and we’re giving you more certainty. So you can act now to increase oil production now,” Biden said during an Oct. 19 speech.
There is a lot more to this article. Just click on the big blue headline to read it.
I think Shell has already shown what is going to happen, profits rise and buy backs and dividends rise accordingly. No increase in future investments because the prospects just aren’t there or are too marginal and risky.
George
I think Shell are about to start further operations in the Orange basin.
IEA predicts plateau in World fossil fuel output by 2030.
https://www.iea.org/news/world-energy-outlook-2022-shows-the-global-energy-crisis-can-be-a-historic-turning-point-towards-a-cleaner-and-more-secure-future
Excerpt
For the first time ever, a WEO scenario based on today’s prevailing policy settings – in this case, the Stated Policies Scenario – has global demand for every fossil fuel exhibiting a peak or plateau. In this scenario, coal use falls back within the next few years, natural gas demand reaches a plateau by the end of the decade, and rising sales of electric vehicles (EVs) mean that oil demand levels off in the mid-2030s before ebbing slightly to mid-century. This means that total demand for fossil fuels declines steadily from the mid-2020s to 2050 by an annual average roughly equivalent to the lifetime output of a large oil field. The declines are much faster and more pronounced in the WEO’s more climate-focused scenarios.
Chart from IEA presentation (slide 10)
Dennis,
This seems very similar to your model. Even though i don’t think this forecast will come to fruition, it certainly could be plausible.
Iron Mike,
My model is more aggressive, see comment linked below
https://peakoilbarrel.com/open-thread-non-petroleum-october-26-2022/#comment-748059
Some will claim that the 9% growth in renewable energy that I assume from 2030 to 2050 is not realistic, but I would note that oil and natural gas (the sum of the two in EJ) grew at an average annual rate of about 7% per year from 1935 to 1975 and in this case was constrained by limited demand, the demand for energy already exists and the renewable energy will simply be replacing existing fossil fuel energy sources at lower cost, it is only a question of whether supply can be ramped up at 9% per year, at some point this will slow down as we approach 99% of energy consumption supplied by non-fossil fuel energy, but that would not happen until 2055 for a scenario where renewable growth rate remains at 9%/year from 2030 to 2054 and slow to 5% in 2055 to reach 99% of energy supplied by non-fossil fuel.
Dennis,
Interesting. I can see your logic behind the rate of increase. And you are presuming the current infrastructure will just be replaced with renewable equivalent if i understood you correctly ?
I think next year the growth rate might stall as I think there is potential for a severe recession and an energy crises.
But the overall trend could be right. But i think it won’t play out like that personally.
Iron Mike,
If there is a severe recession, you may be right. Note that I doubt it will play out as outlined in my projection, it certainly will no proceed smoothly at a steady rate as in my chart, but if you imagine a random sinusoid superimposed on that output path due to recessions, wars, changes in policy, and lots of stuff I do not anticipate, I think its plausible. Of course something else is much more likely, this is one scenario of an infinite set. To have a discussion you would need to present an alternative.
Iron Mike
For me, the big question is will demand rise to see if the world oil producers, especially the OPEC big 4 can meet the required demand?
I think we will know by the middle of next year.
Ovi,
My faulty crystal ball is telling me next year oil demand will drop, possibly sharply. There is potential for a full fledged energy crises too, with soaring electricity prices i believe world wide.
So i don’t think the demand test for production from the OPEC big 4 will come to fruition next year. But it will come.
Iron Mike
US announced today that Q3 GDP grew annualized by 2.6%. That is hopeful sign that next year will not see a recession, slow down is possible. All three agencies, EIA, IEA and OPEC are predicting increased demand in 2023. The question is whether that increase will be big enough to stress the supply side.
https://mishtalk.com/economics/exports-and-government-spending-trigger-a-2-6-percent-jump-in-third-quarter-gdp
“Note that GDP has not returned to the previous trendline and won’t. Another recession is totally baked in the cake. ”
Government spending won’t come to the rescue again. “
This peak demand claim is total bullshi+, its nothing more then a sophomoric cover for peak supply. Yes use definitely will go down because supply will be going down. You can’t use whats not available! The government propagandists and their fake news mouthpieces keep trying to coverup the fact that the world has reached peak oil and peak resources. The public affected will respond very vociferously politically & by other means.
I wonder how much of their peak/plateau projection is based on limitations of supply (geologic, financial and political) vs alterations in demand (recession, climate change limitations, alternative energy supply).
The natural gas demand looks particularly less robust than prior projections we have seen.
The oil projection out to 2050 looks extremely optimistic- a huge fat tail with no depletion.
Hickory,
It looks like they essentially expect a plateau for oil and natural gas from 2030 to 2050 with only coal consumption falling, I agree the projection seems to assume very little decrease in oil or natural gas, which is not realistic at all in my opinion.
Hickory,
There are three scenarios, the one in that chart is the highest of the three, but I think that high scenario which has a plateau in oil output from 2030 to 2040 is wishful thinking that does not account for depleting resources.
From the IEA report-
The change in expected Russian oil exports, with the dark orange showing the loss of market share compared to the projection from last year prior to the invasion of Ukraine.
Heads up. Big agreement Israel/Lebanon, blessed by Hezbollah.
Maritime borders for gas fields agreed.
No link?
Are you a part of the negotiations? How do you know this?
https://www.washingtonpost.com/world/2022/10/27/lebanon-israel-hezbollah-maritime-deal/
Rgds
WP
https://finance.yahoo.com/news/russia-oil-power-never-return-040000187.html
Russia’s oil power ‘will never return,’ the IEA says.
‘The rupture has come with a speed that few imagined possible’
Thanks, Uncle Daddy for posting this link. This is what I have been telling guys on this blog for six months. Here is that link again:
Russia’s oil power ‘will never return,’ the IEA says. ‘The rupture has come with a speed that few imagined possible’”>
Even as Russian missiles pound Ukraine, shattering about a third of Ukraine’s electricity grid and leaving its cities and towns in ruins, President Vladimir Putin has already lost the war in one crucial respect: Russia’s huge clout in global energy supplies—which it built up over decades—is shrinking drastically, probably forever.
That’s the assessment of the International Energy Agency (IEA), the Paris-based organization comprising the world’s biggest producing and consuming nations, in its yearly World Energy Outlook, out on Thursday.
“The rupture has come with a speed that few imagined possible,” the IEA says in its 524-page report, which lays out three different scenarios for the decades ahead, depending on whether major countries stick to their green-energy commitments. “Russian fossil fuel exports [will] never return in any of the scenarios…to the levels seen in 2021,” it says.
Oil Companies Flee Venezuela, Leaving All Behind
In a move reminiscent of the Hugo Chavez years when Venezuela nationalized its oil industry, stripping by default many foreign oil companies of their assets, oil companies are once again preparing to abandon operations in the nation that houses the largest oil reserves on the planet.
Venezuela has given the go ahead to all PDVSA partners to leave their JVs. They will be allowed to sell their shares or return them, with one caveat: they must forgive any past debts and unpaid dividends, four people close to the matter told Reuters.
The situation in Venezuela, however, is so bleak that even taking the loss of not being able to collect monies due has been seen by some as an acceptable term. Equinor, Inpex, and TotalEnergies have already left Venezuela under these terms—the latter losing $1.38 billion after transferring its previously held stake to a PDVSA unit.
In all, eight foreign oil companies that had JVs with PDVSA have either transferred their ownership or given up their shares over the last five years, according to Reuters. Seven smaller firms, Reuters said, don’t have a presence in country anymore, and 15 of the JV projects with PDVSA are simply inactive.
One oil executive whose firm recently abandon its operations in Venezuela told Reuters that none of the stakes held are recoverable at book value. “Among those remaining in the partnerships, few hope to ever recoup pending dividends or commercial debts from PDVSA.”
Monroe Doctrine
More oil for USA when (not if) the invasion happens
Folks who think Russian sanctions will have little effect may need to revise their thinking. They don’t kick in until December 5th but are already having an effect.
Tankers filled with dirty Russian oil are piling up around Asian ports ahead of fresh EU sanctions
Tankers carrying Russian oil have settled at ports near Malaysia and Singapore, as large volumes of the Kremlin’s crude head to Asia ahead of the latest slate of European Union sanctions.
Data from Vortexa cited by Bloomberg showed roughly 1.1 million tons of high-sulfur fuel oil was sitting on vessels for the week ending October 24. The volume of crude is below previous record highs but is still double the level of the same time last year.
About 65% of all Russian fuel oil flows that were headed for Singapore ended up in floating storage tankers around the Malaysian port of Tanjung Pelepas over the last three months, according to Vortexa.
High-sulfur oil is considered quite dirty and is largely used to fuel ships with pollution-reduction equipment or in power generation. Most tankers have moved away from relying on it as the broader industry implemented measures in 2020 to lower emissions.
But with new EU sanctions looming, Russia is likely to lean harder on Asia as an export market, analysts say. The next round kicks in December 5 and includes a ban on insurance for tankers carrying Russian oil, even for destinations outside the EU.
Singapore is a vital refueling and export hub for crude as well as a jumping off point for ship-to-ship transfers. Traders have increasingly employed the tactic since Moscow’s invasion of Ukraine to hide Russian crude for export.
Also this: Russian Oil Is Amassing In Asian Ports
Demand for Russian fuel in the Middle East has already dropped off, and while Asian imports climb, plenty of that fuel is not being offloaded.
Everyone is expecting demand destruction in the near future. Exxon Mobil says it will be supply destruction instead.
Exxon Mobil: The Ultimate Bear Trap Is Here
As the oil bears are waiting for the demand destruction to kick in and take the oil prices lower, the upcoming supply disruptions could ruin their forecasts.
With the upcoming embargo of Russian oil, the supply disruptions are likely to outweigh the demand destruction, which could result in oil prices trading at the current relatively high levels.
Ron,
Not me, I expect demand destruction to occur to the point of lowering oil prices around 2030, I don’t consider 2030 as the near future, if oil prices are high enough there may be demand destruction or if there is a severe recession, I think the most likely scenario is a modest recession (with World real GDP growth as low as 2% yoy) with high oil prices ($95/bo or likely higher for Brent crude) due to lack of supply.
Dennis, the article was not referring to 2030 but 2023. And it was referring to the possible upcoming recession to kill demand, not EVs or renewables. And the gist was that even if we do have a recession, prices will stay relatively high because of supply disruptions.
You are ignoring Exxon Mobil’s point and jumping all the way to 2030 with your rebuttal. That doesn’t make much sense.
Ron,
I am sayng that I don’t agree with “everyone” that believes demand destruction will be severe, there are a few that believe this and others, perhaps a majority that believe demand will fall a bit, but supply will fall by less so that oil prices may decrease. I am not in that camp. Basically the question is does demand fall by more than the fall in supply (due to sanctions and lack of oil investment), for me the answer is no, I expect oil prices are likely to be in the $85- $105/bo range for Brent over the near term (up to March 2023) and may rise from there as the economy may start to recover and oil prices will need to rise to bring demand in line with supply.
WTI below $90 does not incentivize more production. Rig count is at best staying even at these prices.
https://oilprice.com/Energy/Energy-General/Baker-Hughes-Shows-Weak-US-Drilling-Activity.amp.html
For top U.S. oil producers, Permian shale output is losing steam
By Liz Hampton
Oct 28 (Reuters)
Some of the largest U.S. oil producers on Friday signaled productivity and volume gains in the top U.S. shale oil field are slowing, citing disappointing well results and output that is no longer topping their forecasts.
U.S. shale oil producer Pioneer Natural Resources on Friday told investors it will reshuffle its drilling portfolio next year to target wells with potentially higher returns, a move to boost lagging productivity levels.
Chevron and Exxon Mobil also offered cautious notes on their Permian oil and gas volumes. Chevron’s full-year output will be near the lower end of the 700,000 to 750,000 barrels of oil and gas per day (boed) it has targeted while Exxon lowered its forecast to a gain of 20% from last year from its earlier estimate of 25%.
“Productivity came in a little less than we anticipated and we wanted to rectify that,” Pioneer President Richard Dealy said of the changes during an investor call on Friday.
The company’s third-quarter oil production fell about 9% from a year earlier to 354,000 barrels per day (bpd). Quarterly output was at the upper end of its forecast, which called for output between 345,000 bpd and 360,000 bpd.
Pioneer shares fell 2.4% to $259.45 shortly after midday while Chevron and Exxon shares rose after the companies disclosed sharply higher profits.
Permian oil output was 5.4 million bpd in October, according to the U.S. Energy Information Administration, shy of a prior forecast. Output is expected to grow by 50,000 bpd in November to 5.45 million bpd, the smallest monthly gain this year.
Pioneer said its revised drilling should deliver well productivity – the volume of oil per well – to exceed 2021 levels.
“We’re really just reshuffling the portfolio and bringing forward higher return wells and deferring some of the wells” that are not as productive, Dealy told analysts. (Reporting by Liz Hampton in Denver; Editing by David Gregorio)
Could someone with deep knowledge explain “We’re reshuffling the program”. Sounds like the best days of the Permian are over.
Are those XOM and CVX production numbers gross that do not account for decline?
https://finance.yahoo.com/news/pioneer-natural-resources-increase-return-145720738.html
Ovi,
The Exxon and Chevron reports usually combine oil and natural gas output and report in boepd. The natural gas is converted to boe at about 5.8 MCF per bo.
Dennis
Got it. Checked with Enno and he shows 302 kb/d for XOM in the Permian, 117 kb/d for 2022 and 185 kb/d from previous years.
Ovi,
Note that the Novilaba estimates for 2022 are probably nit accurate as they rely on State data that will be revised.
Not that at the start of Enno’s post he gives an estimate for May output after future revisions. It is significantly higher than the number from the chart.
Ovi,
For may report for permian (link beloe)
https://novilabs.com/blog/permian-update-through-may-2022/
The chart has Permian output at 4486 kb/d in May 2022, but under total production he says:
Permian tight oil production rose to a new output record in May, at around 4.6 million b/d (after upcoming revisions, horizontal wells only). Not all this production is reported yet by the state agencies, thus the apparent drop in production in the above chart.
So roughly 97.5% of production was reported by May at the time of the report, based on Enno Peters best guess.
Ovi,
For Chevron in April 2022 Permian output was about 369 kboe/d, quite a bit lower than the claim of 700 to 750 kboe/d, some of this may be that total output of all wells they have a working interest in are reported in these press releases. Perhaps there are a lot of vertical wells in the Permian that are owned by Chevron, something doesn’t add up as there is not that much production in the Permian from vertical wells. most of it is from horizontal wells, so it is not clear how in some reports Chevron supposedly had 692 kboepd output in Permian, but Novilabs has output at about 365 kboepd in April 2022. A bit of a mystery to me.
Dennis.
Chevron has always been a major producer from vertical wells in the Permian Basin, although they have been divesting some of that over the past few years.
Also, Chevron is a large mineral owner in the Permian, and has minerals in many areas where others are the operators. I suspect the company also owns many non-operated working interests there.
Not saying this is the full explanation for the difference, but likely at least a partial explanation.
Thanks Shallow sand,
It does not seem kosher to me to have say a 50% WI in a well and then report 100% of the well’s output as your company’s output, the total amount of output from vertical wells in the Permian basin is perhaps 300 kb/d, perhaps Chevron owns all of the vertical wells in the Permian basin, but that assumption seems unwise.
The explanation is likely that the press release is false, but there is probably a disclaimer at the end saying in legal terms, the press release above is a bunch of lies.
I lived it from the beginning. Each successive infill development well was worse than the prior well. The current cost structure of drilling and completion costs make the IRRs similar to what we were seeing at $60 oil in 2021 and with associated natural gas prices stuck due to pipeline take away capacity, I would imagine most producers would be better off harvesting cash flow rather than drilling marginal wells. In my opinion, WTI needs to be above $100 per barrel to sustain the growth. The cost of drilling and completing these wells is similar to the costs seen in 2014 and the economics are worse because the newer “development” wells are less productive per lateral foot completed. We are seeing GORs rising substantially as lower pressures are turning this into a gassier field.
Until oil prices reach a stable price at above $100 (more than one year average) per barrel, you won’t see the Majors getting after it.
LTO, what is the size of your sample? I also am familiar with the point where infill wells result in poorer results, did some analysis on the Barnett probably 10+ years ago now, and was writing some things up for the AAPG conference in the 2005-2009 range on decreasing normalized productivity per frac cluster as well. After confirming a Dennis point recently (Wolfcamp wells have not increased lateral length normalized producitivity for a couple years now) I am interested in quantifying the productivity drop on all infill shale wells. Can you give me a location or company or specific formation where you have already noticed this so I can start with a confirmed data set to compare to all the others?
Reservegrowthrulz,
This point has been made many times by Mike Shellman, I believe I said for the Permian basin as a whole (mostly Wolfcamp, but also Bonespring and Spraberry formations) that the average well profile when normalized for lateral length has lower cumulative production over the first 12 months in 2021 than in 2017 and that the overall average well productivity (in EUR per lateral foot) has likely been decreasing over the 2017 to 2021 period. I do not have access to the data for lateral length so this might not be correct.
Last year Pioneer bought Parsley and DoublePoint and sold up some non core acreage to Continental. Altogether this acreage is struggling to stay on plateau and Pioneer alone is now clearly in decline. It has virtually no undeveloped land left and all its wells are extensions (i.e. moving to the peripheries in existing fields) rather than new core developments. I don’t think anyone could imagine that it wouldn’t have drilled the best areas first and I’d guess that production decline could accelerate noticeably unless it continues to acquire other properties.
Pioneer wells
Pioneer acreage.
WSJ today said that both Exxon and Chevron stated that labor, materials and spare parts were a serious problem. Let me repeat. A Serious Problem!!!!!!!
Another warning article
https://www.reuters.com/business/energy/pioneer-natural-resources-says-us-oil-output-likely-below-expectations-2022-09-07/
Sheffield is telling the truth. I admire him for calling it like it is. While the Administration tells the producers to drill more, it just isn’t going to happen without much higher prices. The inflationary trend of higher costs and supply chain issues make this a relatively meager investment compared to the Haynesville or Marcellus. The IRRs for new wells at the current costs and the bank price decks make this investment look frightening. Trading dollars.
I do however like the Permian Basin mineral platforms with dividends in excess of 10%. As prices rise, they will capture the lion’s share of the benefits. There won’t be a ton of growth but will provide steady cash flow without the stress of inflated well costs. I think most are well priced.
One thing Sheffield mentioned was diesel prices and how this affects their operations.
The diesel shortage is a very serious problem. John Kemp has been writing about that, with the gist being the only way this shortage can be addressed is to kill demand, because the refining capacity just isn’t there.
Of course, a way to kill demand is to keep raising interest rates.
On diesel-
“about 25% of total energy consumption by the U.S. transportation sector…
Diesel engines in trucks, trains, boats, and barges help transport nearly all products people consume. Diesel fuel is commonly used in public buses and school buses.
Diesel fuel powers most of the farm and construction equipment in the United States. The construction industry also depends on the power diesel fuel provides. Diesel engines can do demanding construction work, such as lifting steel beams, digging foundations and trenches, drilling wells, paving roads, and moving soil safely and efficiently.
The U.S. military uses diesel fuel in tanks and trucks because diesel fuel is less flammable and less explosive than other fuels. Diesel engines are also less likely to stall than gasoline-fueled engines.
Diesel fuel is also used in diesel engine generators to generate electricity. Many industrial facilities, large buildings, institutional facilities, hospitals, and electric utilities have diesel generators for backup and emergency power supply. Most remote villages in Alaska use diesel generators as the primary source of electricity.”
How very quaint.
A guy recently installed a generator on a Tesla so he could shorten stops to the time reqd to refill the generator tank.
Maybe those will run on diesel.
Shallow sand,
We could also limit exports of diesel fuel, though it would aggreavate our European allies, maybe limit diesel exports to Canada Mexico and Nato allies.
Generally I think free trade is the better option.
High diesel prices may both increase supply and reduce demand, a lot of this stuff could be powered with natural gas or electricity.
https://www.oilystuffblog.com/single-post/past-its-prime
Mike,
Nice post, thank you.
As I am sure you know, the most recent 6 months of RRC data is very incomplete, so your last two charts tell us very little beyond March 2022, even Enno Peters charts suffer from the same problem, the only decent data comes from the EIA for the past 6 months or so (March to September 2022).
Chart below shows Texas C plus C output in kb/d for EIA estimate and RRC PDQ, note that the data is very different starting in Feb 2022 and by July 2022 the difference is about 8%, with RRC data being 8% less than the EIA estimate. In May 2022 the difference is almost 4%.
Also if we look at all Midland Basin wells in 2017 and compare with Midland county, the Midland county wells were exceptional about 35 kbo/1000 feet vs 25 kbo/1000 feet for the Midland basin average horizontal well.
Dennis, you are correct. The Texas RRC report is really misleading as they report only the data that comes into them from the field. And that data sometimes takes months to get there and be reported by the Texas RRC. I am surprised that a lot of people, who should know better, are unaware of this.
However, that being said, your chart of the actual production from the EIA looks ominously depressing for the future of Texas oil production. It has been flat at about 5,000 Kbp/d for about 20 months now. I was unaware of this. Thanks for pointing it out. I think it is very likely to turn down very soon.
Mike, forgive me, but I was in no way referring to you in my post. I think it is obvious that I was referring to the author of the article. He/she should have known better. The intent of the author of that article, by posting those last two graphs, was clearly to show that Texas production was taking a nose dive. That is clearly not the case. Right now, Texas production appears to be pretty close to being flat at around 500 Kbp/d. The author of that article should have known that.
But thanks anyway for your reply.
Ron
Your comment above surprised me “It has been flat at about 5,000 Kbp/d for about 20 months now. I was unaware of this.
It makes me ask what is the best way to present data in the charts that are posted. My preference is to just cover the range of data presented. Other’s say graphs should be zero based.
Attached is the Texas chart and comments that were posted in the last US update and a zero based chart for comparison.
Zero based chart.
Yeah, sorry Ovi but I misread Dennis’s chart. Texas production has been flat for eleven months, if you count the first month, September 2021.
Other’s say graphs should be zero based.
I really don’t give a shit what others say, my charts are never zero-based unless production, or whatever I am plotting, goes to near zero. I want to show change and trends. If others don’t like it, let them make their own charts.
OK Ron
You and I are in agreement.
I wrote the article, Mr. Patterson. The TRRC charts at the end of the piece were used as a reference, to the opening sentence stating New Mexico accounts for all Permian growth, not Texas. Those are TRRC charts, not my charts. You will please note that in the nine months since production began falling, according to the TRRC, it has made NO revisions in their data, upwards. None. The reporting discrepancies have lessened and are being changed faster than in the past at the TRRC. Texas Permian production is declining.
The TRRC charts are irrelevant anyway. I wrote that article before the MSM came out last week saying the exact same thing…Texas Permian production is falling and low and behold, Pioneer is worried about the quality of their wells in the same sub basin. Coyne is always going to look for something to nitpick to prove he’s smarter than anybody else or to mask over the real point of someone else’s writing; please feel free to just take the damn comment down. It was a waste of time to make it.
Mike, sorry about that, please accept my apologies. I really did not read the article, I just looked at the charts and thought about how I used to post them on this blog in hope to glean something from them, hoping I could get a difference from month to month. I finally gave it up as hopeles.
I hope you are correct and the Texas RRC are trying to correct that problem.
Ron,
It is more like 11 months at roughly 5000 Kb/d, from about August 2021 to July 2022, not 20 months.
Mike,
Nobody said anybody is smarter than anybody else, the point is the RRC data is not very good, and you are wrong that the RRC data has not been revised, It gets revised each month. Your article was great, except the last two charts which shows a trend that does not exist.
To convince yourself just go to the following page and look at comparative statistics for Texas (spreadsheets listed on right side of page).
https://www.eia.gov/petroleum/production/
Here’s the data from the May 2022 comp-stats from Feb 2020 to Feb 2022
5,401
5,447
5,123
4,226
4,595
4,712
4,660
4,622
4,633
4,640
4,616
4,619
3,763
4,758
4,742
4,726
4,709
4,735
4,774
4,815
4,772
4,734
4,664
4,456
4,098
below we compare the two in a chart, RRC data may be a bit better than it once was, but the estimates are not as good as the EIA estimates, especially for the most recent 12 months.
I agree most growth from the last 11 months has been from the Delaware basin, particularly Lea and Eddy counties in New Mexico.
Not clear that Texas production is falling based on the EIA C plus C estimate from September 30, 2022, there will be a new estimate tomorrow.
There was some discussion of Texas RRC data for crude plus condensate (C plus C). I pulled together some old RRC data to show how it has been revised over time, I also took a quick look at EIA 914 estimates from Jan 2015 to Feb 2022 and compared with Enverus (formerly Drilling Info) estimates, the EIA estimate was about 6 kbo/d too high on average(an error rate of 0.13%). As I have said before, the EIA output estimates for the most recent 18 months are far more accurate for Texas C plus C output than the PDQ estimates from the RRC.
Russia is finally admitting it can’t keep up with sanctions in place:
“The draft budget anticipates Russian oil and gas condensate output at 490 million tonnes in 2023 (9.84 million barrels per day (bpd), a 7%-8% decline from 525-530 million tonnes expected this year (10.54 million bpd – 10.64 million bpd).
The fall could be even deeper, according to a Reuters analysis based on the published budget expectations for excise duty and revenue from oil refining and exports.”
https://www.msn.com/en-ca/money/topstories/exclusive-russias-finance-ministry-cuts-2023-taxable-oil-expectations/ar-AA13u4a9
(9.84 million barrels per day (bpd),
That’s a 700,000 to 800,000 barrel per day decline from their hoped-for 10.54 to 10.64 Mbp/d this year. They will be damn lucky if they make that.
The fall could be even deeper, according to a Reuters analysis…
Yeah, a lot deeper.
The staggering inflationary effect of diesel has been vastly under-reported. Almost all the foodstuffs and accoutrement on the shelves of supermarkets were brought in on eighteen-wheelers that run on diesel. Ditto for Amazon products going to distribution centers. It’s not just the oilfield that runs on diesel, it’s Salinas Valley produce, Iowa corn, Nebraska meat.
Add in the astounding price of fertilizer and it’s not hard to see the reason for food prices. In soil that has been used for over a hundred years it’s impossible to raise a good crop of anything without nitrogen, mostly made by the Haber-Bosch method, using methane as feedstock. And potash, don’t forget the potash.
Over the last few decades, America has deconstructed refineries. She has also relied on Russia for ammonium nitrate (60%) and potash (40%). So has Europe.
Before it’s all over, the world is going to pay an awful price . . . first in prices, then with outright food shortages.
“Before it’s all over, the world is going to pay an awful price . . . first in prices, then with outright food shortages.”
And then with population decline…
as is what happens to all organisms when the population enters a situation of ecological overshoot [growth in excess of sustainability based on annual productivity of the system].
Sorry to point out that human population overshoot may be to the tune of roughly 6 billion, give or take a couple billion.
Inflation, growth stagnation or contraction, unequal distribution, rationing, and retreat of civil society are the kind of early symptoms we should expect as the overshoot condition correction begins to play out.
The best we can do is work hard keep change gradual, as I see it.
Thats what the Fed has been trying to do for the past 50 years, although I do not think any of the major earth institutions have digested the concept of overshoot, which is a scientific principle that isn’t a hot topic in the global schools of Economy and Policy. Just about everyone is still presuming that growth can go on indefinitely.
One ‘Ron Patterson’ once posted a fine summary of the notion-
https://peakoilbarrel.com/carrying-capacity-overshoot-and-species-extinction/
Thanks, Hickory for posting this. I don’t remember posting it. But I did get a kick out of reading just a few of the 393 replies to the post. I don’t think many opinions have changed since that was posted five years ago.
https://www.protectthackerpass.org/solutions/
This is a good one, aswell!
Saludos
el mar
Many will die quietly from cholera outbreaks as sanitation facilities fail from inconsistent power availability. Lebanon is a unfortunately great example of a middle income country quickly falling into the throes of endemic cholera. Too many people and too much poop. In a worst case scenario it’s not hard to imagine the world’s population being halved by 2050 because of it.
Lebanon cholera: ‘We’re afraid of everything now’ https://www.bbc.co.uk/news/world-middle-east-63414875
https://www.nytimes.com/2022/10/31/health/cholera-outbreaks-vaccine.html?smid=nytcore-ios-share
Humanure systems can help if people get the knowledge on how to safely process their own waste:
https://humanurehandbook.com/
We’re still consuming last year’s harvest. What is on the way in 2023-2024 is going to be a nightmare.
Diesel exports from US will likely get banned as this plays out. Something like 35% of all US petroleum oil exports are diesel. Going to effect those countries.
There is a reason the Eurodollar curve is deeply inverted. It’s because shit is hitting the fan globally.
I imagine higher prices for crude oil will both reduce demand for oil and increase supply relative to a scenario with low prices.
There is some turmoil due to Russian diesel missing from the market, eventually diesel will move to where it is needed most guided by market forces. The adjustment is not instantaneous, it will take a year maybe more.
Nope. The debt that supports current prices implodes. Say there is currently $300 trillion of debt in the world. That debt supports the use of energy as means to repay the debt.
Just say 1/3 of that debt disappears in relatively short period of time. Demand shock! Prices go lower much lower.
HHH,
Yes WW3 or an asteriod strike might also occur, the odds are low that the scenario you envision will be correct..
Dennis it doesn’t take a asteroid strike or world war 3 for debts to be defaulted on.
However an energy crisis would work very well in destroying debts.
HHH,
In the past, energy crises have not necessarily destroyed debt. There are many who complain that there is too much debt, I am not in that camp. I agree that a lack of credit will be a major problem if it should come to pass. I believe the ods are low that we will see a credit crisis in the next year or less as you seem to be predicting.
Can you give us your best guess for the average monthly price for Brent crude in March 2023? In the past you have claimed $25/b for oil in March 2023, but this may be an intraday low price or a daily closing price for a single day, you have not been very clear about what you expect to occur.
Some estimated numbers to draw a picture. About 500,000,000 gallons of gasoline and diesel are consumed daily in the US. About 63,000 trucks carrying 8000 gallons are needed every single day to deliver that fuel. In your minds eye picture that many tankers parked end to end. Wind turbines aren’t going to make a dent.
Coal can be used to make nitrogenous fertiliser. That’s how China does it. But capex per tonne of capacity is twice that of the natural gas route.
The two companies that had the most questionable initial reserve estimates, and the largest subsequent negative revisions, are Continental and Chesapeake. Continental is being taken back into private ownership, so there will be no indication how big the overestimation finally becomes, and up until 2018 Chesapeake had been gradually selling itself off and the if the trend in falling reserves continues it will be cease to be in about five years.
Chesapeake:
Thanks for these industry snapshots George. They are very informative.
https://market-ticker.org/akcs-www?post=247307
It is in fact fraud to lead investors to invest in an industry that is going to be shut down and has no chance to recoup its capital.
“This last example has the potential to return the American people to a lifestyle akin to that of the 1700s if not before. That’s not hyperbole or a joke — its real, and those who poo-poo it are wrong. “</b
"We’re headed for another one, much worse, with carbon-based fuels. As I pointed out repeatedly no CEO will invest in something that they have been told by the government will be made worthless before it can return a profit. In fact to so-invest would be fraud upon the shareholders and, to the extent money was borrowed, upon the lenders as well. This is now confirmed; the refineries that were shut down will not be restarted. Is that action by the Executive legal? No, it is not. And while it might be Constitutional if initiated by Congress through formal legislation that’s not what’s happened here in the main.”
https://oilprice.com/Latest-Energy-News/World-News/Energy-Execs-Tell-Granholm-Shuttered-US-Oil-Refineries-Wont-Restart.html
“Building a refinery is a multi-billion dollar investment. It may take a decade. We haven’t had a refinery built in the United States since the 1970s. My personal view is that there will never be another refinery built in the United States ,” Wirth said at the time.
Oil and gas companies would have to weigh the benefits of committing capital ten years out that will need decades to offer a return to shareholders “in a policy environment where governments around the world are saying ‘we don’t want these products to be used in the future,’” Wirth added.
Yes , shale is a Ponzi . Art Berman called it a ” a farewell party ” , When will they ever learn ?
Slight problems with the fracking scam:
1. you need 20,000 to 200,000 litres of diesel per hole to run the trucks that ferry everything back and forth
2. you need masses of steel pipe
3. you need interest rates at close to zero so that interest payments on loans amount to almost nothing.
4. you need properly functioning financial markets -well maybe not if utterly corrupt governments are willing to throw billions into yet another black hole with a negative return on investment, which they usually are more than willing to do.
5. you need a fit and healthy workforce that knows what is going on and how to do things.
6. you need to arrest and/or bully protesters -NATOstan governments are getting rather good at that, so it may not be an issue.
Have a nice day . Enjoy it while it lasts . All Ponzi schemes come to an end (disaster ) .
Shale development is not a ponzi scam… seems like an overly extreme statement.
A ponzi scam is fraudulent use of funds by raising new investor money to pay old investors off while skimming off the top and never making actual investments…. oil and gas shale development is not an illegal ponzi, just expensive and high risk/return and certainly not for everyone. Personally, I think it’s an engineering marvel and there is much to celebrate for the many engineers, geologists, rig crews, completion crews, etc who made it happen. To go from ~1,000,000 BOPD to 5,000,000+ BOPD in the general Permian in 10 years is a phenomenal accomplishment. There is much more to celebrate than you are recognizing.
Like many other legit businesses, some efforts make money and others do not. Not all Starbucks locations make money and many close every year. It’s the overall package performance that counts. The ole’ ancient rule of thumb in conventional oil & gas wildcatting was nine out of tens wells would be failures, but the one success would pay for them all. Shale development has different grades of success and failures, but dry holes are rare, so it’s a different approach overall to assess success levels of the whole package. But when you get into a run of good rock with EUR’s in the 1 MMBOE/well range, those pay for a lot of Tier 2 and 3 efforts at average AFE’s.
I’m not saying there hasn’t been shenanigans, corruption, waste and high leverage in shale development… but those elements have been integrated into our oil patch since it began. Just part of the party… yes still with many martinis. Nothing new here on how we behave in our industry with shale development, just attacking the motherload now…. so Art may eventually be right with the “farewell party” comment, but humans don’t know when to stop, so more fun surprises are likely on the way in my opinion.
Ponzi is a bad word and not applicable, I agree. In many ways the US tight oil phenomena is worse than that. Its been the most abused, lied about and mismanaged hydrocarbon resource in American history.
Find me 5% of 38,000 Permian tight oil wells with 1MM BOE UR’s to date, please. UR’s to date, not exaggerated EUR’s. And please leave off the 6:1 horse shit. Name them. Point me in the right direction. I can count those kinds of wells on two hands and one foot in DeWitt County, for instance.
Tight oil has been an engineering “accomplishment” using very old technology and lots of other people’s money. Hardly a marvel, but good nevertheless. Want to see a marvel… look at 25,000 ft. TMD wells on the ledge in the GOM that require 20,000 PSI SS BOP stacks. Or lets look at a well profile offshore Abu Dhabi that just hit the 51,000 ft. TMD mark. Tight oil and tight gas requires very little talent, actually.
With 60 years of experience as an operator, and a great student of our industry’s history, I deeply resent the implication that what has happened the past two decades with tight oil and tight gas has been “typical” of past oilfield behavior. That’s a big time bad comment, and not the truth. Period. In the past we always had to deliver on our promises or we would not have survived. We raised money from within, partnered with our own, and we made money so they would come back. That’s how, with minor exceptions, we fueled America for the past 120 years. We didn’t lie. Now the tight industry lies about everything and STILL gets OPM.
The biggest liars are the royalty owners, the less than 1% of the American public that have made 3/4 of a trillion free smackers from tight oil and tight gas. They never want the party to end and they will typically say anything to advance their agenda of free money. Indeed, they rely entirely on “people” who will never stop…as long as they are using other people’s money.
Dang Mike, I appreciate your passion,
I will respectfully respond one by one…
Why is the US tight oil mismanaged? Isn’t it logical to remove a resource from the ground at the highest price possible as soon as possible to maximize return? Isn’t it reasonable to have a learning curve on efficiency and development? That’s simple, free market logic, from a business perspective. The future will figure itself out, it always has. Furthermore, leaving resources in the ground to satisfy reserve demand in a dying industry is much like the man discovered dead of dehydration in the desert with a half canteen full of water. Why should private enterprise keep their profits in the ground unnecessarily? I do not agree that shale has been mismanaged. Burn the bit to the right and keep punchin holes. Opinions vary on the talent it takes to drill a 10,000 lateral vs a deep Abu Dhabi test… both remarkable in my opinion.
You know as well as I do that I can’t provide a comprehensive list of every well that has or is projected to EUR ~1 mm BOE, that’s an unreasonable request for this debate and platform. But they are out there, I spend hours a day surfing Drillinginfo/TX RRC Data and find remarkable production. I’m a bit addicted to it. I see wells offsetting me doing great things…. Not all, but many…. However, unfortunately…Let’s see if I can predict how this would go… I produce a few well and data examples showing their remarkable production… then your response…. “Nice cherry picking of perfect data” ….
But… Here are a few widespread examples example to look up in your free time:
-Howard County – Fezzik B # 2447WA
-Loviing County – Boz 55-2-6 Unit #1H
-Reeves county — Thunderbird Unit #5002H
All the above are at or close to 1 MM BOE and still producing nice volumes. While not the norm, I grant you, these examples will grow in numbers over time as newer wells with better technology offset the old legacy wells that were part of the learning curve.
Not sure why Dewitt County reference came into play, that’s Eagle Ford. Ironically, my physical back yard. I was talking purely Permian Shale. I agree Eagle Ford has more challenges than Permian shale, as do Bakken, Niobrara and Scoop/Stack.
So, a bigger question here, Mike, is why do you hate shale so much? It’s a bounty for the using, a blessing to bridge energy transition and geopolitics with flexibility. Why the bitterness towards success in our industry and developing it? The oil patch has always attacked opportunity with a spasmatic rush, monetize the asset, then peak out and then moved on to the next boom. Why does the frenzy on developing the Permian shale offend you so much when it is just a repeat of history for US oil development. East Texas Oil Field, Tea Pot, Spindle Top, Yates Field, SACROC Unit, Wolfcamp Shale, Bone Springs, Sprayberry… all have been developed with a frenzy that defines US oilmen. Rush to grab land and control it, then turn as many bits as you can to the right before someone else does it first and beats you. When things deplete… move on.
Another thought on your comment on OPM and Oil…… The OPM strategy in oil (as wells as all mining endeavors) has always been a constant in our industry. Maybe you didn’t pursue this strategy, which I applaud, but it has always been my experience that pursuit of high-risk mineral development takes risk money and risk money is run on OPM always. Without OPM, many oil, gas, mining reserves may never have been discovered. The conservative approach can’t get it done for what man needs here.
As for your comments about Oil industry behavior, I did not intend to offend, but it is a generally accepted stereo type (and my personal 30 years of observation) that our industry is full of spirited men who gamble, hit it big, go broke, Drink martinis, make deals on the fly, take chances, etc etc… it’s the nature of those types of humans to be attracted to exploring for any natural resource. Sid Richardson, H L Hunt, Pattillo Higgins, Glenn McCarthy, Clint Murchison, Monty and Tex Moncrief, Tom Slick… were all gambling on the fly with OPM.
Finally, I am offended for mineral and royalty owners of America when you spewed out “the biggest liars are the royalty owners”. Very, very weak comment Mike. Royalty owners deserve your respect and it is a blessing that we have private ownership of minerals in the US, it’s an almost unique global situation as most global mineral ownership is only owned by the government, crown, dictators, etc. Their minerals are their heritage, hard work, luck or opportunistic investment grab… that is what capitalism is and what makes the American competitive spirit alive. Also, never were those minerals ”free money”. They were either inherited from a hardworking ancestor, bought as part of a land investment, or opportunistically purchased as a direct mineral purchase like myself… So, Mike, how does that make royalty owners liars? Tell me specifically. Of course, we royalty owners never want the party to end, it’s a great party! But it will end… and for some royalty owners, the party pays for food, gas and survival month to month. The mineral and royalty owners own it, the oil company is just a guest for the term of the lease. That is freedom and America at its best.
.
Corporate stock buyback window opens back up this week. CTA machine will likely chase the momentum higher. Making for a large melt up in prices. Bonds will likely also be bid.
This complicates things for the FED. It eases monetary conditions. Makes it harder for inflation to come down. Also makes oil prices more sticky for the time being.
FED’s credibility is on the line here. They flinch even in the slightest way. Like hint at a pause. Markets and prices will rally but inflation will remain hot.
Which in the real world means places like China and Japan have to source dollar funding at an even higher cost as prices remain high or go higher.
“FED’s credibility is on the line here. ”
The FED has made sequentially bad decisions for years.
They got us into an interest rate trap an 8th grader could have seen coming.
If interest rates go up we lose, if interest rates go down we lose.
While I agree with you. In my eyes FED hasn’t had any credibility in a real long time. If the general public that believe they can and will get inflation down. They lose confidence they don’t spend.
It’s a big psychological game because the FED can’t and doesn’t print money and doesn’t oversee the real monetary system the Eurodollar.
All they have is a game of confidence.
FED has negative income now from the assets it owns and can no longer remit to the treasury. Can’t afford to pay interest on debt either. Went from plus $100 million to negative $80 million. Or better stated their income from assets doesn’t cover their cost.
They make what they call a deferred asset on their balance sheet so when they return to positive cash flow they can pay interest and remit to the treasury anything above what it cost them to run. They can’t and don’t print money at the FED.
My guess is they will stop paying interest on the 2 trillion at the FED’s reverse Repo. Forcing that money into treasury bonds, notes and bills. And we will see yields go from 40 year highs back to the Covid low’s.
Only question is when. Only problem is inflation. Anybody thinking we will somehow muddled through all this is mistaking. Things are going to break in monetary system.
HI HHH , nothing to say much but thanks for teaching me about the Eurodollar . Now as I connect the dots this is FUBAR . Lagarde says ” I don’t know from where the inflation came ” . Fire her and the whole ECB . F*****G blind . You printed all the Euro’s to buy bonds of the PIIGS .
“U.S. diesel supplies are becoming critically low with shortages and price spikes likely to occur in the next six months unless and until the economy and fuel consumption slow.” Reuters
It can be said two ways
-a slowdown in the economy will decrease diesel demand, or
-a decline in diesel supply will slow the economy
Get used to the pattern folks.
Europe running out of Diesel.
https://oilprice.com/Energy/Energy-General/Repsol-Parts-Of-Europe-Are-Running-Out-Of-Diesel.html?utm_source=tw&utm_medium=tw_repost
From the article:
“ U.S. diesel fuel stocks have been on a steady decline for months, reaching the lowest level since 2008 as of October. The United States currently has just 25 days of diesel supply in reserve. In the United States, a lack of refining capacity and years and years of underinvestment in new capacity, combined with refinery closures and maintenance, have contributed to the current low supply situation.”
I thought part of the issue is that LTO produces very little diesel fuel. Is the world’s dependence on LTO part of the diesel supply problem?
stephen,
This is not likely a problem, see chart below from
https://www.eia.gov/dnav/pet/hist/LeafHandler.ashx?n=PET&s=WD0TP_NUS_2&f=4
Africa Shows How Hard It’s Becoming to Pump Crude Oil Bold Mine
Crude production in western Africa has fallen by one-third since 2010 and will drop again this year.
The world’s infrastructure to pump crude out of the ground is creaking, and nowhere is that more apparent than off the west coast of Africa. Years of under-investment, theft, sabotage and civil strife have combined with harsh operating conditions to undermine the region’s oil production, sending it into a slump from which it may never recover.
In 2010, west African countries were pumping close to 5.5 million barrels a day of crude and condensate, about 7% of global production. By 2021, that had fallen to little more than 3.5 million barrels a day, and the region’s share of the total had dropped by two percentage points. This year will see levels fall further.
West Africa’s two big producers, Nigeria and Angola, are both struggling with fields in long-term decline. But the problems don’t stop there.
The output cuts agreed by the OPEC+ group of oil producers in 2020 in response to the Covid-19 pandemic appear to have resulted in permanent losses of production capacity for the two west African giants. Neither has been able to restore the output that was shut between April and June 2020, even as their targets began to rise in early 2021.
Production data from Nigeria’s upstream petroleum regulator show crude output dropping below 1 million barrels a day in August and September. That’s barely half the level seen in the first months of 2020 before the OPEC+ cuts. Even when output targets began to rise, Nigeria’s production continued to go in the opposite direction.
The country will boost output by 500,000 barrels a day by the end of November, according to Nigerian National Petroleum Co. Chief Executive Officer Mele Kyari. That’s a tall order and would take production to a level that it has not reached in more than two and a half years. I’m not convinced it can get there.
There is a lot more to this article with lots of charts. But it is behind the Washington Post paywall. However, the same article can also be found on Bloomberg.
Africa Shows How Hard It’s Becoming to Pump Crude Oil
US August Production increased by 102 kb/d to 11,975 kb/d. July production was revised up by 73 kb/d to 11,873.
Full update Wednesday.
Oil CEOs warn this winter’s energy crisis will be nothing compared to the next
ABU DHABI, United Arab Emirates — Politicians and governments around the world are bracing for potential civil unrest as many countries grapple with mounting energy costs and rising inflation.
The global economy is facing an onslaught from multiple sides — a war in Europe, and shortages of oil, gas and food, and high inflation, each of which has worsened the next.
Concerns are centered on the coming winter, especially for Europe. Cold weather, combined with an oil and gas shortage stemming from Western sanctions on Russia for its invasion of Ukraine, threatens to upend lives and businesses.
But as much worry as there is ahead of this winter, it’s really the winter of 2023 that people should be worried about, major oil and gas executives have warned.
“We’ve got a difficult winter ahead, and subsequent to that we’ve got a more difficult winter in the year ahead of that, because the production that is available to Europe in the first half of 2023 is considerably less than the production we had available to us in the first half of 2022,” Russell Hardy, CEO of major oil trader Vitol, told CNBC’s Hadley Gamble during a panel at the Adipec conference in Abu Dhabi.
“So the consequences of energy shortage and therefore price escalation, all of the things that have been discussed here about the cost of living, the expectation of problems ahead, clearly need to be thought about in that context,” he said.
BP
CEO Bernard Looney, speaking at the same panel, agreed. Energy prices “are approaching unaffordability,” with some people already “spending 50% of their disposable income on energy or higher,” he said.
But through a combination of high gas storage levels and government spending packages to subsidize people’s bills, Europe may be able to manage the crisis this year.
“I think it has been addressed for this winter,” Looney said. “It’s the next winter I think many of us worry, in Europe, could be even more challenging.”
Steering away from FFs:
https://www.carbonbrief.org/in-depth-russias-war-means-fossil-fuels-will-peak-within-five-years-iea-says/
“It says many governments are “looking to accelerate structural change” in their energy systems. It gives examples including the US Inflation Reduction Act, the REPower EU plan, Japan’s Green Transformation (GX) programme and South Korea’s targets to boost nuclear and renewables.
Similarly, the “massive build-out of clean energy in China” will cause a peak in coal and oil use before 2030. And renewables will meet two-thirds of India’s growth in electricity demand.
Overall, the outlook says “the lasting gains from the crisis accrue to low-emissions sources, mainly renewables” as well as “faster progress with efficiency and electrification”.
(The outlook says: “Demand-side measures have generally received less attention, but greater energy efficiency is an essential part of the short- and longer-term response.”)
These gains mean that, for the first time, the IEA now expects fossil fuel use to peak and then decline. Its outlook points to a peak in total fossil fuel around 2027 – in just five years.
The report explains just how big a moment this decoupling will be for the world:
“Global fossil fuel use has risen alongside GDP since the start of the industrial revolution in the 18th century: putting this rise into reverse while continuing to expand the global economy will be a pivotal moment in energy history.”
Rgds
WP
https://mishtalk.com/economics/hoot-of-the-day-russian-oil-gets-to-us-via-sanction-loophole
Russian oil makes it to USA via sanction loophole
MSM catching up with stuff that has been posted here for months: https://www.ogj.com/drilling-production/article/14284804/eia-decline-in-duc-wells-may-limit-us-crude-oil-production-growth
Attached is a sneak preview of a chart in this afternoon’s US Update.
As George notes, we have been tracking the drop in the DUC count for a while.
The attached chart shows that in these four basins, the DUC count dropped by 3 in September. However in the Permian, the DUC count dropped by 14 in each of the last two months.
Thanks George. I will use this link.
WTI just crossed above $90/b.
Sometimes there is mention of high GOR in the Permian basin. In chart below we have the historical data from the DPR. The rise in GOR from 2019 to 2021 may be due to a higher percentage of producing wells in the Delaware Basin (which has higher GOR) as oil companies began to focus on expanding their Delaware Basin completion rate. The average productivity of 2019 and 2020 wells in the Delaware basin are significantly higher than the average in the Midland basin which might explain this shift.
https://www.cnn.com/2022/10/26/energy/europe-natural-gas-prices-plunge/index.html
Natural Gas Prices are falling in Europe recently to about $10.82/MMBtu (37 Euro/ MWhr) from an August high of about $68/MMBtu (235 Euro/MWhr).
https://my.elexys.be/MarketInformation/SpotTtf.aspx
Interesting piece on who is profiting from high natural gas prices in Europe. It is not who some European leaders believe.
https://www.forbes.com/sites/thebakersinstitute/2022/10/26/whos-to-blame-for-exorbitant-natural-gas-prices-in-europe-hint-maybe-not-who-you-think/?sh=23a322307fa9
A new Open threat Non-Petroleum has been posted.
https://peakoilbarrel.com/open-thread-non-petroleum-nov-2-2022/
A new thread updating US August oil production has been posted.
https://peakoilbarrel.com/us-august-oil-production-at-post-pandemic-high/