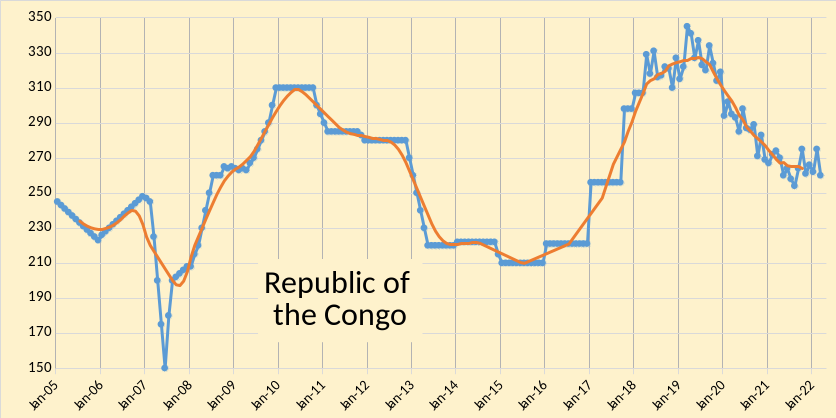
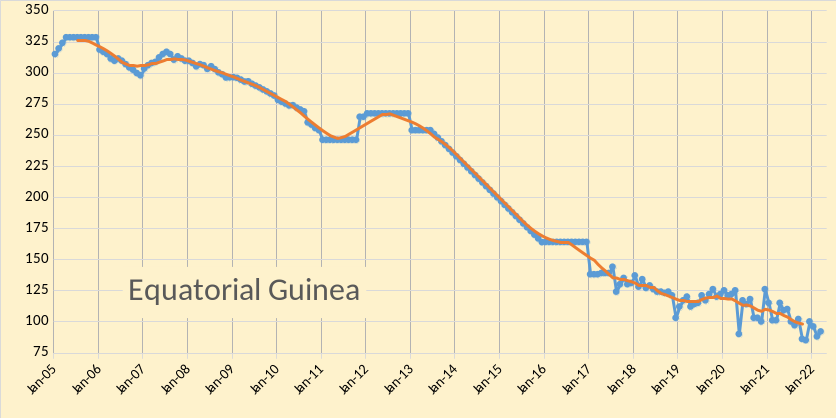
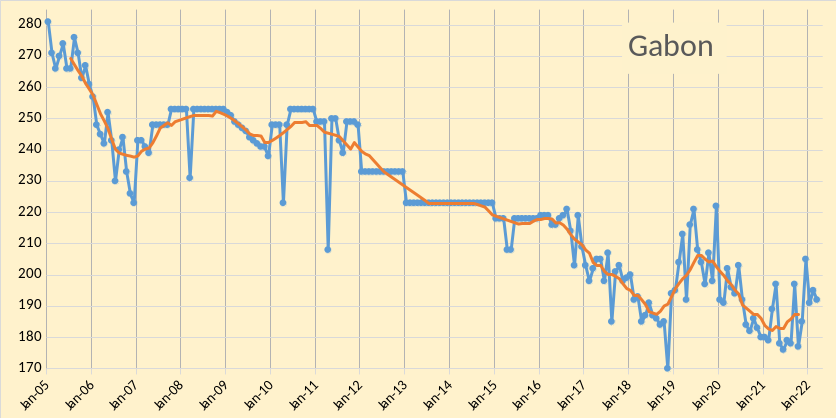
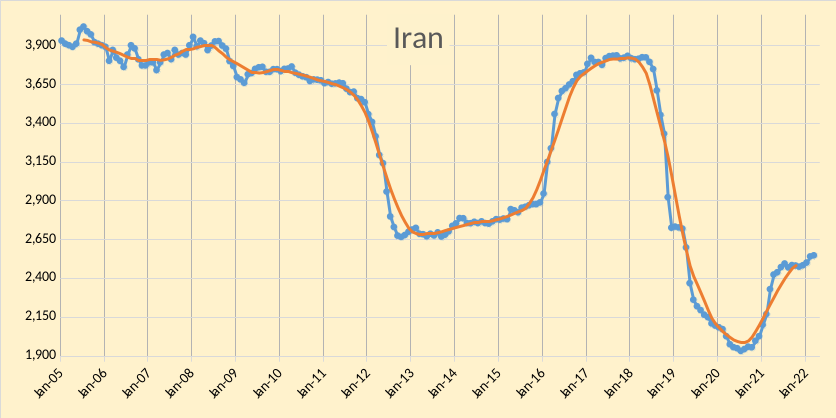
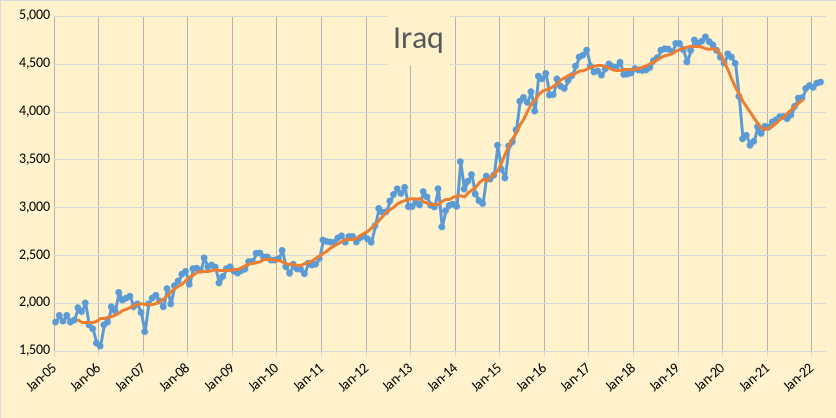
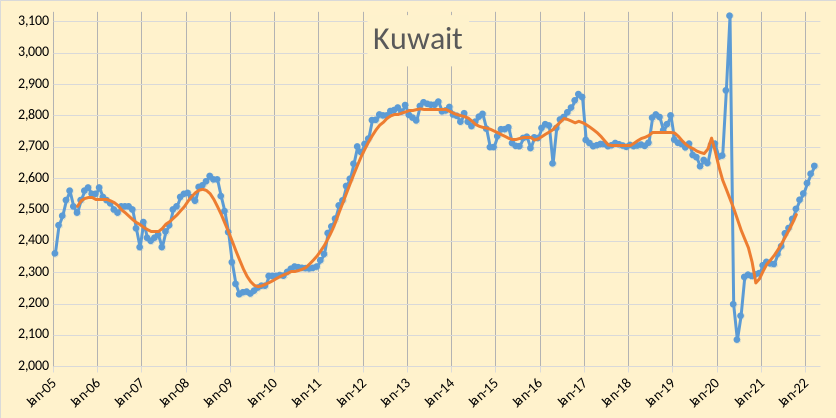
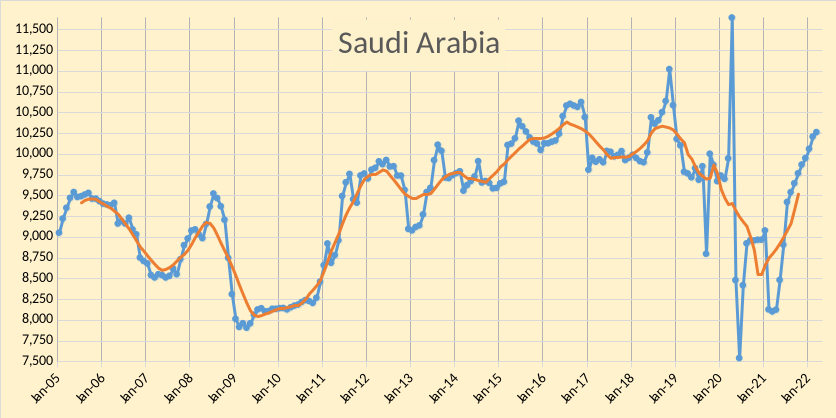
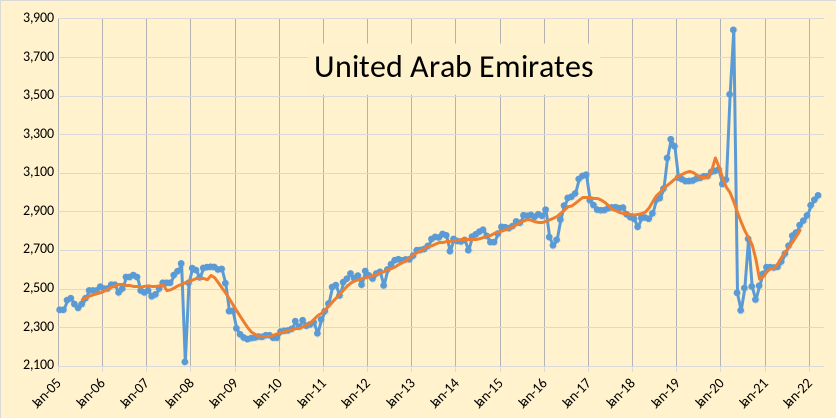
The OPEC Monthly Oil Market Report (MOMR) for April 2022 was published last week. The last month reported in each of the charts that follow is March 2022 and output reported for OPEC nations is crude oil output in thousands of barrels per day (kb/d). In most of the charts that follow the blue line is monthly output and the red line is the centered twelve month average (CTMA) output.
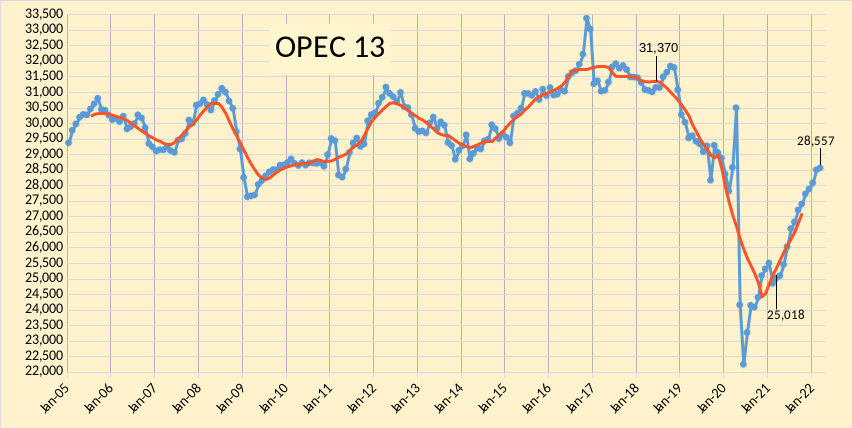
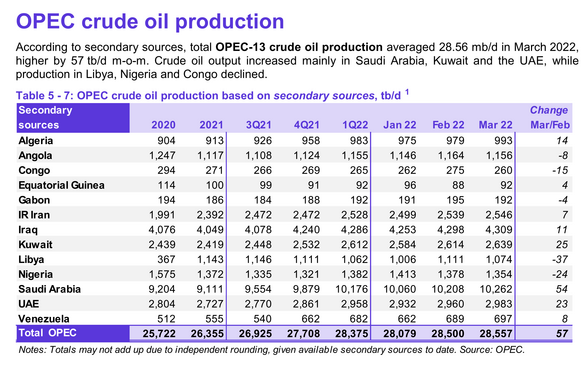
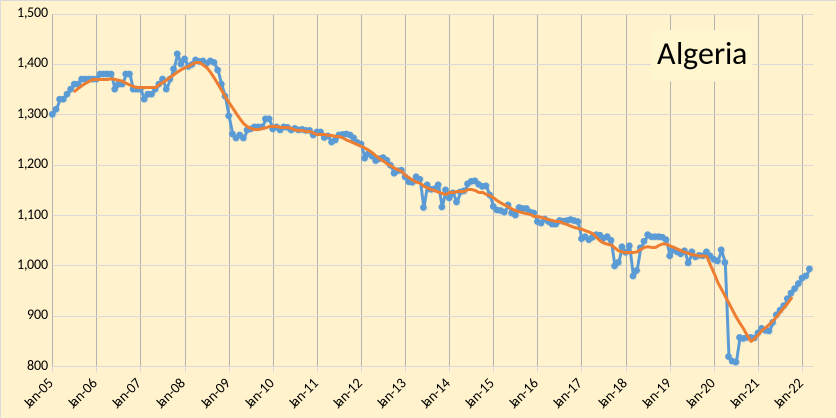
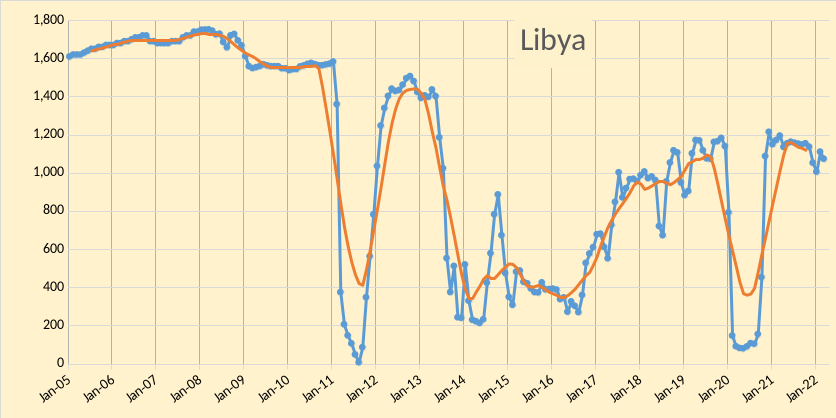
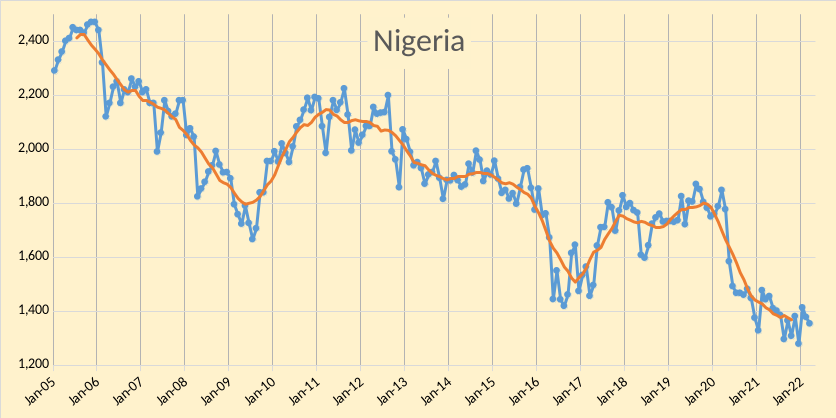
OPEC output increased by 57 kb/d according to secondary souces in March 2022. January 2022 output was revised higher by 45 kb/d from what was reported last month and February 2022 output was revised higher by 27 kb/d compared to the March 2022 MOMR. Most of the increase in OPEC output was from Saudi Arabia(54 kb/d) followed by Kuwait (25 kb/d), and UAE (23 kb/d). Five OPEC members saw increases of less than 15 kb/d (total of 44 kb/d for that group of 5 nations). Five OPEC nations had lower output in March, with Libya (-37 kb/d) and Nigeria (-24 kb/d) having the largest decreases in output and the other three nations with lower output in March having a combined decrease of 27 kb/d.
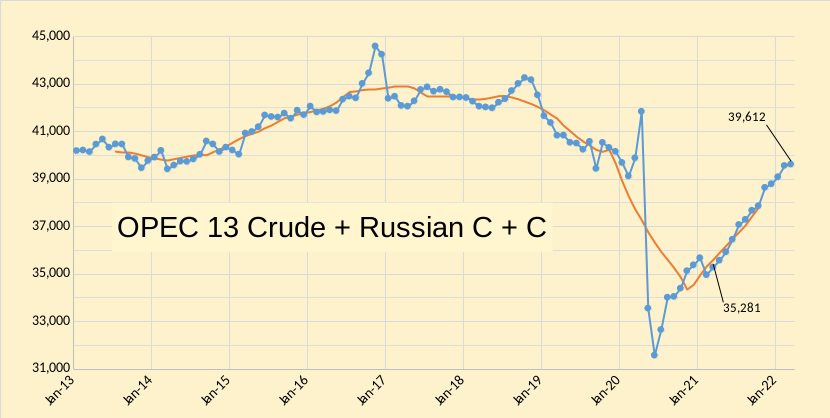
In the chart below OPEC 13 crude and Russian C+C are shown, I expect that OPEC 13 crude plus Russian C + C are likely very near the short term peak unless sanctions are removed from Iran in the near future. Any potential future increase for OPEC 13 will likely be more than offset by decreases in Russian C+C output over the next 6 to 12 months without increasd output from Iran.
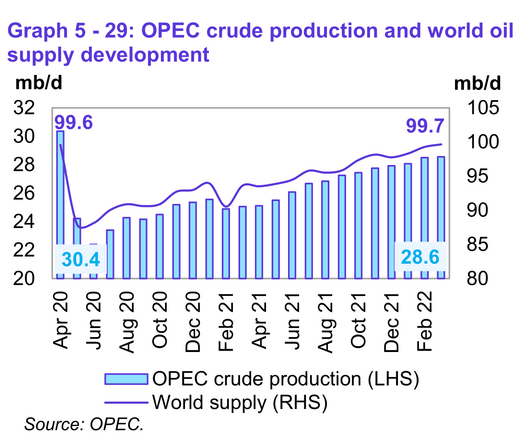
World liquids output surpassed the level from 24 months earlier based on OPEC estimates in figure 4 above.
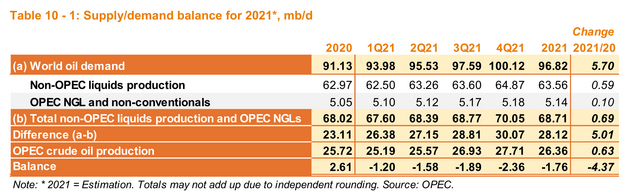
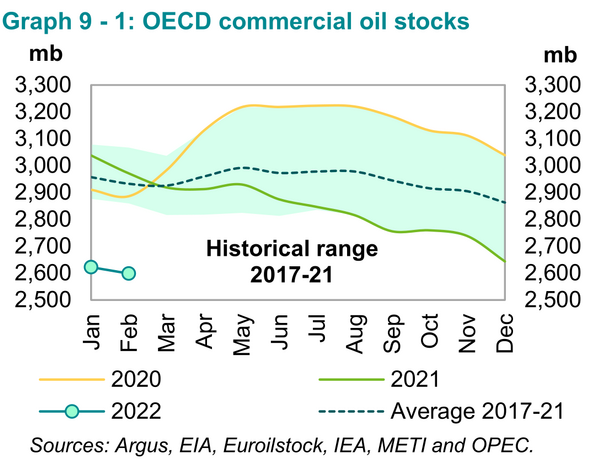
In figure 5 above we see that OPEC produced 1.76 Mb/d less than needed to keep the market in balance in 2021, if we assume their estimates for supply and demand are correct. This implies a draw on World petroleum stocks of about 642 million barrels in 2021. As can be seen in Figure 7 above OECD commercial stocks decreased by about 450 million barrels in 2021 so the rest of the stock draw either came from government controlled stocks, oil on water, or non-OECD stocks. We know OECD government stocks decreased by about 57 million barrels in 2021 and oil on water increased by 54 Mb in 2021 (see MOMR Appendix), this implies non-OECD stocks fell by about 189 million barrels in 2021.
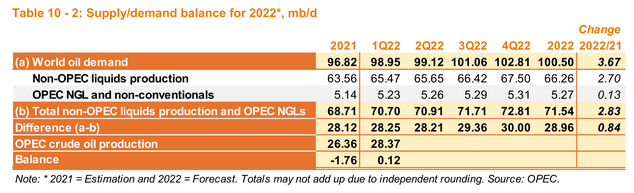
My estimate for OPEC capacity is roughly 130 kb/d above the March 2022 output level under the assumption that Iranian sanctions are not removed in 2022. Currently negotiations with Iran are not going very well and it seems unlikely a compromise will be reached soon. This suggests oil stocks will continue to decrease if the estimates for the call on OPEC in the third and fourth quarters of 2022 outlined in figure 6 above prove correct. Note the large increase in non-OPEC output forecast in 2022 in figure 6, about a 2630 kb/d increase in output in one year (21Q4 to 22Q4) is forecast for the non-OPEC oil producers, including 960 kb/d for the US, it seems this forecast is likely too optimistic for oil supply. Bottom line, oil supply is very likely to be tight in 2022 and oil prices may be high unless a recession destroys some demand.
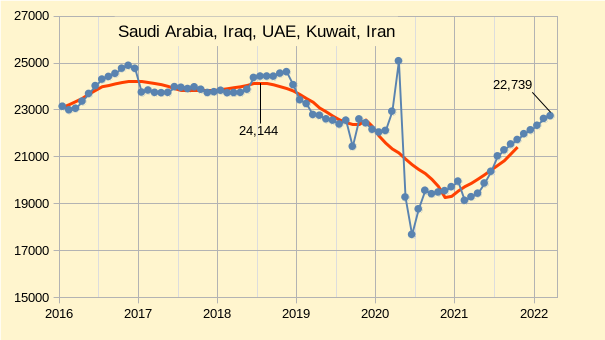
In the chart above we see the combined output of the big 5 OPEC producers where most spare capacity might reside. If we deduct the spare capacity of Iran from the other 5 OPEC nations in Figure 8 and then deduct output in March 2022, we are left with only about 130 kb/d of spare capacity for OPEC (about 28687 kb/d of capacity when we add back output from the other eight OPEC nations in March 2022.) Note that I use the maximum 12 month average OPEC output to estimate capacity. If Iranian sanctions were removed, approximately 1275 kb/d of OPEC capacity might be added over 6 to 12 months, bringing total capacity to 29960 kb/d.
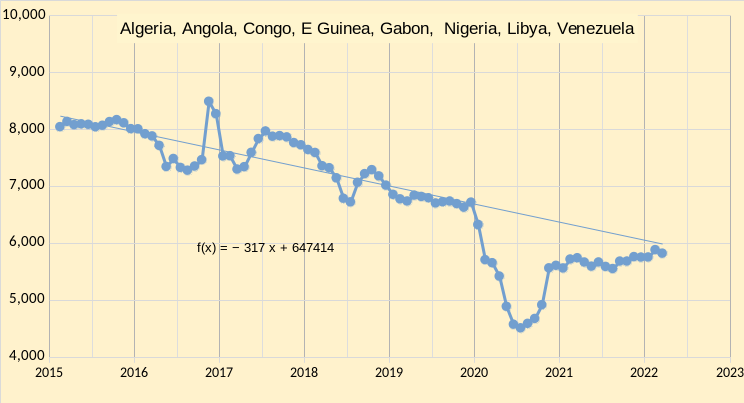
If we consider the other eight OPEC producers in Figure 9 above and look at the trend from Jan 2015 to December 2019 we find an annual decline rate of about 317 kb/d. Much of any OPEC spare capacity that might have existed in December 2019 may have been eroded by the declining output of this group of 8 OPEC nations (about a 1000 kb/d decrease from Jan 2019 to Jan 2022). I have used March 2022 output from these 8 nations to estimate capacity in March 2022, the concern is that future decline may reduce OPEC output capacity unless new resources are developed.
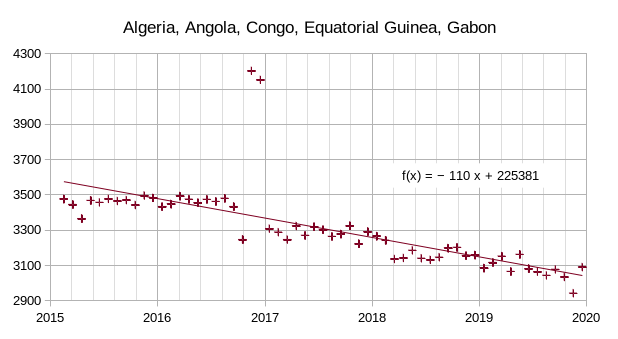
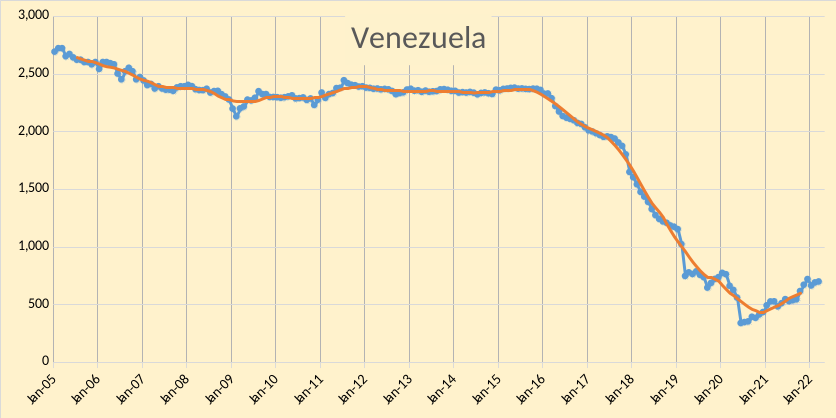
Consider figure 10 above where we leave out three politically troubled nations (Libya, Nigeria, and Venezuela) from the group of 8 nations in Figure 9. Venezuela has seen steady decline from Jan 2016 to Jan 2020 at an annual rate of over 400 kb/d, Libya and Nigeria have seen large fluctuations in output over the years. The group of 5 nations in figure 10 have seen relatively steady decline from Jan 2015 to Dec 2019 at an annual rate of 110 kb/d. Venezuela may have reached bottom and is likely to see flat output to very slow decline going forward, Nigeria and Libya are more difficult to predict due to instability.
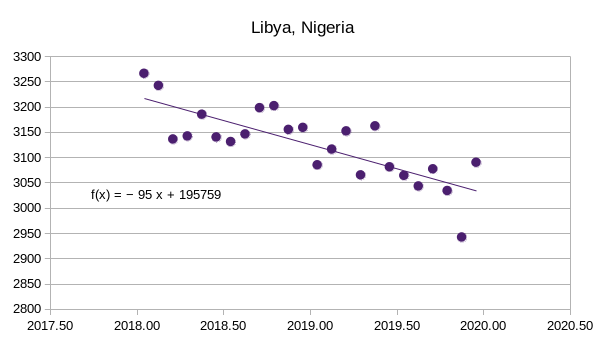
In 2018 and 2019 Libyan and Nigerian output was decreasing at an annual rate of 95 kb/d. If we add this the the 5 OPEC nations in figure 10 we get an annual decrease of about 205 kb/d during the 2018 to 2019 period for 7 nations (Venezuela has been excluded from the original eight nation group). Some of this decrease might have been due to quotas in 2019 (although Libya did not have a quota the other 6 nations did have a quota during most of 2019.)
A rough estimate for future annual decline rate from the 8 OPEC nations in figure 9 is about 250 +/-50 kb/d. It is not clear if the big 5 OPEC producers will be able to offset this decline in output in the future, my guess is that they have the resources to increase output at an annual rate of 250 kb/d or more, but time will answer this question.
163 responses to “OPEC Update, April 2022”
Troubles for OPEC in Africa
Nigeria:
Nigeria’s oil output was 1.23 million barrels per day (bpd) in March 2022 – 490,000 barrels below its production quota of 1.72 million barrels per day in March. The average price of Brent Oil in January was $117.25
https://nairametrics.com/2022/04/18/the-data-that-getting-everyone-worried-about-nigerias-crude-oil/
Libya:
https://www.aljazeera.com/news/2022/4/17/libya-oil-firm-announces-closure-of-major-oil-field
Thanks Stephen,
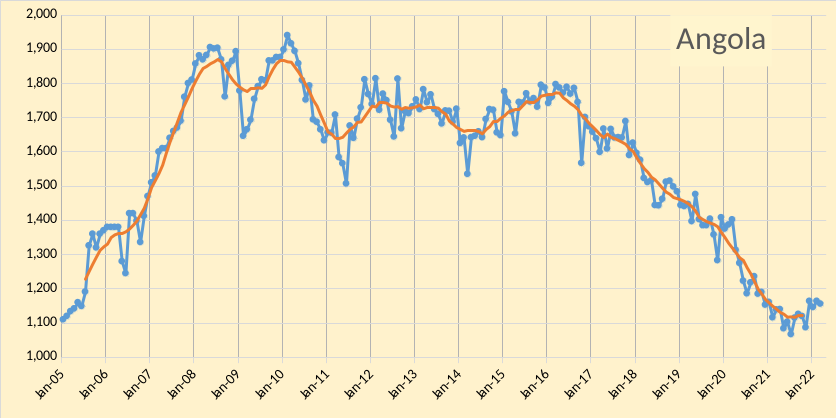
Yes Africa is a problem area for OPEC. Output in Angola is also much lower than their quota, see Ovi’s excellent comment below.
Thanks for the work Dennis. I very much admire the way you and Ovi stay on top of the numbers.
I agree.
Thanks to both for the consistent data.
Along with Enno’s blog and Mike’s blog, oil info I always read.
Thanks Schinzy, Shallow sand, and Ovi.
U.S. Natural Gas Prices Hit Highest Level In 14 Years
At 10:18 a.m. ET, the front-month futures price at the Henry Hub had jumped by 6.37% at $7.755 per million British thermal units (MMBtu). That’s more than double the price of the U.S. benchmark compared to the start of this year.
I assume this will lead to higher US electricity prices.
Frugal,
That is my expectation as well. It might also lead to more rapid development of wind, solar, hydro, geothermal, and nuclear power as these sources of electric power will be very profitable investments as electric power prices increase. As this occurs (it will take 5 to 10 years to see the impact) we may see demand for natural gas start to decrease an may see peak demand for natural gas.
Dennis
Nice update
I am surprised to see the monthly linear increase in production from a number of OPEC members, Algeria, Iraq, Kuwait, Saudi Arabia, UAE and even Venezuela. No Cheating. OPEC is about 450 kb/d short of its pre-pandemic output. Will it get there in the next three months? Interestingly only Saudi Arabia and Iran are currently above their pre-pandemic output levels.
Attached is a table that compares the OPEC 10 March targets with the actual March output. According to OPEC, their members were supposed to add 253 kb/d in March to produce 25,062 kb/d. The OPEC 10 only added 79 kb/d. In February OPEC 10 was short by 668 kb/d and in March that deficit increased to 822 kb/d.
Note that Saudi Arabia’s output from direct communications, 10,300 kb/d, is closer to their target than from secondary sources.
Ovi,
As I suggested in my post, without any sanctions relief for Iran, I expect OPEC might only have about 130 kb/d of spare capacity as of March 2022 assuming the eight smaller OPEC producers (excluding KSA, UAE, Kuwait, Iraq, and Iran) cannot increase output from their March 2022 output level (Libya, Venezuela, and Nigeria might see some small increase, but these might be offset by decline in the other 5 OPEC producers that are part of this group of 8 smaller OPEC producers who produce less than 1750 kb/d).
Over a longer period of 5 years or more in a high oil price environment we might see more resources developed in the big 5 OPEC producers, but it will take time and we won’t see much happen in the next 3 to 6 months that will increase OPEC capacity, these projects take years rather than months.
It is notable how many oil producing countries are well below their geologic and industrial output capability due to the ‘human’ factor.
For example- Libya, Venezuela, Nigeria, Iran, Iraq, and now add Russia to that list in a big way.
Impossible to model this human element.
Actually there are mathematical tools to model the human element. One needs to use past data to estimate the probability of human disruption and then a stochastic term in the model.
Last night I got interested in the Epic of Gilgamesh. People have had the same motivations for the last 4000 years! https://www.youtube.com/watch?v=Rd7MrGy_tEg
A million thanks. This is a superb talk by Andrew George, whose Penguin book I own. He speaks Babylonian at one point (or at least an approximation) and he’s funny! (I highly recommend Irving Finkel as well, who is just a hoot.)
Gilgamesh is the ur-legend of collapse, really, why even the greatest of kings must die.
Mike B , ” So shall it be written and so shall it be done ” – Yul Brynner in The Ten Commandants . Death lays it’s Icey hands on the kings . Tks .
there are mathematical tools to model the human element.
For example, psychohistory can predict the future of mankind hundreds of years in advance.
The problem with predicting the behavior of countries that are producing less oil than they could for political reasons is that there are only about a half dozen of them.
The law of small numbers is “the incorrect belief held by experts and laypeople alike that small samples ought to resemble the population from which they are drawn”. Stocastic methods may be useful for some purposes, but predicting the behavior of a few world leaders is not one of them.
Guys , I am picking up from Ron’s last comment on the earlier ” Non -Opec production drifts lower ” which was about DUC’s . Art Berman told us about the junk DUC’s first , this was then confirmed by SRIROCCO . Ovi , Stephen and several others the reconfirmed this . DUC’s were nothing but a narrative . All was in tier 2 and 3 area’s . All was junk . Art’s argument was very simple . Why spend millions on drilling and then not extract the oil ? The industry came back with excuses . We are waiting for higher oil prices . We don’t have the crew to do fracking . All was a delaying tactic to entice new OPM and then do the ” loot and scoot ” scam . Well the Senator Seneca said ” In his “De Ira” (about rage), Seneca wrote “Dandum semper est tempus: veritatem dies aperit.” (There is always time, and the days disclose the truth).
Anyone here wants to argue with the Senator ?
P.S : Acknowledgement . The Seneca quote comes from the blog of Ugo Bardi .
A better estimate of DUCs can be found at shaleprofile see well status tab at link below
https://shaleprofile.com/blog/us/us-update-through-december-2021/
or
https://public.tableau.com/shared/B8C7YZYYQ?:toolbar=n&:display_count=n&:origin=viz_share_link&:embed=y
The fact is we don’t know how many DUCs are viable to be completed. Shale profile data says there were 6500 DUCs as of Dec 2021, EIA has a lower estimate at 4714 in Dec 2021. My guess is that the shaleprofile estimate is better in this case.
Permian DUCs on Dec 2021 were 2092 according to shaleprofile and 1541 according to DPR DUC estimate. The peak Permian DUC count was 3708 in June 2020 by shaleprofile’s estimate and 3610 in July 2020 according to the DPR DUC spreadsheet. The drilling and completion estimates seem to be very different from July 2020 to Dec 2021, often the recent 6 to 12 months of data from state agencies is not up to date so it is all very fuzzy.
Claims that half the DUCs are dead DUC that will never be completed would suggest that of the the 10,000 DUCs in June 2019 (shaleprofile data) about 5000 were dead, leaving 5000 that were viable, by DEc 2021 the number has decreased to 6500 and if 5000 of hose are dead, that leaves 1500 live DUCs. Shale profile also estimates about 643 wells were completed in Dec 2021 and 304 wells were drilled which would give us a 340 decrease in DUC count per month, if those rates continue in the future we would know in 4 to 5 months if the “half the DUCs are dead” claim is true or false.
Time does answer many questions.
Dennis , Enno does fantastic work . no arguments , but he is not God ( remember Andy Hall the God ) . Give me a choice Enno vs Mike S , SS , LTO survivor when my life is at stake . 24/7 any of the latter three . You said “The fact is we don’t know how many DUCs are viable to be completed.’” Heck that was what Ron’s post was about . Go back to square one .
HIH
Below is a chart that shows the monthly completion rate of DUCs according to the EIA. It shows the completion rate is slowing. In the meantime more rigs are being added and wells being drilled. Since October, the completion rate in the Four basins has been cut by almost 50%, 201 to 107.
Doesn’t the fact that Permian rigs are increasing and frac spreads are stable/drifting lower pretty much mean the remaining DUCs are dead ones? The excess has been burned off
Stephen,
No not really. There is some optimal level of DUC inventory that is needed so that the logistics work out. They have reached a level where the number of wells being completed is satisfactory for the producers so no more frack spreads are needed. Rigs are increasing so that the number of wells drilled rise to the number of wells completed each month so that the DUC inventory can stabilize. We do not know the vintage of the existing DUC inventory, there may be very few old “dead” DUCs that are not viable, we do not know. If we saw the completion rate drop suddenly while there were still thousands of DUCs in inventory, this would tell us that the rest of the DUCs are not viable, we have not seen this as of today.
Hole in head,
I read that post differently, the implication was that a large proportion of existing DUCs are unlikely to be viable. I think that requires a lot more proof than I have seen so far. If the claims are true we will know fairly soon, I think it wil be more like the people that claim a major economic downturn is right around the corner. If they keep claiming this for a long period of time they are eventually proven correct. But if you look at the % of correct predictions, it is clear the projection is rather useless.
HIH.
I will vouch for Enno Peters’ work any day over my mostly “views and opinions”, when it comes to shale. Enno’s data is top notch. When he makes predictions; he heavily qualifies them. He knows his limits, unlike most of the media darling prognosticators.
The debate isn’t about whether shale can grow. It’s whether it can return to the 1 million + BOPD annual growth year after year, and get anywhere close to the EIA’s high price scenario.
Mike and LTO know way more than me about shale too. They study it more, and LTO has lead a company that operated in the Delaware Basin.
I mostly read what they post and compare it to some others. My simple view is that US shale oil production growth is mostly dependent on the Permian Basin. As Mike notes, over 90% of that comes from parts of 12 counties. Several of those counties are around 30 miles by 30 miles. There are multiple benches, some way better than others.
The Bakken and EFS appear to be post peak. They might grow some from present, but likely not past previous peaks. Colorado Niobrara isn’t big enough to move the needle, and Colorado isn’t encouraging oil and gas development like it did in decades past. Wyoming is smaller yet. Oklahoma is more gassy, and very high gravity, much more condensate and NGL’s than oil.
GOM appear to be near its peak. Alaska is long past peak. Lower 48 conventional keeps making new lows, 2015-2020 and shale did it in. Seems stuff is so expensive in the Permian that it’s tough to make a lot of the old conventional stuff work there, even with high oil prices. Maybe will work if you do your own pumping and well pulling.
That’s my view in a nutshell, based on reading what people more knowledgeable than me post.
SS , Enno’s work is not in doubt . I have always respected and praised his output . The article has been written by two absolute insiders in the industry EIA and Rystad . This is a defacto confession that majority of the DUC’s now available are unviable .
” The debate isn’t about whether shale can grow. It’s whether it can return to the 1 million + BOPD annual growth year after year, and get anywhere close to the EIA’s high price scenario. ”
Thanks for giving direction to the debate . Good exchange of ideas on this issue underway . Tks .
Hole in head,
Found Rystad article at link below
https://www.rystadenergy.com/newsevents/news/press-releases/live-duc-well-inventory-fell-to-lowest-since-2013-as-the-us-continues-to-frack-more-than-it-drills/
If we focus on Permian basin, the article says 1550 “live” DUCs in Permian at end of June 2021. If we use EIA DUC spreadsheet to estimate how many of the live DUCs were completed from June 2021 to March 2022 we find the live DUC count would be 694 for the Permian Basin at the end of March 2022, in March the DUC count decreased by 71 and at that rate all the live DUCs would be completed in 10 months.
Note however that if frack spreads remain relatively flat and the horizontal rig count continues to increase, the rate of change in the DUC count will gradually decrease each month, lately the change in the stock of DUCs has been decreasing in absolute value by about 5 per month. If that trend continues the “live” DUC count starts increasing in 16 months, the low point in live DUCs would be 225 before the DUC count starts increasing. The actual DUC count at the low point would be 840 DUCs (615 of these would be “dead” DUCs) based on the assumptions I have made here.
I think Enno, Ovi, Mike Shellman, Dennis all have done terrific work. My concern is oilfield services including tubular goods. I am really surprised more skilled oilfield workers have not returned to the upstream industry in this “high” price environment. I just participated in a well in the Permian as a non-op partner and the frac literally halted for one week due to lack of proppant sand. First time I have ever seen that. I am also very close with an oilfield service company that provides surface equipment and they are observing more pipe failures (casing and tubing) than ever before. Either the mills are not testing or they are cutting corners on alloys just to supply the necessary tubulars.
I do not believe we will see appreciable production growth with the current rig count, pressure depletion and depleting inventory. Most companies I know are using the higher prices (if not hedged at $50 for 2022) to pay down debt as quickly as possible while attempting to keep production relatively flat. Some of the privates are going great guns in order to sell or go public. (most likely will sell to larger publics looking for revenue).
Look for Mineral Companies to have a banner year in 2022 and 2023 as most of these companies have little debt and for the most part unhedged plus they are paying dividends at around 8.0% plus. They should be the darlings of this higher price environment.
LTO Survivor,
Thanks. So far for the past 12 months the Permian basin has increased output at an annual rate of 600 kb/d, you “do not believe we will see appreciable production growth with the current rig count, pressure depletion and depleting inventory”, can you give us a rough guess of what you mean for the Permian basin? Maybe 300 kb/d annual growth in the next 12 months for the Permian basin? So far there is little indication that the horizontal oil rig count is slowing down, it has been increasing at an average weekly rate of about 2.3 rigs per week over the past 24 weeks (Baker Hughes data).
It will be interesting to see what happens with these high oil prices.
US LTO output in chart below.
Data from spreadsheet linked below
https://www.eia.gov/energyexplained/oil-and-petroleum-products/data/US-tight-oil-production.xlsx
Dennis, why does my chart look so different from yours. That was a rhetorical question. I do not expect an answer. But I must say I think my chart is far more informative than yours.
Oh well, such is life.
Ron,
Yes tight oil output is below the peak in 2019, the point is that despite claims that it is done, bothe charts show that it has been incresing for the past 12 months at about an annual rate of 664 kb/d.
Dennis,
I don’t really know how much growth we will see. Possibly 300k depending on the DUCs plus I really believe we will see growth over the next 3 years but each successive year will be a little less than the previous year. My predictions are based on oil and gas prices remaining at these higher levels during that time period. if prices drop appreciably then all bets are off. With the current costs in the oil field, a minimum price pf $70 per barrel can maintain production with slower growth.
LTO Survivor,
Thanks for your insight.
LTO Survivor,
Consider Enno Peter’s projection for Permian Basin at link below
https://shaleprofile.com/us-tight-oil-gas-projection/
He assumes the completion rate is constant at 432 wells per month from June 2022 to Dec 2029, from April 2022 to April 2024 output increases from 4589 kb/d to 5597 kb/d or roughly 1000 kb/d over that two year period. His completion rate scenario seems reasonable (in February the completion rate was 428 new wells in the Permian) the completion rate increases very marginally in this scenario. I think with high oil prices this scenario will likely underestimate future Permian growth because the completion rate is likely to rise over the next 24 months to perhaps 500 completions per month.
Chart below shows the shale profile supply projection for the Permian basin only through May 2024.
Click on chart for larger view.
Question For The Blog On Estimated U.S. NGLs Annual Decline Rate
We know that the U.S. Shale gas annual decline rate is less than shale oil, but would shale NGLs have a similar decline rate as shale oil?
steve
Steve
Since NGPLs come from NG wells, I would assume the decline rate would be the same for both. Possibly a more critical issue is whether the gas being extracted is wet or dry. Many operators look for wet gas wells because the liquids get a better price. However now that the price for NG has risen, that distinction may not be as critical.
Ovi,
Thanks for your reply. However, we do know a significant percentage of NGLs also come from Shale Oil wells, especially in the Permian… correct?
steve
Steve,
Yes about 29% of unconventional natural gas produced in the past 12 months came from the Permian, Eagle Ford, Bakken, and Niobrara basins.
Chart below uses shale profile data for the average 2019 Permian well for both oil and natural gas, then it is assumed that the NGL per MCF is the same as the average rate for Texas and New Mexico and remains constant over the life of the well (this part may not be correct, I do not have detailed data on NGL per cubic foot of gas over the life of an average well. The ratio is output relative to peak output at month 2 (which I call month 1 on the chart).
Dennis & Ovi,
Dennis, thanks for the extra info. I am trying to get an overall U.S. annual decline rate for the 16.6 mbd of Crude, Condensate & NGLS in 2021. I know when U.S. shale oil production peaked in 2019, it was declining at 48.6% IN ALL FIELDS while shale gas declined 31.3% in ALL FIELDS.
If we consider the current 7.2 mbd of tight oil in 2021 was 65% of the total 11.2 mbd, we had the Gulf of Mexico, Alaska, and Conventional for about 4 mbd. If we add in the 5.4 mbd of NGLs to the mix, I am assuming an overall U.S. Annual Decline Rate of 30-40%, maybe closer to 35%.
Do you all see about the same or different?
steve
Dennis & Ovi,
Here is my math on the 2021 U.S. Production Decline Rate
7.2 Tight Oil mbd X 48.6% = 3.50 mbd
5.4 NGLS mbd X 31.3% = 1.69 mbd
4.0 GOM, Alaska & Conv X 10% = .40 mbd
U.S. Total Annual Decline rate = 5.6 mbd
Now, if we add that to the estimated 6% annual decline rate of the Rest Of the World at 76.6 mbd in 2021, that would be a decline rate of 4.6 mbd.
Total U.S. and Rest Of World Annual Decline Rate for 2021 (conservative) = 10.2 mbd
steve
Steve,
Conventional and Alaska decline at roughly 6% per year, the GOM is probably higher 10% may be about right. These decline rates would be under the assumption that no new wells were drilled for tight oil or natural gas and that no new fields were developed anywhere in the US. According to shaleprofile, US tight oil decline in 2021 would have been 46.2% (Dec 2020 to Dec 2021), if no new wells were completed after Dec 2020.
The oil business is all about replacing reserves that have been produced, that is a big part of the process. In actuality tight oil production increased by about 440 kb/d, so the 3264 kb/d of declining output from wells completed by Dec 2020 was replaced and an additional 440 kb/d was also brought online as well.
Throughout the world the declining output of older wells is replaced with new wells and/or upgrades on existing wells.
Good work Stephen, I had been wondering the US average annual decline rate myself and I put it at 4-5 MBD. Which means that the US of A has to find and develop about 5 MBD of additional oil just to stand still as far as total petroleum liquids production EACH YEAR! And the quality of the oil keeps declining as far as fitting the definition of light sweet crude of API 30 or above. Eventually this decline rate will start to increase like a treadmill and the API quality will continue to decline too. The USA & the world is definitely in the gravity of Peak Oil.
Steve with those sort of decline rates we are sure to be looking for continued destabilization and wars around the world . I am still looking at ELM , falling quality grades and diesel output as ticking bombs in the near future ( 1 to 2 years) . Diesel shortages are now occurring in two continents South America and Africa . Next will be Europe if the EU cuts off 4 mbpd of Russian oil as expected and being discussed immediately after the French elections this weekend .
Dennis,
Thanks for your input. I realize these Decline rates are based on “NO NEW WELLS.” But, that is the natural decline rate going by the industry standard.
So, while the analysts have thrown out the 5-6% Global Figure, the real figure is closer to 9-10+%., especially when we consider that 12.6 mbd come from U.S. shale oil & Ngls production.
steve
Steve,
Yes the 9% rate may be about right, but only while tight oil output is high through 2029 or so, once tight oil wells are no longer being completed after 2035 or so the matural decline rate will fall back to 6% or so after 2040 or so as tight oil will by that time be a small part of the total oil output mix (1.5 Mb/d of tight oil out of 71 Mb/d for World C plus C output in 2040). The actual decline rate for World C plus C output (assuming new resources continue to be developed) will be about 1.8% in 2040 with the peak in 2028 at 84.5 Mb/d (2018 World C plus C output was 83 Mb/d). The URR for my World scenario is about 3000 Gb for C plus C output. The scenario assumes demand falls faster than supply from 2035 to 2078 as land transport demand for oil falls as land transport moves to electricity from oil. The decline rate in crude oil will be roughly 2% to 3% mostly due to a fall in demand for crude from 2035 to 2075, other demand for crude besides land transport has not been modelled, a simple assumption of flat demand for uses other than land transport has been made, difficult to predict how future demand will play out.
Steve
My impression was that in the Permian and Bakken, the natural gas from oil wells was flared. I also thought that laws are being proposed to capture the NG. It was never my understanding that NGLs came from oil wells. Not sure if that NG would also contain some ethane.
Ovi,
Thanks for the info. What do you think of the Decline Rate figures above? Any insight?
steve
Ovi,
Oil wells produce both oil and associated gas. Sometimes the gas is flared, but often it is not. Look at unconventional natural gas production at spreadsheet linked below.
https://www.eia.gov/naturalgas/weekly/img/shale_gas_202202.xlsx
also see
https://www.eia.gov/naturalgas/weekly/img/202202_monthly_dry_shale.png
I think Lynn Helms reports percentage of gas flared each month in the North Dakota Director’s cut.
Shallow sand,
Yes that is correct.
https://www.dmr.nd.gov/oilgas/directorscut/directorscut-2022-04-19.pdf
Latest report at link above says in Feb 2022 that 94% of natural gas was captured, I assume that means 6% of natural gas was vented or flared. In the Bakken statewide 95% of natural gas is captured with 5.4% of natural gas flared in the Bakken, the high point for flared natural gas was 36% in September 2011, the goal for natural gas capture has been 91% since Nov 1, 2020. Seems the goal may not be very aggressive.
There seems to be a small number of wells that may not habe pipeline access and result in high flaring from those wells (about 659 wells on Fort Berthold fee land) where gas capture is only 81%. These wells may be the reason the goal was set at 91%.
Dennis
My reply to Steve was answering his comment “However, we do know a significant percentage of NGLs also come from Shale Oil wells, especially in the Permian… correct?”
The point I was making was that the oil wells release primarily CH4. At some point in the process, the oil must pass through an oil/water/gas separator. If it operates at atmospheric pressure, or slightly above, the NG and Ethane would bubble out. My impression has always been that the majority of the gas in oil is NG and only trace amounts of ethane and no NGPLs.
Maybe some experts on this board could correct my understanding if it is wrong.
Ovi, I am not an oilman but I do know something about the subject. Of course, it all depends on the well, but in general, everything comes up with the oil. That is methane, ethane, propane, butane, and pentane. And of course, every carbon polymer above that, to varying degrees depending on the well.
Whether the gas is flared or not depends on whether or not they can economically capture it. They can always put the oil in tanks and truck it out later, or lay a short pipeline to a nearby storage facility. But it is harder to store gas because it must be comprssed. So quite often it is just cheaper to flare it.
Hi Ovi,
I had a different impression than you, but I may be wrong. I thought the associated gas had methane, ethane, propane, and butane in it and the NGL was stripped out of the natural gas stream at a natural gas processing plant , just like all other natural gas that is captured rather than flared.
I will let the oil men correct me if I am wrong.
Dennis/Ron/Steve
It looks like there are many different possibilities. A lot of detail in the link.
The actual process used to separate oil from natural gas, as well as the equipment that is used, can vary widely. Although dry pipeline quality natural gas is virtually identical across different geographic areas, raw natural gas from different regions may have different compositions and separation requirements. In many instances, natural gas is dissolved in oil underground primarily due to the pressure that the formation is under. When this natural gas and oil is produced, it is possible that it will separate on its own, simply due to decreased pressure; much like opening a can of soda pop allows the release of dissolved carbon dioxide. In these cases, separation of oil and gas is relatively easy, and the two hydrocarbons are sent separate ways for further processing. The most basic type of separator is known as a conventional separator. It consists of a simple closed tank, where the force of gravity serves to separate the heavier liquids like oil, and the lighter gases, like natural gas.
In certain instances, however, specialized equipment is necessary to separate oil and natural gas. An example of this type of equipment is the Low-Temperature Separator (LTX). This is most often used for wells producing high pressure gas along with light crude oil or condensate. These separators use pressure differentials to cool the wet natural gas and separate the oil and condensate. Wet gas enters the separator, being cooled slightly by a heat exchanger. The gas then travels through a high pressure liquid ‘knockout’, which serves to remove any liquids into a low-temperature separator. The gas then flows into this low-temperature separator through a choke mechanism, which expands the gas as it enters the separator. This rapid expansion of the gas allows for the lowering of the temperature in the separator. After liquid removal, the dry gas then travels back through the heat exchanger and is warmed by the incoming wet gas. By varying the pressure of the gas in various sections of the separator, it is possible to vary the temperature, which causes the oil and some water to be condensed out of the wet gas stream. This basic pressure-temperature relationship can work in reverse as well, to extract gas from a liquid oil stream.
http://naturalgas.org/naturalgas/processing-ng/
Steve,
The NGL comes from the natural gas and the GOR tends to increase over time for tight oil wells, so the NGL would tend to decrease less quickly than the tight oil, a significant amount of the natural gas comes from gas focused wells in Appalachian and other basins such as the Haynesville, in those basins the NGL would fall at a similar rate as the natural gas if the NGL per cubic foot of gas remains constant over the life of the well (the gas may become more wet or more dry over time, I do not know). Ask at oilystuff.com as Mr Shellman most likely would know, or Shallow Sand, George Kaplan, Bob Meltz, or LTO Survivor might also have a more informed answer.
Once the pressure falls below a certain point, the condensate becomes oversaturated in the gas and falls out of solution. Thus the condensate to gas ratio may fall. In some gas fields it is worthwhile to strip condensate and LPGs from the gas stream and re-inject the gas on the field periphery to keep the pressure above the condensation point.
Dennis,
Not only is the gas oil ratio increasing as we quickly approach bubble point, but we do also tend to see the gas get a tad richer as more liquids drop out downhole.
Thanks LTO Survivor.
Just to make sure I am understanding properly, when you say the gas gets “richer” does this mean wetter as in more NGL per MCF?
Yes
Steve,
If you go to the West Virginia DEP site, you can see monthly production data from all ~3,000 horizontal published on a quarterly basis with running monthly totals displayed for Total Gas, Oil, Brine, and – unique to my knowledge – NGLs.
Third quarter 2021 posting may offer you relevant (to your question) data.
Only about half the wells show appreciable wet output, primarily from the northernmost counties.
Fourth quarter results should be released shortly.
Newb here—
Steve, do you have a source for the statement that shale oil peaked in 2019? Also, if this is true, has there been any discussion as to whether the shale peak was responsible for the strange signal in the repo market in late 2019?
Also, can someone help me with oil on water? Google keeps coming up with a novel (looks interesting) but not what the term means in and of itself.
Cheers.
Bill,
The verdict is still out if Shale peaked in Nov 2019. The only real growth will come from the Permian. However, I was using 2019 Shale Production because it wasn’t materially impacted by the COVID-19 shutdowns.
As for Water & Oil, I don’t know what you are referring to.
steve
Thank you. Its’ a phrase repeated a few times in the original blog post.
Bill,
Oil on water is oil that is on oil tankers being transported from where it is produced to where it is consumed. See page 73 of the Monthly Oil Market Report published by OPEC in April at link below
https://momr.opec.org/pdf-download/
There were about 1202 million barrels being transported on tankers at the end of 2021, this is the oil on water, the rest of the World’s oil stocks are stored on land in surface tanks and sometimes underground.
Sorry I was not very clear on the meaning of oil on water.
On the peak in tight oil, there was a peak in 2019 at 8371 kb/d in November 2019, the centered 12 month peak was 8040 kb/d in November 2019 and the centered 12 month average output of tight oil at the World peak in Nov 2018 was 6991 kb/d, the most recent monthly tight oil output was 7762 kb/d and most recent centered 12 month average output was 7457 kb/d in September 2021. If the annual rate of increase of the past 12 months in tight oil output of 664 kb/d continues for the next 12 months, then US output of tight oil would be 8426 kb/d and we would see a new peak in tight oil output.
I expect that tight oil will peak in 2029 at about 11.5 Mbpd.
The scenario below uses a relatively conservative scenario for the Permian basin with a URR of 44 Gb ( the USGS estimates there is a 5% probability that the Permian tight oil resource is 44 Gb or less). Total US URR for tight oil for this scenario is 74 Gb from all US tight oil plays and from Jan 2000 to February 2022 the EIA estimates that 22 Gb of tight oil has been produced, so remaining resources (if the scenario is correct, roughly a 0% probability) would be 52 Gb.
On a World scale this is a tiny portion of remaining oil resources which I expect will be at least 1500 Gb, so tight oil would be about 3.5% of remaining World oil resources.
“On a World scale this is a tiny portion of remaining oil resources which I expect will be at least 1500 Gb”
I wonder what the country distribution of remaining oil URR is?
Anyone have an estimate breakdown on this?
Hickory,
No I do not have an estimate of that.
See Jean Laherrere’s paper from August, 2018 , for his estimate of remaining resources at that time.
https://aspofrance.org/2018/08/31/extrapolation-of-oil-past-production-to-forecast-future-production-in-barrels/
There is a table on page 118 of the paper which has the information for the 35 largest oil producers. His estimate was 1350 Gb of remaining resources at the end of 2017.
Thanks, I appreciate it.
Dennis , ” I expect that tight oil will peak in 2029 at about 11.5 Mbpd. ”
2019 is the peak for USA . Take it to the bank .
That might be the case. But in any case, the US peak is just not that important. The world peak is the very most important thing. World oil’s monthly peak was in November 2018 with the 12-month average peaking 5 months later. Neither of those peaks will ever be surpassed. And that you can take to the bank.
However, the USA has the capacity to increase production more than any other nation. And that is a pitiful situation because the US production will not increase by very much.
Ron and Hole in head,
My expectation is that the centered twelve month average output of World C plus C in Oct/Nov 2018 (82987 kb/d) will be surpassed by December 2025. We will see at that time if you are correct.
Output decreased in 2019 because OPEC cut production by 2000 kb/d and obviously the pandemic reduced demand in 2020 and beyond.
I agree World output is the most important consideration.
Shock model below (with LTO and extra heavy oil (XH) on right axis).
Dennis, I could not help but mention that your chart of world C+C production had the qualifier as U=3000 GB. Dennis, you need to understand that what some people think is still left in the ground is just not what is important. Above-ground production trends are far more important than underground dreaming.
I’ve been going back-and-forth with a UK geologist named “Dave”, who believes only >10% of oil resources have been identified.
https://andthentheresphysics.wordpress.com/2022/04/09/scenarios/#comment-206307
I don’t know if he believes that number but I sense that he asserts this to instill the fear that if we did extract that oil, we will cook the planet.
10% of sludge and tar is 10% of sludge and tar.
Tweet from Art Berman .
Ron,
A combination of past production trends, past discoveries, and the rate of resource development and extraction historically, give a better way to estimate future oil production.
In 2018 Jean Laherrere estimated a range of 2600 to 3000 Gb for World crude URR, his methodology mostly considers past production to estimate future output. Note that in 1998 he estimated a World URR for conventional oil of 1800 Gb. Over time he has gradually increased his estimate, primarily because the Hubbert lineariztion method does not work very well because the “line” that is assumed is really a convex up curve that will usually underestimate the URR.
The thing about past trends is that they often change in the future.
If we see a near term collapse in the World economy, then the URR=3000 Gb may be too high, but if there is no near term collapse, the URR= 3000 Gb may well be too low.
Note also that cumulative production for the Scenario is 2235 Gb from 1850-2050 and 2800 Gb from 1850 to 2100. About 200 Gb is produced in the scenario from 2100 to 2300.
Hole in head,
That chart by Berman looks suspicious. Does he have an explanation for why he assumes all vintages suddenly see higher decline rates starting in 2021?
The colors are pretty, but it is very doubtful that all US C plus C production is declining at 39%. Tight oil output declined by 40% in 2021 (if no new wells had been drilled in 2021). It is doubtful that the rest of US output declined at anything close to this rate.
Here is a chart from shale profile for tight oil wells through December 2020.
https://public.tableau.com/shared/B5YCRTJP2?:toolbar=n&:display_count=n&:origin=viz_share_link&:embed=y
Dennis , contact Art if you disagree . Above my pay scale . His contact info is available on the net or on his blog . I am sure Art knows POB and Mr Coyne .
Dennis , Your ” If we see a near term collapse in the World economy,”
Yes , I do . As of this day we are 4mbpd short of the peak (all liquids ) of 2018 . If you will sanction Russia that means about 5 mbpd of REAL OIL out of the market . Real oil is the black goo that has the middle distillates . Several years ago I read an expert ( could be Nate , could be Kurt Cobb could be Rockman , Matt Simmons etc but someone who knew about peak oil and was not a muppet . His call was that when the black goo ( crude only ) reaches 60-70 mbpd the system will fold . I have mentioned earlier we are headed for what David Korowitz calls a Synchronized System Failure . China falls because of lockdowns , EU falls because of war and USA falls because of fraud in the financial system . A perfect storm .
Hi Dennis. Not sure if you can see Mr. Berman’s Twitter. I find the information he shares to be very interesting.
Here’s the thread from which that image is taken.
https://twitter.com/aeberman12/status/1516549141220007941?s=21&t=3a_COLovZkgiH1zOBameXw
The graph HiH posted appears to say we will have zero production from existing wells in 2023.
Here is the same graph, and a second one with the data plotted differently.
https://twitter.com/acranberg/status/1516797271987339265?s=21&t=2rQyd5eRwE7eZV_Z8vKAbg
It is perhaps the second image that makes more sense visually.
‘prediction that when oil “reaches 60-70 mbpd the system will fold”‘
That old prediction is certainly not something to hang your hat on.
It depends on the rate of decline.
If the lower level is ‘achieved’ quickly, as in this decade, it will be extremely tough for the world economy to digest.
But if the the decline is gradual and takes two decades its a different story, since now electric vehicle production is nearing rapid adoption, and other forms of energy are beginning to be deployed at scale.
Diesel and petrochemical uses would still be supplied for priority use.
Sure, some economic sectors and some countries would be in huge trouble, but others would be adapting to the change. Not as if there is any choice in the matter.
Take note that a two decade decline of 40 Mbpd is 2%/yr. If the decline is gradual, it can and will be digested.
Hicks , “Diesel and petrochemical uses would still be supplied for priority use.”
Who will decide that .? A faceless bureaucrats in Washington and Brussels who have a guaranteed salary and pension ? Who know ‘s nothing about the predicament called ” peak oil ” ? Who gets it first the armed forces or the farmer ? No food the armed forces die , no armed forces the borders are threatened . The police or the fire department or the ambulance ? What if there is nothing left after allocating all available to the armed forces and the farmers ? Do we make Ad blue or do we make fertilizer ? We are up the creek without a paddle . The Seneca cliff and POD are at our front door .
Hole in head,
Probably why you believe oil will be $25/b (in 2020 $) in 2025. I think your prediction is 15 years too early, we might get there in 2040 due to falling demand for oil. We will see in 2025 if you are right.
““Diesel and petrochemical uses would still be supplied for priority use.”
Who will decide that .?”
The market and/or dictators allocate scarce resources, just like always.
Often poorly. But it does generally get done.
What you have been alluding to is the near future having no functional market and no effective leadership, rather having a global chaotic situation.
Perhaps that will happen. It is a only a meaningful prediction when you give dates.
Otherwise its just throwing mud at the wall.
Survivalist,
Not clear why Berman seems to think US natural decline is 39%, in December 2021 tight oil was 66% of total US output and tight oil natural decline in 2021 was about 40%, the other 1/3 of US output is declining at no more than 9%, that would give a decline rate for all of the US of about 29.5%. Note that even the 9% estimate is probably too high for the 34% of US crude output that is conventional oil. So my 29% guess is if anything too high.
Hicks and Dennis . A very good case study about the outlook of UK from Tim Watkins . He takes energy in the equation . You can substitute any country ‘s name in the West and arrive at the same result . The world has entered into ” energy poverty ” this will be followed by ” energy starvation ” This time it really is different .
https://consciousnessofsheep.co.uk/2022/04/20/this-time-really-is-different/
HHH , what is happening with the Yen and the mortgage rates hitting 5.35 % ? If the FED is going to go by it’s 0.25% increments it will catch up by 2030 or so .
Yen is just doing what it normally does. Widening spread between yields in US and Japan as US 10 year is at 2.9% ish. Yen is way over sold though.
I’m looking for a top in bond yields and USD/JPY. To get a sense of where inflation turns into real economy rejecting higher prices an a resulting economic slowdown. And prices and yields start falling.
Housing prices are going to get rejected at current mortgage rates. Which will ultimately lead to lower interest rates.
News is Europe will do a full ban on Russia oil as early as next week. So we will have to see how prices react to such news.
At the moment oil is tanking and real economy stocks are rising here in Europe. Nothing is more bullish to industry than some solid supply disruptions??
Perhaps they think oil is delivered from SPR in future and everything sunny and shiny.
Or traders can’t imagine in their home offices what’s really up?
HHH , disagree . The BOJ had to make a choice . Raise interest rates or crash the Yen . It chose the latter . Watch for further action here .
Housing mortgages and inflation : – The inflation is now due to supply side dislocation . The US has a $ 650 billion trade deficit per year against the world . Most of it is China . Well , China is in lockdown and nothing is being shipped to the USA . Inflation is now due to a combination of the after effects of all the stimulus payments + supply chain dislocation . In both cases the horses have left the stable . The FED is blocked . If the FED does not raise interest rates then inflation will run wild , not only that but shortages , as LTO survivor has pointed out will arise all over . This will become a rinse and repeat . The FED can print money but it can’t print stuff .
As to housing mortgages , the FOMO + easy money + Zirp distorted the pricing mechanism . It was/is a bubble and now the air is hissing out . Reality is dawning and the FED is helpless .
As to oil prices we are in agreement , next week’s decision is going to be critical .
FED can raise the short term rates. Doesn’t mean the long end will continue higher.
Margin debt is crashing. Might not be able to print oil. But if you don’t print money you can’t keep prices high forever.
Everything is pointing to a major slowdown ahead. Yields will fall on falling growth expectations. And Yen will strengthen because yields are falling and oil prices will fall.
We still in the window of time that oil has where it can go much higher due to Russian oil being shut in like I’ve been talking about for about a month.
But if we get an oil spike to $185 or $200 or even $230 it’s only going to accelerate the recession/depression that is coming and coming soon.
There’s still enough FED money out to create a huge inflation.
At the moment all the FED money is sitting in the banks as surplus reserves, as you have stated often. When demand is there to buy expensive stuff, they can lend it out and create inflation.
To avoid this they have to do QT now – dumping all their bought long extension bonds into the market.
This will stop inflation by skyrocketing long rates and prevent lending out money. And crash everything. But inflation is dead then.
HHH , Eulen . In 2018 the FED went into reverse gear at 3% . In 2022 can it afford even 3% ? I have my doubts with all the debt piled up . My trajectory is — inflation then shortages then deflation . What do you think ?
HiH, debt has ballooned much since then.
Companies are buying back shares on credit, states solve corona problems with credit, house builders financed ever rising environmental regulations with credit.
At 3% + lots of these will go broke or can’t finance – and there may be no more Lehmann, so we get lot’s of more printing to avoid this.
The end will be a kind of socialistic economy (or war economy)- since the FED can’t print oil or lithium, scare ressources will be available over ration cards, waiting or corruption. Money itself will buy you less and less.
https://de.wikipedia.org/wiki/Lebensmittelmarke#/media/Datei:Lebensm1.JPG
It has already started – building materials here are distributed by waiting (and it’s explensive).
Germany just said ” Sorry ” . We will not sanction Russian oil . As goes Germany , so goes the EU . So ” Ferris Buhler’s day off ” will not be screened . 🙂
https://www.bbc.com/news/business-61164894
Central banks create bank reserves out of thin air. Central banks and bank reserves aren’t central to the global monetary system.
Eurodollars created by private banks are global money. There is huge demand for safe an liquid assets or government bonds from private banks regardless of what the yield is. Yield doesn’t matter to them.
Private banks use them as collateral. Money from the private sector will fill the void of central bank reserves in the bond market.
Think about that for a second. Means a whole lot less dollars in the system to bid up stuff like say the price of oil.
Is the tech sector imploding ? N from the FANG is down by 68 % and so are many others
of the so called ” new economy ” based on paper and not on energy .
https://wolfstreet.com/2022/04/20/i-now-have-to-add-netflix-to-my-imploded-stocks/
I think stock market gets smoked here. Where is the price of oil when the Dow is down 10,000-15,000 points from where it’s at currently.
My guess is oil will be much lower.
FED is talking about multiple 0.5% rate hikes. There will be blood in the damn streets. There is no soft landing here.
They can’t get inflation under control without crashing markets. So they are going to crash markets.
Surprising the junk bond market is still holding on ? Any reasons ?
@HHH
Oil much lower, together with DOW 10.000 lower and bonds > 3% means total collapse of US shale in short time, together with the stop of most deep sea oil projects.
Oil will be cheap, but you won’t get any oil then. Can’t see this until there is total war economy with access cards and fuel lanes.
Paper trade of oil is already reduced because margins have soared – less trading on the same margin account possible.
I think more of the stagflation scenario – a weak economy, a recession and sky high prices because of single raw material failures and continued supply chain chaos.
Many economies will adopt – transportation will switch, energy projects greenlighted that have been impossible due to Nimbys and enviromentalists (Geoenergy and gas in Germany from my position – my house is sitting on a hot steam bubble in just 2000 meters depth that is 200 miles wide and contains loads of solved lithium).
For example driving to work in the USA – you would just a ride sharing app and could save 60% or more of “driving to work gas”, even without building a single more efficient car. It’s just not expensive enough still.
I looked – it started moving after years of fear mongering:
https://www.thinkgeoenergy.com/new-geothermal-heat-supply-contract-signed-for-city-of-mannheim-germany/
The oil from Russia continues to flow . Thanks to Glencore , Trafigura and others . Good news . Collapse postponed . Today we live .Thanks for kicking the can can down the road , but eventually we will run out of road . The party was great but now the hangover .
So now the BOJ is screwed , The end of the Yen carry trade . Another Black Swan ??
https://www.zerohedge.com/markets/no-plaza-accord-2-yen-craters-japan-begs-us-coordinated-currency-intervention-rejected
Yen is tracking interest rates. This is the yen carry trade in action. The “carry” is growing as interest rates rise in US to 2.9% on 10 year while Japanese 10 year sits at 0.25
We are seeing an expansion of carry trade. That is why yen is falling. When nominal yields go negative in US in the next recession Yen carry will unwind. An Yen will strengthen massively.
HHH , win on interest rate differential but loose on devaluation ?? What was ” We loose on profits per piece but we make up by selling in volume ” . The BOJ is now in a Hotel California situation ” you can check in but you can’t leave ” —The Eagles bestselling album .
HinH, did you total the red lines in your chart? I did. The below is K barrels per day.
650
650
175
130
125
120
100
80
75
60
40
2205 total
2,205,000, They produced 11 million bp/d in March. And you think this means that production continues to flow as usual. I think not.
No , Ron it is not about their production . They have admitted and you have documented the fall in production . This is about sanctions and exports . They produce 11 mbpd and export about 5.5 mbpd . This is seaborne exports, pipeline exports continue to EU .The unknown destination is obviously the traders . Russia is exporting all it can but at a lower price . Reliance just put in an order for 15 million barrels and so did Indian oil for 5 million barrels . As supply stands today we cannot afford any shortfall as that would accelerate the collapse . Checkout post of Houtskool and Peak Avocado .
https://oilprice.com/Latest-Energy-News/World-News/Indias-Reliance-Snaps-Up-15-Million-Barrels-Of-Cheap-Russian-Oil.html
You think oil is the problem . Read this the EU/ ECB are in a well so deep that cannot get out . Inflation at 15% . Interest rate negative 0.5% . Junk bonds at 4.25 % . They intend ending QE ? Question , who will buy the toilet paper PIGS bonds which are 100% monetized by the ECB . Call in Rambo or The Terminator .
https://wolfstreet.com/2022/04/22/tightening-comes-even-to-ridiculously-dovish-ecb-sooner-faster-as-seven-eu-countries-hit-by-10-16-inflation-four-by-over-9-inflation/
https://twitter.com/staunovo/status/1516786334182088712
US petroleum inventories (crude, SPR, oil products) fell by 12.795mb w/w to 1,699.086mb last week
Pollux , ” What me worry ” . 😉
P.S : Just in case you may not understand this was the line on the cover of all MAD magazines (satire) published in the 80’s- 90’s . Are they still publishing ? I don’t know .
Got my boys subscriptions years ago. Great life lessons in there… especially Spy vs. Spy! I think they are now only repeat content… nothing new being written. Sad…. Now back to oil, and all that that implies.
Gunga , I really enjoyed Spy vs Spy .
Prohias was awesome creating Spy vs. Spy. Don Martin also kept me well distracted from life!
But this is an energy discussion, so I will grow up and get back to it.
Question… what will oil be priced at in 2026 and 7 months…. kidding kidding….
25 to 250.
What me worry ? 😉
Steve
I have put together some info from the latest DPR report that may help with the LTO decline estimates you posted further up.
This first chart shows the total decline rate from the seven DPR basins as a function of time. I include this one to show the gyrations the decline rate went through as new wells drilled slowed and then started to increase. So the next two charts start from March where the data is a little more stable.
This chart shows the total decline rate as percentage from the seven basins as a function of time. It says that the current decline rate is close to 5.7% and increases with time since production has been increasing since March.
This chart may be the most useful. It shows the decline rate as function of the production rate. The equation says that for every 100 kb/d of production increase, the decline rate increases by 8.27 kb/d, on average. I guess this makes sense since the newest wells have the highest decline rates.
Ovi , you are an asset . Suggest they put you under lock and key in Fort Knox . However then what would we do here ? 🙂
Ovi,
Thanks for these charts. Indeed, the RED QUEEN seems to be running even faster in Shale.
steve
Hi Steve,
There’s a video on Youtube, posted back in Oct ’20, where you interview Dr Louis Arnoux……I’ve watched it multiple times….
One of Dr Arnoux’s most thought-provoking claims, was that net energy per barrel of oil available to the wider economy, had fell to 8% back in 2015 and could fall to zero as early as 2022….definitely by 2030.
It was a fantastic interview and I wonder if you will be catching up with Dr Arnoux this year? How much closer are we to zero net energy per barrel?
He also offered up a chart titled “Oil Price is Thermodynamically Driven”…IIRC…..so oil might spike to $200 in the near term but has zero chance of staying there?
Thank you,
Jon
Jon,
I haven’t spoken to Arnoux in some time, but plan to. I will post an update here when I do so.
stve
Thank you Steve
Jon, the analysis by Arnoux was based on a debunked method by the so called the Hills’s group. Do not rely on it.
Longer term the monthly legacy decline rate is as shown in chart below (data from April to Aug 2020 and Feb, March 2021 excluded). Data from DPR for tight oil basins used (excludes Appalachia and Haynesville regions).
Ovi,
Note that as the completion rate stabilizes at some future level, say 1100 completions per month, the curve flattens. For 5 main tight oil basins from Feb 2019 to August 2019 this occurred at an average completion rate of about 1108 per month over that 6 month period.
Just for info .
https://www.naturalgasintel.com/baker-hughes-ceo-says-everybody-wants-to-talk-lng-expansions/
LNG gonna save the world. There are already whispers in our management about a new expansion locally and government fast-tracking FERC approval.
LNGUY,
While LNG has helped keep “Business As Usual” going in the world, I don’t see it as something that is “GONNA save the world.” Why? LNG is a destroyer of Natgas EROI in all stages. The LNG carriers are twice as much as a super large VLCC, for example.
What the market doesn’t realize is that when oil production peaks, then the ability to increase Coal & Natgas production will become difficult.
steve
Most licensor technologies for base load facilities achieve greater than 90% thermal efficiency. Naturally the exact value depends on the ambient temperature, in winter for example we use a out 35MW less power vs. July, a significant value. But the refrigerant compressor turbine drives tend to run full out all year long (helper motors are used for torque assist as needed – especially in summer) and electric power can be generated using waste heat from those basically for free so fuel gas usage doesn’t vary that much.
Yeah it’s not as efficient as pipelines but it’s hardly at risk of an EROEI cliff.
https://www.bloomberg.com/opinion/articles/2022-04-21/war-in-ukraine-the-second-wave-of-russia-s-oil-shock-is-starting
“The Kremlin is doing its best to conceal the full impact of formal and informal energy sanctions after its invasion of Ukraine. But Moscow can’t hide from the satellites above Siberia that measure the amount of light its oilfields emit as unwanted gas is burned, or flared: The higher the production, the more flaring and the more light – and vice versa.
The flaring data, combined with anecdotal information from traders and leaks of official Russian statistics, suggest that eight weeks into the war, Moscow is finally succumbing to the impact of government-imposed penalties and companies’ self-sanctions. On average, Russian oil output is down 10% from its pre-war level.”
Looks like sanctions are finally beginning to bite. This is only the beginning. Interesting article.
Water issues in the Permian .
https://www.oilystuffblog.com/forumstuff/forum-stuff/lookit-this-shit
US NG ( how much is harvested on public lands) is going to be sold as LNG in Europe and the private sector is getting the profits. In the meanwhile it will drive up prices for local (US) consumers. Wouldn’t it be simpler if consumers just wrote a check to the NG industry every month? It would save so many steps…..
Great.
WP
“Venezuela looks like a country whose crude oil production was already declining before sanctions were imposed. The cost of production there was likely far higher than the world oil price. Also, Venezuela has oil debts to China that it needs to repay. At most, we might expect that Venezuela’s production could be raised by 300,000 barrels per day in the absence of sanctions.
Putting the three estimates of amounts that crude oil production can perhaps be raised together, we have:
OPEC ex Iran and Venezuela: 900,000 bpd
Iran: 1,000,000 bpd
Venezuela: 300,000 bpd
Total: 2.2 million bpd
The shortfall of crude oil production in 2021, relative to 2018 production, was 5.9 million bpd, as mentioned in Section [1]. The 2.2 million barrels per day possibly available from this analysis gets us nowhere near the 2018 level. Furthermore, we have nowhere to go to obtain the rising crude oil production required to support the rising population with enough crude oil to supply food and industrial goods at today’s consumption level.”
https://ourfiniteworld.com/2022/04/21/the-world-has-a-major-crude-oil-problem-expect-conflict-ahead/
Gail said that “expect conflict ahead”. She is a bit later as a major conflict has already started. Does anyone else think the Russian/Ukrainian crisis is about natural resources, both way I might add?
It is well known that resource scarcity increases the probability of conflict. For example it has been noted by Gail (and others) that the first and second world wars came when European coal extraction was peaking or had peaked. We are also hitting peak fresh water (see http://encyclopedia.uia.org/en/problem/136785) and water conflicts are on the rise: https://www.statista.com/chart/27272/water-conflicts/. Even if the conflict is not directly linked to energy scarcity, in times of resource scarcity heads of state lose popularity and sometimes start conflicts in order to use patriotism as an excuse to become more autocratic and consolidate power. Glenn Greenwald has noted that the Nazis did not need to introduce any legislation in order to clamp down on the population. All the necessary legal tools had already been put in place by less harmful governments. Similarly over the last 20 years in the U.S. the tendency has been to consolidate power in the presidency. The republicans pass the laws and then they are furious when the democrats use those laws to further their agenda.
I see the Ukraine invasion as a major turning point. Europe will be in the situation of Cuba and N. Korea after the collapse of the Soviet Union. I see Europe fast tracking a transition to a low carbon economy which will mean the U.S. will lose some of its most faithful allies.
“I see Europe as fast tracking a transition to a low carbon economy which will mean the US will lose some of its most faithful allies”
Please explain what mean by this. I don’t follow.
Thank you.
It would take me too long to give a complete explanation of what I mean. I
will outline the main points.
*** More data
Over the last 50 years we have discovered a great deal. Our institutions
have not incorporated much of what we have learned. In particular, our
economic theory has not incorporated economic data accumulated over the
last 50 years about the collapse of empires obtained by many authors from
Jared Diamond to Peter Turchin with David Graeber tossed in.
*** Growth
Resource availability is far more important to the growth of empires than
their institutions.
*** Stagflation
As resource growth becomes more difficult, empires resort to
complexity in order to meet needs (Tainter).
*** Collapse
Empires collapse from within as well as from without. Competitors attack
from without. Equally important is that from within, the advantages of being
part of the empire diminish. The empire has trouble meeting peoples needs. Movements of decomplexification take root:
self reliance, local resilience, and not depending on complex supply
chains becomes more attractive.
*** Application
The European economy as it is depends on Russian hydrocarbons. U.S. policy
will be to prolong the Ukrainian conflict in order to weaken Russia. Putin
will be boxed in. He will maintain the conflict in order to hold on to power
because he will not be offered an honorable way of ending the conflict.
Investment in developing Russian hydrocarbons will decline. Extraction rates
will go into decline. European alternatives to Russian hydrocarbons will be
more expensive (or non existent) and create further dependence on a finite resource. Movements such as the transition town network will become more attractive. Being part
of NATO (a hydrocarbon empire) will become less attractive. Youth will stop
looking for jobs in the wider economy, join eco-villages, and say to hell
with the U.S.
I follow, with the exception of the of the later part.-
‘The NATO hydrocarbon empire’
While petrol energy security provided by in part US military has been a part of the energy story for Europe and Asia over the past 50 years, and this will be less of an issue over time,
other attributes of the US have been and will be more valued.
Ukraine is an example- the majority of the population does not want to be
Russian subordinates.
Maybe Hungary is an example that supports what you say, but I think most in Europe will not want to have dictatorship, no matter what the energy situation.
Will Europe revert to a more severe fragmented nationalism like before the wars?
Perhaps.
Schinzy,
Using the history of growth and collapse of civilizations or empires from pre-industrial times is extremely misleading.
Look at Tainter’s “The Collapse of Complex Societies”. The subtitle is “New Studies in Archeology”. This tells you that this is not the study of modern societies.
A helpful perspective on analyses of the collapse of civilizations: pre-modern civilizations were primarily agricultural, and had very, very low growth rates. So, agricultural productivity was key, and empires with high growth rates were essentially Ponzi schemes: when the underlying economic growth rate is .01% per year, an empire can only grow temporarily by stealing. The core of the empire exploits (loots) the periphery. The periphery expands until the empire becomes too large, and then it collapses due to the lack of new victims. Agricultural products include food and wood, and a common symptom of collapse is Peak Wood, as observed for both Athens and Rome.
Any analysis of the growth and decline of pre-modern civilizations has very, very limited application to modern times.
Modern empires are different. Japan, the UK, even Russia are all far more affluent now than they ever were during the heyday of their empires.
So…comparisons of ag empires to modern conditions are not very useful.
@Nick-G,
I completely disagree. When I look at the past I see a mirror of the
present. The same motivations and the same patterns for the same reasons.
The only difference is that we have more power today so the scale is
greater. That’s why I linked to a video on The Epic of Gilgamesh above:
https://peakoilbarrel.com/opec-update-april-2022/#comment-738785
The same motivations and the same patterns for the same reasons.
Well, agricultural civilizations were zero-sum: If you wanted your kid’s lives to be better, you couldn’t build a business, or make more money. You had to steal something from your neighbors.
Look at England: they’re much more affluent now than they ever were during the heyday of the British Empire. Right now, empire is a drag. A disadvantage. A relic of the past.
China has this figured out: they grow internally, not by grabbing land from their neighbors.
I fear that I disagree again. I think many ancient Romans had wonderful rich lives.
One of the great attractions of civilization is inequality. Note how Enkidu, the wild man, was seduced into civilization.
Why do we attempt to solve all socio-economic problems through growth? What do we do if growth becomes impossible? The San people lived sustainable rich lives for over 150,000 years without growth. Do we have anything to learn from them? I think Europe would do well to investigate other means of satisfying human needs than economic growth. With less Russian hydrocarbons their economy is heading for severe contraction.
https://mishtalk.com/economics/how-russia-avoids-oil-sanctions-transfer-at-sea-to-destination-unknown
How Russia avoids oil “sanctions”
PEAK,
Another way is that Private Banks do most of the Financial settlements via the CHIPS system, outside the SWIFT System. While Central Banks can put all the sanctions they want on counties, the private banks that do all the financial settlements work OUTSIDE this arena.
Thus, most sanctions are more POLITICS than anything else.
steve
Repeating myself . Diesel , diesel , diesel . nothing else matters . Hz laterals , frac spreads , rigs etc nothing . We are looking at the wrong parameters .
https://www.globalresearch.ca/nato-sanctions-coming-global-diesel-fuel-disaster/5777305
The last sentence of your posted article: “Welcome to the Davos Great Reset eugenics agenda.” They left out the kale smoothie part. If we’re going to have a Great Reset we must include kale smoothies. Include kale smoothies or I’m not supporting the Davos part or the Reset part, much less the Eugenics part.
I’m expecting an uncontrollable move in Asia currency markets. Hong Kong doesn’t have the FX reserves to defend the peg for very long.
I’m expecting this to touch off something similar to the 1997 Asia currency crisis. Basically a massive unwind of dollar denominated debt.
So while everyone has their eyes on Ukraine and Russia. And inflationary pressures. There are deflationary pressures brewing. That can absolutely turn the tide here.
It’s something new at the moment. The black swan are the chinese lockdowns, creating much more chaos.
As long as China stays at zero Covid, the chaos will get worse.
The problem here are the disrupted supply chains, which are heavy inflationary for goods.
“Want a new car? We got only 10, how much do you bid?”
Yes, there are a lot of deflationary pressures, too – and they will play out alltogether creating an even bigger mess. There will be rationing of some goods, so you will pay with waiting time, corruption or black market prices.
Low prices doesn’t matter if the good is not available.
I think inflation and a possible coming recession is beginning to kill oil demand. Perhaps the Russian sanctions will not cause a real spike in prices. It just may be that demand will fall. I would not be at all surprised.
Rystad: Oil Demand To Sink By 1.4 Million Bpd
Global oil demand will drop by 1.4 million barrels per day, according to the latest forecast by Rystad Energy on Friday cited by the National.
The 1.4 million bpd loss would sink oil demand to 99.6 million bpd on average, below 2019 levels of 100.2 million bpd. And a rebound in this demand isn’t expected to happy until next year at the soonest, Rystead said.
The drop in oil demand will likely come from the Russian invasion of Ukraine, soaring inflation, China’s covid-inspired lockdowns, and supply chain disruptions. And even more oil demand pressure could be applied through future lockdowns or geopolitical issues.
“Shrinking demand is a direct result of the impact of lower economic activity globally,” the consultancy said, adding that such a demand decrease could ease today’s tight oil markets, calming oil prices.
Rystad isn’t the only one lowering oil demand forecasts. OPEC cut its 2022 oil demand growth forecast by 480,000 bpd on the back of lower expected global economic growth given the war in Ukraine and China’s covid lockdowns.
The IEA also cut its oil demand forecast by 260,000 bpd to reflect the return of severe covid lockdowns in China.
Meanwhile, the World Bank and the IMF have both cut their overall global growth expectations for this year.
But Rystad isn’t changing its outlook for bullish oil prices. According to Rystad, if the Russian war in Ukraine drags on, it will increase oil and gas prices, particularly if the EU ends up banning oil and gas this year.
“The Russian war worst case for oil demand is premised on Brent prices reaching $180 per barrel in the fourth quarter, triggering a further economic slowdown and outright destruction of oil demand,” Rystad said.
By Julianne Geiger for Oilprice.com
Yeah, I’m starting to see that FED won’t get very far in the rate hike cycle. Everything is going to fall apart before they get the chance to do all the rate hikes they plan to do.
Good question is what does Putin do if the price of oil goes below $70 and Russia crude is still discounted by about $30?
I think the odds of the DOW having another 1000 points down week this week are pretty good.
Russia’s ‘only oil pipeline to EU’ in flames – Germany, Austria, and Hungary face crisis.
NATO expert Thomas C Theiner tweeted: “If this fire is at the Druzhba oil pipeline pump station… then Russia’s only oil pipeline to Europe is destroyed
https://www.express.co.uk/news/science/1600623/russia-news-druzhba-oil-pipeline-fire-ukraine-eu-energy-germany-austria-hungary
Ovi , Express is crap shit . Might as well read “The Sun ” . Read the full article and read the last line . “About 70 percent to 85 percent of Russia crude oil imports come in through western ports on the Baltic Sea and the Black Sea. ”
By the way what was hit was a storage depot mostly used for supplying the armed forces in Ukraine .
HIH
I was wondering if it was similar to the Sun,
Prediction: You will began to see more and more articles in the news hinting at, and some outright admitting, that we have hit peak oil.
Long term oil prices beginning to reflect the coming oil shortage – Part II
Non-OPEC ex-US shale production has likely peaked in 2019 and will be in decline for the foreseeable future. In fact, if it wasn’t for the US, Russia and Canada, non-OPEC production had been declining since 2010. The recent events in Ukraine and the ensuing sanctions on Russia will greatly accelerate this process. At the moment, Russian output is curtailed due to voluntary sanctioning by Western companies. But going forward the Russian oil sector will struggle as it needs Western technology and investments. And despite the current crisis in energy markets and the persistent high prices, policy makers in the US seem to continue to be unwilling to allow new pipelines from Canada into the US, which would be needed to unlock more of the Canadian oil sands. In the meantime, declining production rates in the rest of the world will continue to accelerate and hardly any new projects are being sanctioned.
The combination of these factors means that global oil supply will struggle to meet continuously growing demand over the coming decade.
” But going forward the Russian oil sector will struggle as it needs Western technology and investments. ”
It will be very interesting to see the extent of truth in this.
If the Ukrainians can keep holding out they will probably step up their attacks on Russian oil infrastructure. The explosions in Belgorod and Druzhba are likely just the beginning.
Indeed… a quick conclusion to the Russian-Ukraine War would be good for everyone. However, it seems as if this war will continue to escalate and last longer than the Global Economy can afford. Add this to the China Shutdowns, and we have a recipe for disaster in 2H 2022.
Interestingly, this article was just posted by The Guardian:
The awful truth is dawning: Putin may win in Ukraine. The result would be catastrophe
https://www.theguardian.com/world/2022/apr/24/the-awful-truth-is-dawning-putin-may-win-in-ukraine-the-result-would-be-catastrophe
Whichever side of the fence individuals stand on this war, regardless… the longer it lasts, the more disruptions and global supply chain breakdowns will result.
Again, 2H 2022 and 1H 2023 should reveal how bad the situation will get for the Global Economy.
steve
A quick capitulation would be good for Putin.
He was counting on it.
Except the people who live in the country he invaded got in the way.
Now Russia says that weapons transfers to Ukraine by NATO is aggravating the situation.
Have they taken a moment to understand that their tanks and their bombs and their soldiers are ‘aggravating’ the situation.
5 million displaced Ukrainians think so.
Its a study on how to lose 50 years of attempted global trust building in 5 hours.
Hickory,
I couldn’t agree with you more.
Of course, let’s disregard the United States CIA-backed coups of 57 governments, of which 32 were successful since WW2. Furthermore, let’s ignore the over 400,000 civilians killed since the U.S. involvement in the 9/11 wars with 34 million displaced and or refugees.
But, this is in the name of FREEDOM in the war on “TERROR.” So, in that regard… it’s okay for the U.S. Military to kill civilians in the name of Freedom, but no one else.
Just wanted to make sure we got our ADJECTIVES correct. 🙂
steve
Yes let’s lay the blame where it belongs for this war: George W Bush and his psychopathic cronies Cheney and Rumsfeld, who justified invading another country with every lie in the book. Can we really blame Putin for following suit?
Can we really blame Putin for following suit?
Yes. The US invasion was wrong. The answer would be yes, as any kindergartner can tell you: two wrongs….
And for what it’s worth (which isn’t all that much) the US invasion wasn’t as bad as this. IMO it was wrong, but it wasn’t about annexing Iraq, or destroying a democracy.
You may want to check your civilian causality counts for the two wars there Nick
And lest we forget about our CIA black sites:
https://en.m.wikipedia.org/wiki/CIA_black_sites#Middle_East
For the pop quiz this evening, can you guess the three countries in the world the US has never invaded? You get a barrel of black gold for a correct answer
https://www.wearethemighty.com/articles/these-are-the-only-3-countries-america-hasnt-invaded/
civilian causality counts
It’s not really relevant to Russia/Ukraine, but I am curious: have a link that you like?
Don’t miss this one from Nytimes:
https://www.nytimes.com/2022/04/23/opinion/oil-gas-energy-prices-russia-ukraine.html
https://www.worldoil.com/news/2022/4/25/blast-at-illegal-nigeria-oil-refinery-kills-more-than-100-people/
Blast at illegal Nigeria oil refinery kills more than 100 people
William Clowes 4/25/2022
(Bloomberg) — More than 100 people died in an explosion at an illegal oil refinery in southeastern Nigeria over the weekend, demonstrating the dangers associated with an illicit industry that thrives in the crude-producing region.
The blast at a site in the Abaezi forest during the night of April 22-23 killed at least 110 people, said Ifeanyi Nnaji, head of operations for the Nigerian government’s National Emergency Management Agency in Imo state, where the accident happened. Local authorities are planning “a mass burial of the many corpses,” he said by phone on Monday.
Africa’s largest crude producer loses as many as 150,000 barrels of oil a day, or about 10% of its current output, to criminals that tap the pipelines crisscrossing the Niger Delta region, according to government estimates. At current prices, the missing barrels are worth almost $5.6 billion a year. Some industry figures believe the true scale of theft is even higher.
Much of the pilfered oil is redirected to the makeshift camps that have proliferated in the Delta’s creeks and forests where it is turned into gasoline, diesel and kerosene. The explosion near Imo’s border with Rivers state killed traders and refinery workers, Nnaji said.
President Muhammadu Buhari declared the event a “catastrophe” and instructed security agencies “to intensify the clampdown on illegal refineries,” according to a statement by his spokesman. The financial backers of the site “must all be caught and made to face justice,” it said.
The government blames the country’s inability to meet its OPEC+ production quota at least in part on crude theft. Average output in March was 1.24 million barrels of crude oil a day, according to data published by the Nigerian Upstream Petroleum Regulatory Commission. The nation’s daily OPEC limit stood at 1.7 million barrels at the time, according to data compiled by Bloomberg.
While dangerous and unlawful, manufacturing and trading fuel is popular in the Delta where many are unemployed and few occupations offer comparable incomes.
New posts are up
https://peakoilbarrel.com/decline-in-world-conventional-oil-output-and-peak-oil/
https://peakoilbarrel.com/open-thread-non-petroleum-april-25-2002/