A guest post by Dr. Minqi Li, Professor
Department of Economics, University of Utah
E-mail: minqi.li@economics.utah.edu
July 2018
This is Part 2 of the World Energy Annual Report in 2018. This part of the Annual Report provides updated analysis of world oil production and consumption, evaluates the future prospect of world oil supply and considers the implications of peak oil production for global economic growth.
(See Figure 18 near end of paper)
American geologist M. King Hubbert proposed Hubbert linearization as a statistical method to estimate the ultimately recoverable oil resources (Hubbert 1982). Hubbert linearization plots the annual production to cumulative production ratios against the historical cumulative production. It uses the downward linear trend of the annual production to cumulative production ratios to determine the ultimately recoverable resources. The parameters from the linear trend are then used to estimate peak production time and level.
This report uses Hubbert linearization to evaluate a region’s ultimately recoverable oil resources where a Hubbert linear trend can be meaningfully established, .that is, where a clear downward trend of the annual production to cumulative production ratios can be identified and has been established for at least several years. Otherwise, this report uses alternative sources to establish a region’s ultimately recoverable oil resources, such as official reserves, official projections, or ultimately recoverable resources estimated by energy research institutions.
Figures are placed at the end of each section.
Oil Consumption by Major Economies, 1990-2017
According to the BP Statistical Review of World Energy, world oil consumption (including crude oil, natural gas liquids, biofuels, and other liquid fuels made from coal and natural gas) reached 4,622 million tons of oil equivalent (4,470 million metric tons or 98.2 million barrels per day) in 2017. Between 2007 and 2017, world oil consumption grew at an average annual rate of 1.0 percent.
Figure 1 compares the historical world economic growth rates and the oil consumption growth rates from 1991 to 2017. The oil consumption growth rate has an intercept of -0.008 at zero economic growth rate and a slope of 0.612. That is, oil consumption has an “autonomous” tendency to fall by about 0.8 percent a year when economic growth rate is zero. When economic growth rate rises above zero, an increase in economic growth rate by one percentage point is associated with an increase in oil consumption by 0.61 percent. R-square for the linear trend is 0.51. In 2017, world oil consumption grew by 1.4 percent, a rate that is 0.2 percentage points below what is implied by the historical trend.
Figure 2 compares the per capita oil consumption in relation to per capita GDP for the world’s six largest national oil consumers and the European Union.
The United States is the world’s largest oil consumer. In 2017, the US oil consumption was 913 million tons of oil equivalent (19.9 million barrels per day), accounting for 20 percent of the world oil consumption. The US per capita oil consumption peaked at 3.32 tons of oil equivalent in 2004 and declined to 2.73 tons of oil equivalent by 2012. Since then, the US per capita oil consumption has slowly recovered, reaching 2.81 tons of oil equivalent by 2017.
The European Union is the world’s second largest oil consumer. In 2017, the EU oil consumption was 645 million tons of oil equivalent (13.2 million barrels per day), accounting for 14 percent of the world oil consumption. The EU per capita oil consumption peaked at 1.51 tons of oil equivalent in 1998. The EU per capita oil consumption stabilized around 1.5 tons of oil equivalent from 1999 to 2016 before falling sharply to 1.21 tons of oil equivalent by 2012. In 2017, the EU per capita oil consumption recovered to 1.26 tons of oil equivalent.
China is the world’s third largest oil consumer. In 2017, China’s oil consumption reached 608 million tons of oil equivalent (12.8 million barrels per day), accounting for 13 percent of the world oil consumption. From 1990 to 2017, China’s per capita oil consumption surged from 101 kilograms of oil equivalent to 439 kilograms of oil equivalent, which is still substantially below the per capita oil consumption levels of advanced capitalist economies.
If China’s per capita oil consumption continues to follow its historical trend in relation to per capita GDP, China’s per capita oil consumption will rise to 972 kilograms of oil equivalent by 2050 (when China’s per capita GDP is projected to rise to about 50,000 dollars). China’s population is expected to peak before 2030 and decline to 1.36 billion by 2050. Given these projections, China’s oil demand will exceed 1,300 million tons of oil equivalent by 2050.
India is the world’s fourth largest oil consumer. In 2017, India’s oil consumption reached 222 million tons of oil equivalent (4.7 million barrels per day), accounting for 4.8 percent of the world oil consumption. From 1990 to 2017, India’s per capita oil consumption increased from 69 kilograms of oil equivalent to 166 kilograms of oil equivalent. If India’s per capita oil consumption continues to follow its historical trend in relation to per capita GDP, India’s per capita oil consumption will rise to 335 kilograms of oil equivalent by 2050 (when India’s per capita GDP is projected to rise to about 19,000 dollars). India’s population is expected to grow to 1.72 billion by 2050. Given these projections, India’s oil demand will rise to about 580 million tons of oil equivalent by 2050.
Japan is the world’s fifth largest oil consumer. In 2017, Japan’s oil consumption was 188 million tons of oil equivalent (4.0 million barrels per day), accounting for 4.1 percent of the world oil consumption. Japan’s per capita oil consumption peaked at 2.22 tons of oil equivalent in 1996. Since then, Japan’s per capita oil consumption has tended to decline. By 2017, Japan’s per capita oil consumption fell to 1.48 tons of oil equivalent.
Saudi Arabia is the world’s sixth largest oil consumer. In 2017, Saudi Arabia’s oil consumption was 172 million tons of oil equivalent (3.9 million barrels per day), accounting for 3.7 percent of the world oil consumption. The Saudi per capita oil consumption increased from 3.21 tons of oil equivalent in 1990 to 5.49 tons of oil equivalent in 2015. As the Saudi economy declined in 2016 and 2017, the per capita oil consumption fell to 5.22 tons of oil equivalent by 2017.
The Russian Federation is the world’s seventh largest oil consumer. In 2017, the Russian Federation’s oil consumption was 153 million tons of oil equivalent (3.2 million barrels per day), accounting for 3.2 percent of the world oil consumption. Russia’ per capita oil consumption was 1.73 tons of oil equivalent in 1990, when Russia was a part of the Soviet Union. By 1998, Russia’s per capita oil consumption collapsed to 852 kilograms of oil equivalent. Since then, Russia’s oil consumption has slowly recovered. In 2017, Russia’s per capita oil consumption was 1.06 tons of oil equivalent.
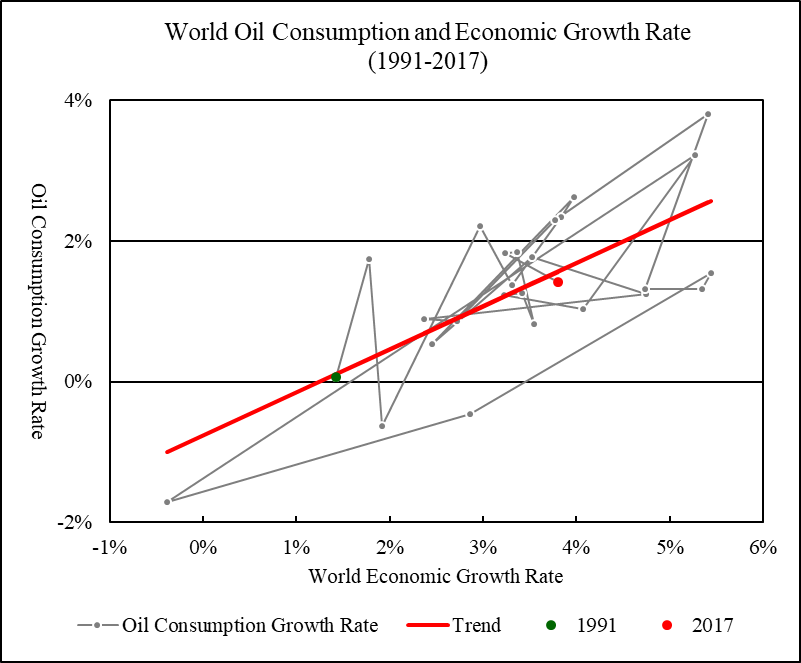
Figure 1 World Oil Consumption and Economic Growth, 1991-2017
Linear Trend: Oil Consumption Growth Rate = -0.008 + 0.612 * Economic Growth Rate (R-square = 0.506)
Sources: World oil consumption from 1990 to 2017 is from BP (2018). Gross world product in constant 2011 international dollars from 1990 to 2016 is from World Bank (2018), extended to 2017 using growth rate reported by IMF (2018, Statistical Appendix, Table A1).
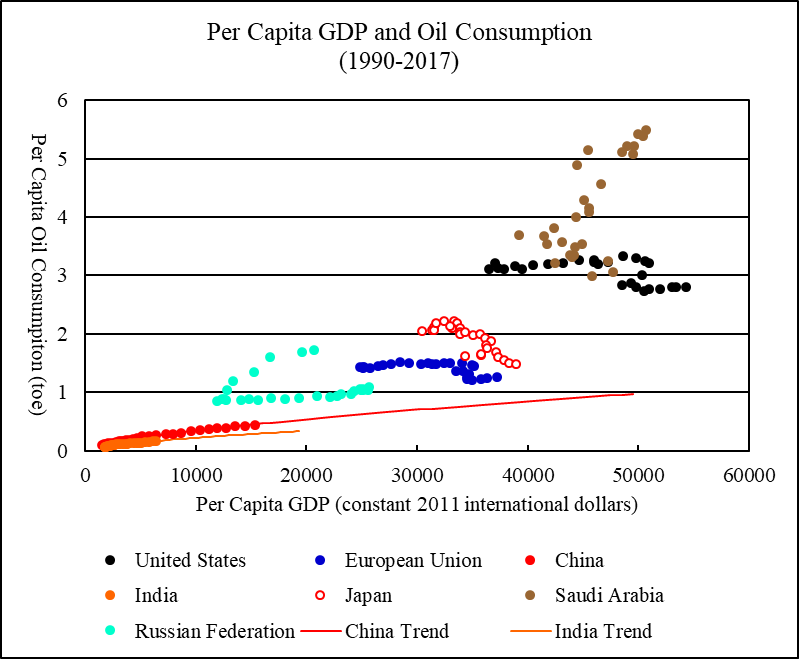
Figure 2 Per Capita GDP and Oil Consumption, Major Economies, 1990-2017
Sources: Per capita oil consumption and per capita GDP are calculated using data for oil consumption, GDP, and population. National and regional oil consumption from 1990 to 2017 is from BP (2018). National and regional GDP from 1990 to 2016 is from World Bank (2018), extended to 2017 using growth rates reported by IMF (2018, Statistical Appendix, Table A1, A2, and A4). National and regional population from 1990 to 2016 is from World Bank (2018), extended to 2017 by assuming that the 2017 population growth rates are the same as the 2016 growth rates. To project China’s and India’s per capita oil consumption, a log-linear relationship is estimated between the per capita oil consumption and per capita GDP for the period 1990-2017. China’s and India’s GDP and population projections from 2018 to 2050 are from EIA (2017, Reference Case, Table A3 and Table J4), adjusted to make the projected GDP and population levels in 2017 matching the levels reported by World Bank (2018).
The United States
The United States is currently the world’s largest oil producer. In 2017, the US produced 571 million metric tons of oil (13.1 million barrels per day), accounting for 13 percent of the world oil production (according to the BP definition, oil production includes crude oil and natural gas liquids only, excluding biofuels and liquid fuels made from coal and natural gas).
The US conventional oil production peaked in 1970 (when the US oil production reached 534 million tons). By 2008, the US oil production declined to 302 million tons. Since then, the US oil production has experienced a spectacular expansion because of the shale oil boom. The US Energy Information Administration projects that the US oil production will keep growing rapidly until 2022, when the US oil production is expected to approach 700 million tons. The US oil production is projected to peak in 2042 at 751 million tons (EIA 2018, Reference Case, Table A1).
The US cumulative oil production up to 2017 was 33.5 billion metric tons (cumulative production up to 2007 is from BGR 2009, Table A 3-2, extended to 2017 using annual production data from BP 2018). Applying Hubbert linearization to the annual production to cumulative production ratios implied by the projected US oil production from 2041 to 2050, the US ultimately recoverable oil resources are estimated to be 93.4 billion metric tons and the remaining recoverable oil resources are estimated to be 59.9 billion metric tons. By comparison, the US “proved” oil reserves at the end of 2017 were reported to be 6 billion metric tons (BP 2018).
Figure 3 shows the historical US oil production and the future oil production projected by EIA.
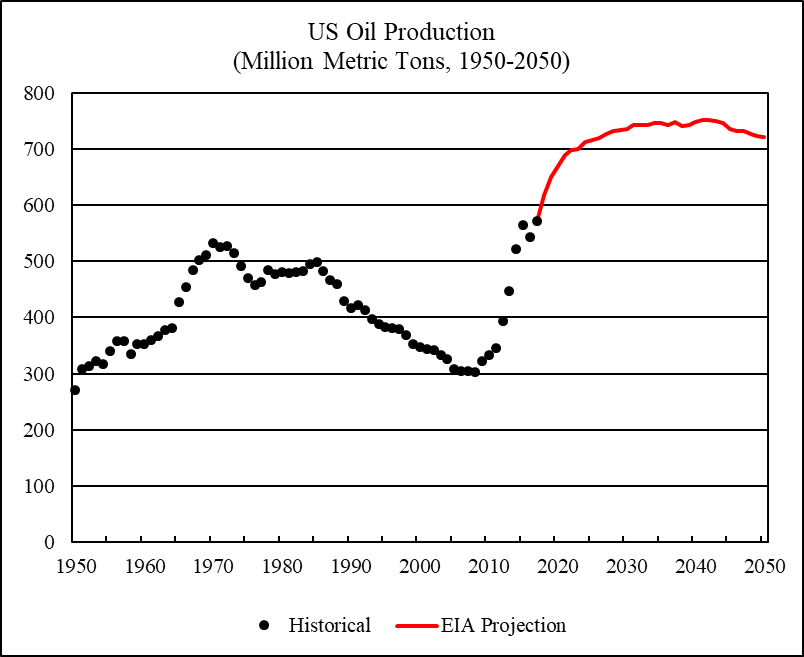
Figure 3 US Oil Production, 1950-2050
Sources: The US historical oil production from 1965 to 2017 is from BP (2018); historical oil production from 1950 to 1964 is from Rutledge (2007). Projected US oil production from 2018 to 2050 is from EIA (2018, Reference Case, Table A1), adjusted to make the projected oil production level in 2017 matching the production level reported by BP (2018).
Saudi Arabia
Saudi Arabia is the world’s second largest oil producer. In 2017, Saudi Arabia produced 562 million metric tons of oil (12.0 million barrels per day), accounting for about 13 percent of the world oil production.
Saudi Arabia maintained a significant amount of “spare capacity” and the Saudi oil production is often influenced by market or geopolitical factors. In 2014, Saudi Arabia decided to increase oil production in order to compete with the US shale oil for market share, leading to the collapse of world oil prices. By 2016, Saudi Arabia’s oil production reached 587 million metric tons, the highest production level in history. Since then, Saudi Arabia has cooperated with Russia to limit oil production and has succeeded in raising the world oil prices.
Citing information from Saudi Aramco, Aleklett (2012: 173-175) argued that Saudi Arabia had about 700 billion barrels of original crude oil in place and the ultimately recoverable amount was estimated to be about 390 billion barrels. Aleklett (2012: 182-184) believed that Saudi Arabia could maintain a crude oil production level at about 12 million barrels per day up to 2030.
This report assumes that Saudi Arabia’s ultimately recoverable oil resources are the sum of historical cumulative production and the official reserves. Saudi Arabia’s cumulative oil production up to 2017 was 21.5 billion metric tons (cumulative production up to 2007 is from BGR 2009, Table A 3-2, extended to 2017 using annual production data from BP 2018). Saudi Arabia’s official oil reserves at the end of 2017 were reported to be 36.6 billion metric tons (BP 2018). The ultimately recoverable oil resources are estimated to be 58.1 billion metric tons, or about 424 billion barrels (1 metric ton of oil = 7.3 barrels).
Based on the above assumptions, the Saudi oil production is projected to peak in 2030 at 606 million metric tons. Figure 4 shows the historical and projected Saudi Arabia’s oil production.
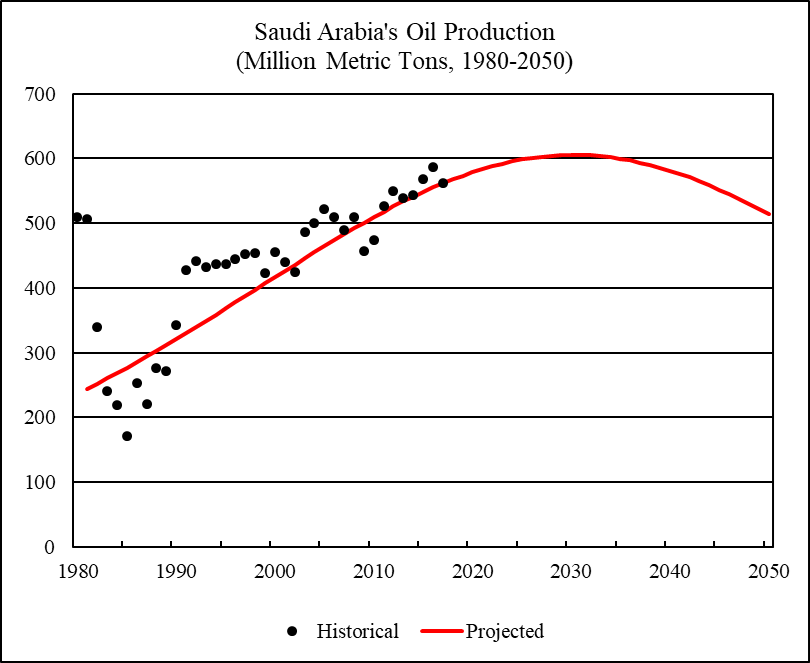
Figure 4 Saudi Arabia’s Oil Production, 1980-2050
Sources: Saudi Arabia’s historical oil production from 1980 to 2017 is from BP (2018).
Russian Federation
The Russian Federation is the world’s third largest oil producer. In 2017, Russia produced 554 million metric tons of oil (11.3 million barrels per day), accounting for about 13 percent of the world oil production.
Figure 5 projects Russia’s annual production to cumulative production ratios against the historical cumulative oil production from 1980 to 2017. Hubbert linearization is applied to the annual production to cumulative production ratios from 2004 to 2017. Regression R-square is 0.979. Where the downward linear trend meets the horizontal axis indicates Russia’s ultimately recoverable oil resources to be 66.5 billion metric tons. Russia’s cumulative oil production up to 2017 was 24.5 billion metric tons. Thus, Russia’s remaining recoverable oil resources are estimated to be 42 billion metric tons. By comparison, Russia’s official oil reserves at the end of 2017 were 14.5 billion metric tons (BP 2018).
The parameters from the Hubbert linear trend are used to project Russia’s future oil production. Figure 6 shows Russia’s historical and projected oil production. Russia’s oil production is projected to peak at 598 million metric tons in 2033.
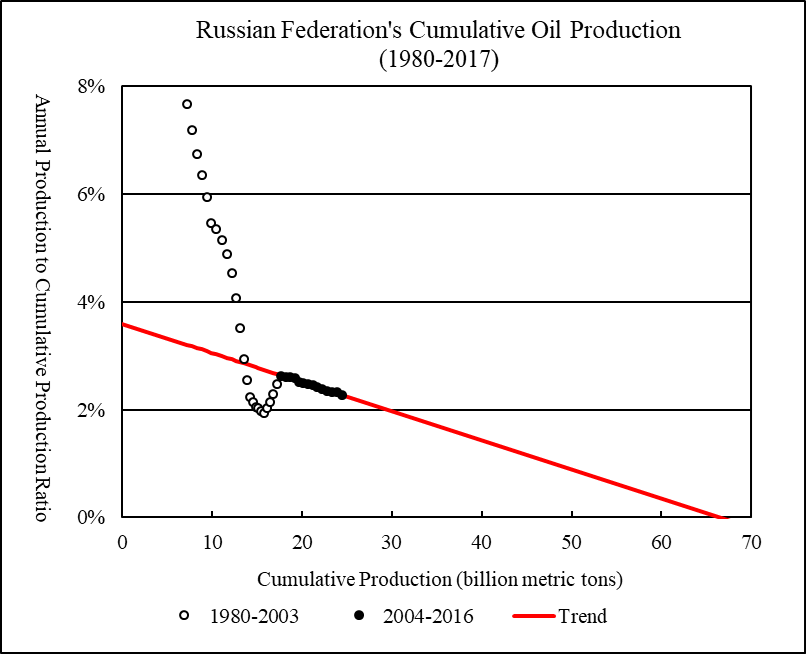
Figure 5 Russian Federation’s Cumulative Oil Production, 1980-2017
Sources: Russia’s cumulative oil production up to 2007 is from BGR (2009, Table A 3-2). This is used as the reference point. Cumulative production ending in other years is then calculated using annual production data reported by BP (2018).
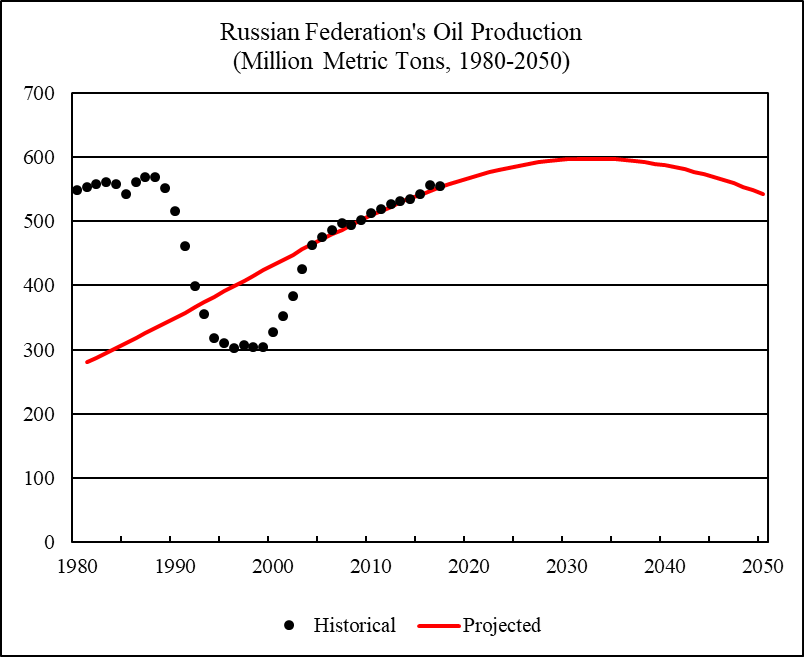
Figure 6 Russian Federation’s Oil Production, 1980-2050
Sources: Russia’s historical oil production from 1985 to 2017 is from BP (2018). For 1980-1984, Russia’s oil production is assumed to be 91 percent of the Soviet Union’s total oil production.
Canada
In 2017, Canada produced 236 million metric tons of oil (4.8 million barrels per day) and became the world’s fourth largest oil producer in term of tons. Canada accounted for 5.4 percent of the world oil production.
This report assumes that Canada’s ultimately recoverable oil resources are the sum of historical cumulative production and the official reserves. Canada’s cumulative oil production up to 2017 was 6.3 billion metric tons (cumulative production up to 2007 is from BGR 2009, Table A 3-2, extended to 2017 using annual production data from BP 2018). Canada’s official oil reserves at the end of 2017 were reported to be 27.2 billion metric tons (BP 2018, including 26.6 billion tons of oil sands reserves). The ultimately recoverable oil resources are estimated to be 33.5 billion metric tons.
Based on the above assumptions, Canada’s oil production is projected to peak in 2049 at 391 million metric tons. Figure 7 shows the historical and projected Canada’s oil production.
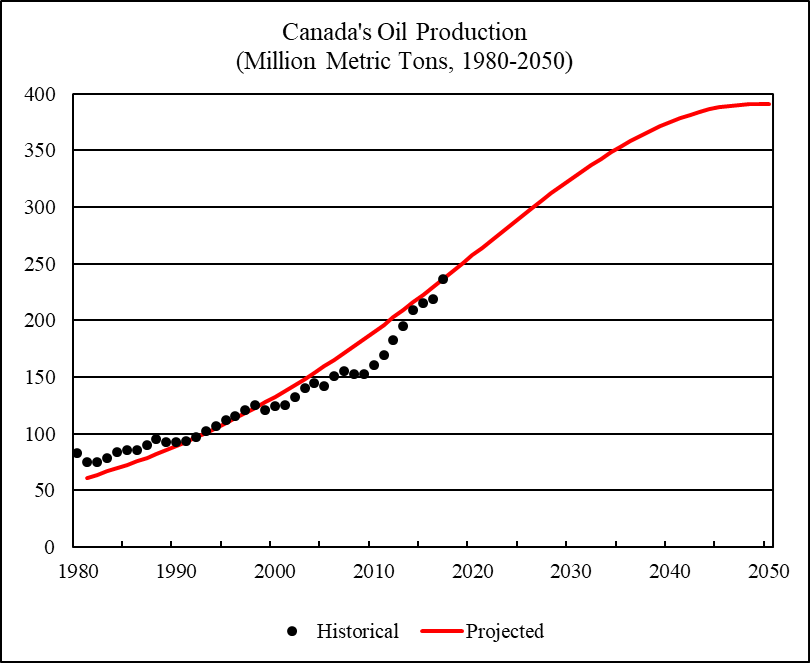
Figure 7 Canada’s Oil Production, 1980-2050
Sources: Canada’s historical oil production from 1980 to 2017 is from BP (2018).
Iran
In 2017, Iran produced 234 million metric tons of oil (5.0 million barrels per day) and was the world’s fourth largest oil producer in term of barrels. Iran accounted for 5.3 percent of the world oil production.
Since 1979, Iran’s oil production has often fallen substantially below its potential due to geopolitical instabilities. This report assumes that Iran’s ultimately recoverable oil resources are the sum of historical cumulative production and the official reserves. Iran’s cumulative oil production up to 2017 was 10.4 billion metric tons (cumulative production up to 2007 is from BGR 2009, Table A 3-2, extended to 2017 using annual production data from BP 2018). Iran’s official oil reserves at the end of 2017 were reported to be 21.6 billion metric tons (BP 2018). The ultimately recoverable oil resources are estimated to be 32 billion metric tons.
Based on the above assumptions, Iran’s oil production is projected to peak in 2039 at 267 million metric tons. Figure 8 shows the historical and projected Iran’s oil production.
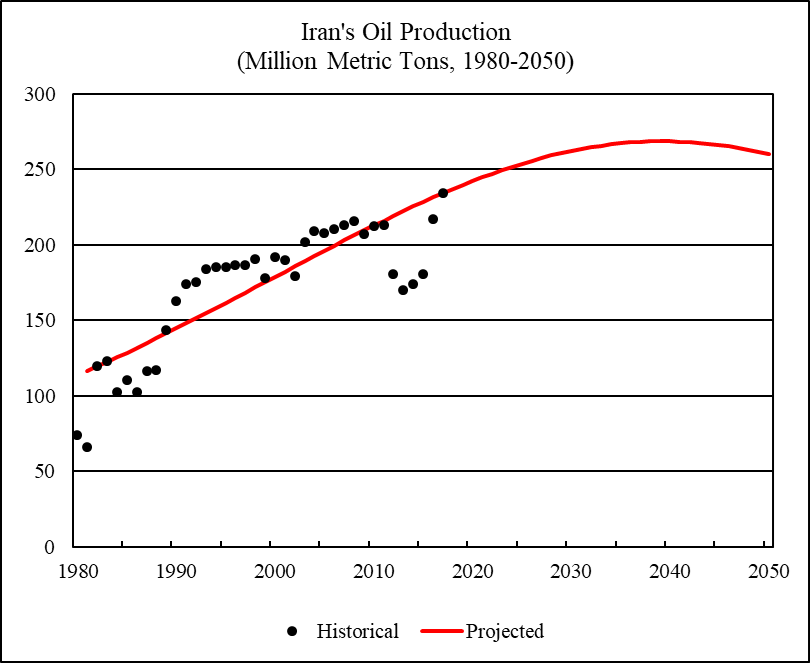
Figure 8 Iran’s Oil Production, 1980-2050
Sources: Iran’s historical oil production from 1980 to 2017 is from BP (2018).
Iraq
Iraq is the world’s sixth largest oil producer. In 2017, Iraq produced 222 million metric tons of oil (4.5 million barrels per day), accounting for 5 percent of the world oil production.
Iraq’s oil production collapsed during the Iran-Iraq war in the 1980s, the first Gulf War in the 1990s, and the American Invasion with intense military actions from 2003 to 2007. The Iraqi oil production has grown rapidly since then. This report assumes that Iraq’s ultimately recoverable oil resources are the sum of historical cumulative production and the official reserves. Iraq’s cumulative oil production up to 2017 was 5.8 billion metric tons (cumulative production up to 2007 is from BGR 2009, Table A 3-2, extended to 2017 using annual production data from BP 2018). Iraq’s official oil reserves at the end of 2017 were reported to be 20.1 billion metric tons (BP 2018). The ultimately recoverable oil resources are estimated to be 25.9 billion metric tons.
Based on the above assumptions, Iraq’s oil production is projected to peak in 2042 at 324 million metric tons. Figure 9 shows the historical and projected Iraq’s oil production.
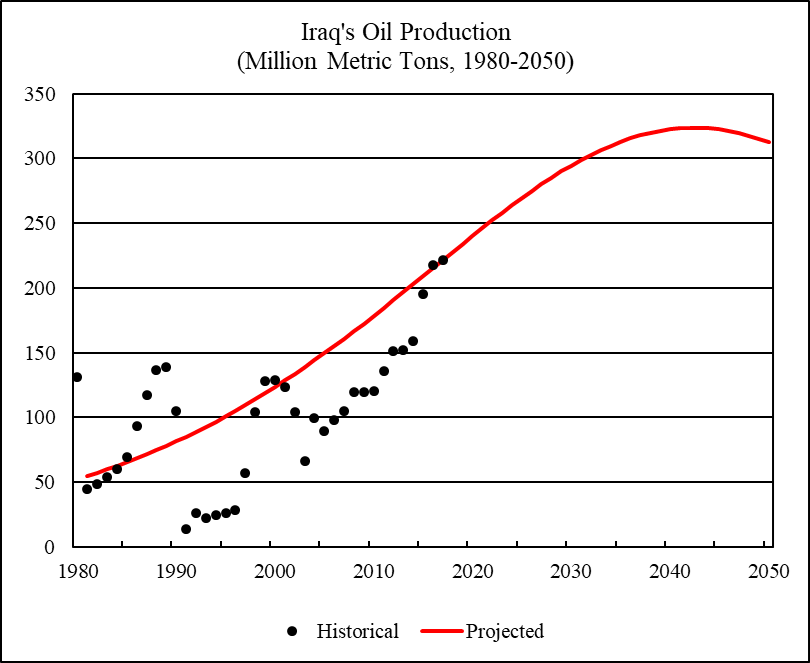
Figure 9 Iraq’s Oil Production, 1980-2050
Sources: Iraq’s historical oil production from 1980 to 2017 is from BP (2018).
China
China is the world’s seventh largest oil producer in term of tons. In 2017, China produced 192 million metric tons of oil (3.8 million barrels per day), accounting for 4.4 percent of the world oil production. China’s oil production peaked at 215 million metric tons in 2015.
Figure 10 projects China’s annual production to cumulative production ratios against the historical cumulative oil production from 1980 to 2017. Hubbert linearization is applied to the annual production to cumulative production ratios from 1999 to 2017. Regression R-square is 0.958. Where the downward linear trend meets the horizontal axis indicates China’s ultimately recoverable oil resources to be 13.8 billion metric tons. China’s cumulative oil production up to 2017 was 6.9 billion metric tons. Thus, China’s remaining recoverable oil resources are estimated to be 6.9 billion metric tons. By comparison, China’s official oil reserves at the end of 2017 were 3.5 billion metric tons (BP 2018).
The parameters from the Hubbert linear trend are used to project China’s future oil production. Figure 11 compares China’s historical and projected oil production and consumption. China’s oil consumption is projected to rise from 595 million metric tons in 2017, to 699 million tons in 2020, 934 million tons in 2030, 1,149 million tons in 2040, and 1,320 million tons in 2050.
China is already the world’s largest oil importer. Under the projections, China’s net oil imports (consumption less production) will rise from 389 million metric tons in 2017, to 494 million tons in 2020, 754 million tons in 2030, 1,014 million tons in 2040, and 1,230 million tons in 2050. This will be equivalent to 28 percent of the world oil production in 2017 or more than twice the oil production of Saudi Arabia.
If China’s oil consumption does follow the projections shown in Figure 11, it can be expected that China’s oil demand will impose an overwhelming burden on the global oil market over the coming decades, contributing to major global economic and geopolitical instabilities. Alternatively, the inability of the world oil market to meet China’s oil demand may impose an insurmountable limit to China’s future economic growth.
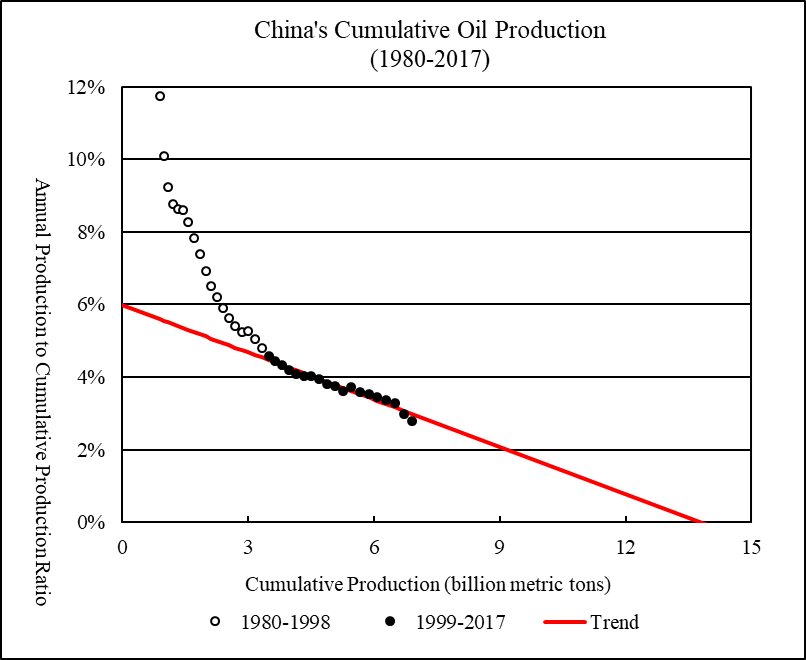
Figure 10 China’s Cumulative Oil Production, 1980-2017
Sources: China’s cumulative oil production up to 2007 is from BGR (2009, Table A 3-2). This is used as the reference point. Cumulative production ending in other years is then calculated using annual production data reported by BP (2018).
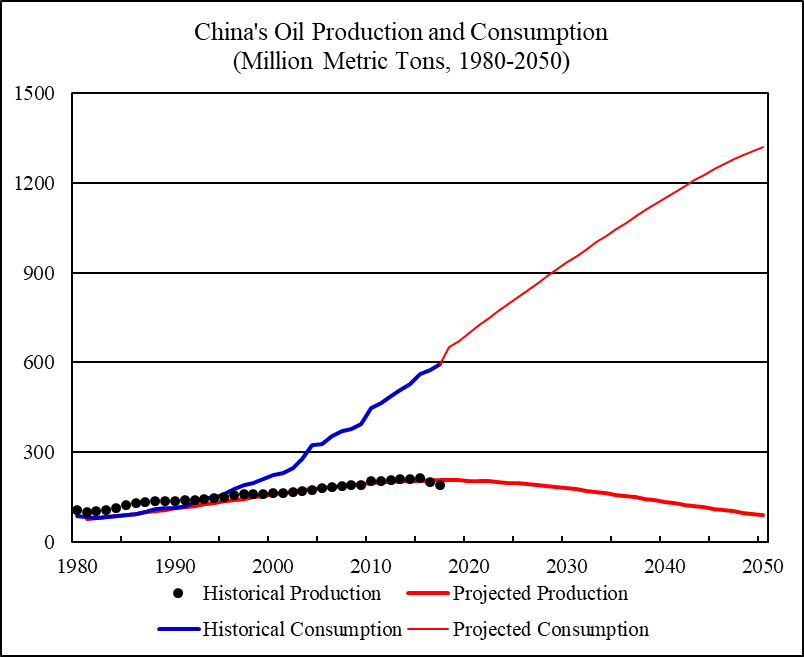
Figure 11 China’s Oil Production and Consumption, 1980-2050
Sources: China’s historical oil production and consumption from 1980 to 2017 is from BP (2018). China’s future per capita oil consumption is projected by assuming that per capita oil consumption will grow in accordance with the historical relationship between per capita oil consumption and per capita GDP (see Figure 2). Future oil consumption is then calculated as the product between per capita oil consumption and projected population. China’s population projection from 2018 to 2050 is from EIA (2017, Reference Case, Table J4), adjusted to make the projected population level in 2017 matching the population level used by this report.
United Arab Emirates
United Arab Emirates (UAE) is the world’s seventh largest oil producer in term of barrels. In 2017, UAE produced 176 million metric tons of oil (3.9 million barrels per day), accounting for 4 percent of the world oil production.
This report assumes that UAE’s ultimately recoverable oil resources are the sum of historical cumulative production and the official reserves. UAE’s cumulative oil production up to 2017 was 5.2 billion metric tons (cumulative production up to 2007 is from BGR 2009, Table A 3-2, extended to 2017 using annual production data from BP 2018). UAE’s official oil reserves at the end of 2017 were reported to be 13 billion metric tons (BP 2018). The ultimately recoverable oil resources are estimated to be 18.2 billion metric tons.
Based on the above assumptions, UAE’s oil production is projected to peak in 2037 at 218 million metric tons. Figure 12 shows the historical and projected UAE oil production.
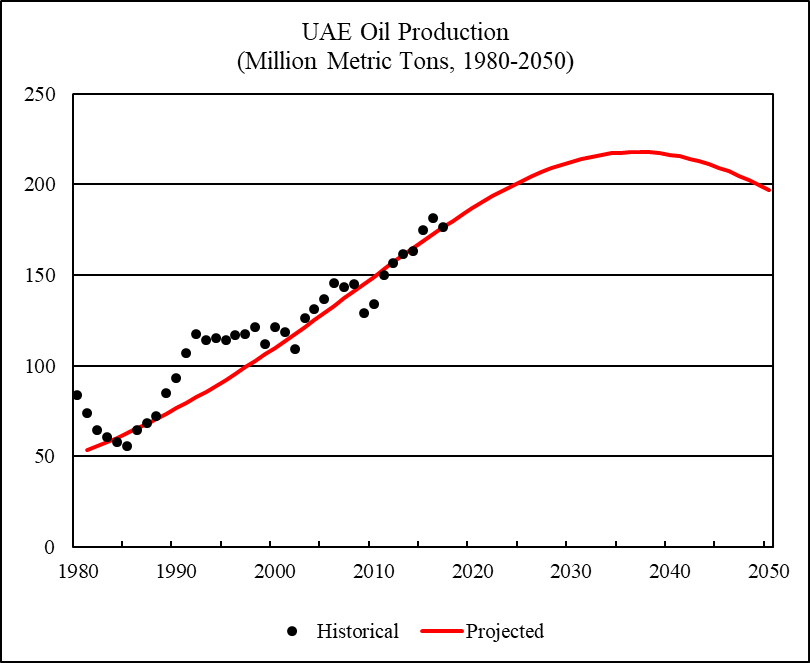
Figure 12 UAE Oil Production, 1980-2050
Sources: UAE’s historical oil production from 1980 to 2017 is from BP (2018).
Kuwait
Kuwait is the world’s ninth largest oil producer. In 2017, Kuwait produced 146 million metric tons of oil (3.0 million barrels per day), accounting for 3.3 percent of the world oil production.
This report assumes that Kuwait’s ultimately recoverable oil resources are the sum of historical cumulative production and the official reserves. Kuwait’s cumulative oil production up to 2017 was 6.7 billion metric tons (cumulative production up to 2007 is from BGR 2009, Table A 3-2, extended to 2017 using annual production data from BP 2018). Kuwait’s official oil reserves at the end of 2017 were reported to be 14 billion metric tons (BP 2018). The ultimately recoverable oil resources are estimated to be 20.7 billion metric tons.
Based on the above assumptions, Kuwait’s oil production is projected to peak in 2040 at 167 million metric tons. Figure 13 shows the historical and projected Kuwait’s oil production.
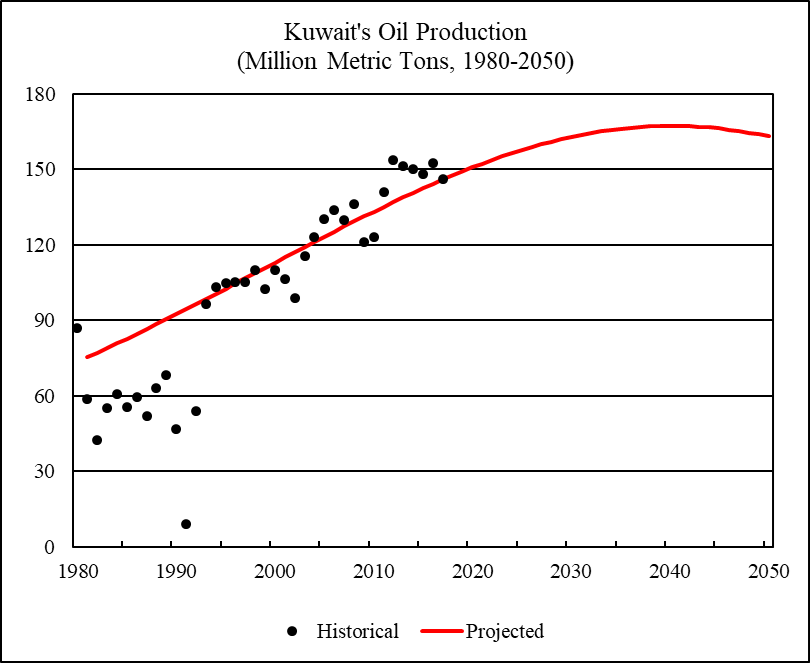
Figure 13 Kuwait’s Oil Production, 1980-2050
Sources: Kuwait’s historical oil production from 1980 to 2017 is from BP (2018).
Brazil
Brazil is the world’s tenth largest oil producer. In 2017, Brazil produced 143 million metric tons of oil (2.7 million barrels per day), accounting for 3.3 percent of the world oil production.
Figure 14 projects Brazil’s annual production to cumulative production ratios against the historical cumulative oil production from 1980 to 2017. Hubbert linearization is applied to the annual production to cumulative production ratios from 1991 to 2017. Regression R-square is 0.756. Where the downward linear trend meets the horizontal axis indicates Brazil’s ultimately recoverable oil resources to be 7.2 billion metric tons. Brazil’s cumulative oil production up to 2017 was 2.6 billion metric tons. Thus, Brazil’s remaining recoverable oil resources are estimated to be 4.6 billion metric tons. By comparison, Brazil’s official oil reserves at the end of 2017 were 1.9 billion metric tons (BP 2018).
The parameters from the Hubbert linear trend are used to project Brazil’s future oil production. Brazil’s oil production is projected to peak in 2024 at 151 million metric tons. Figure 15 shows Brazil’s historical and projected oil production.
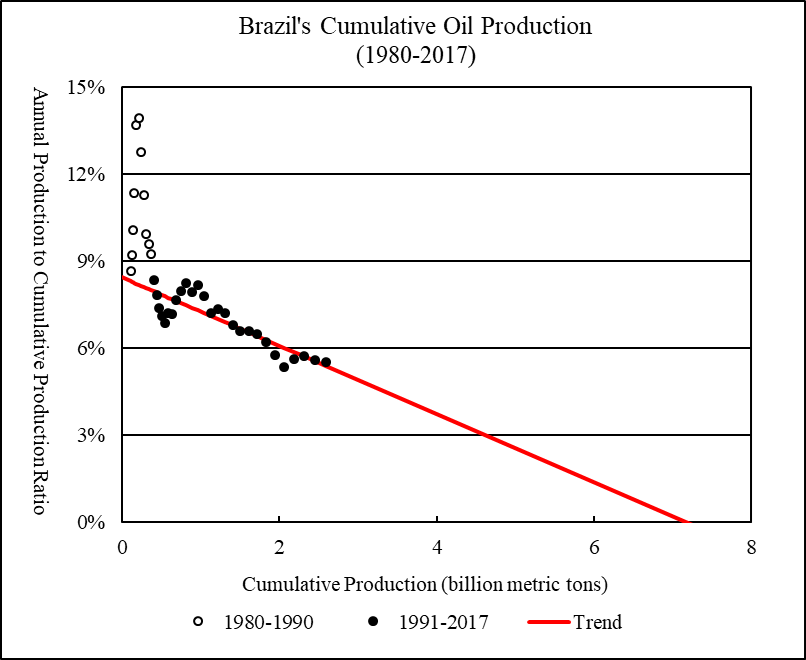
Figure 14 Brazil’s Cumulative Oil Production, 1980-2017
Sources: Brazil’s cumulative oil production up to 2007 is from BGR (2009, Table A 3-2). This is used as the reference point. Cumulative production ending in other years is then calculated using annual production data reported by BP (2018).
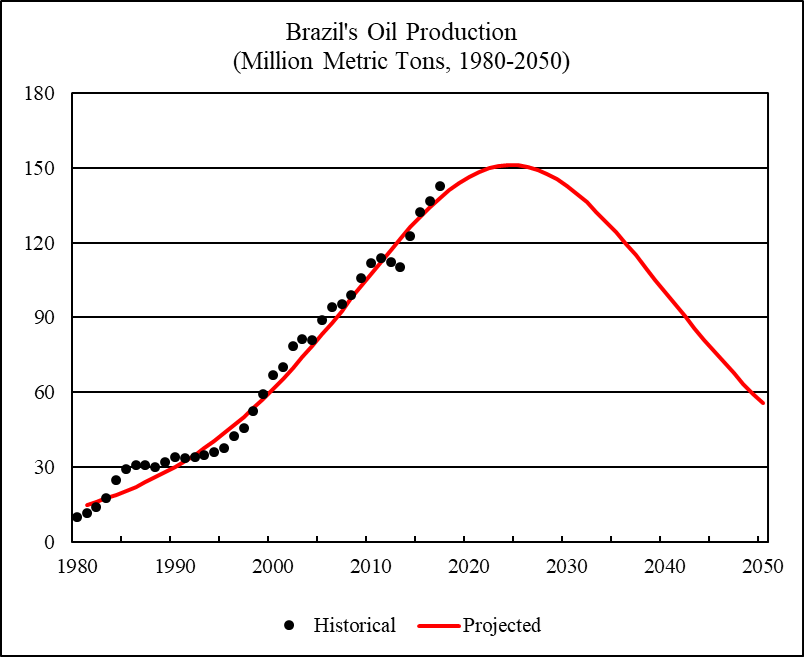
Figure 15 Brazil’s Oil Production, 1980-2050
Sources: Brazil’s historical oil production from 1980 to 2017 is from BP (2018).
Rest of the World
Rest of the world is defined as the world total excluding the ten largest oil producers. In 2017, rest of the world produced 1,351 million metric tons of oil, accounting for 31 percent of the world oil production. Rest of the world’s oil production peaked in 2005 at 1,654 million metric tons.
Figure 16 projects rest of the world’s annual production to cumulative production ratios against the historical cumulative oil production from 1980 to 2017. Hubbert linearization is applied to the annual production to cumulative production ratios from 1991 to 2017. Regression R-square is 0.989. Where the downward linear trend meets the horizontal axis indicates rest of the world’s ultimately recoverable oil resources to be 99 billion metric tons. Rest of the world’s cumulative oil production up to 2017 was 68.9 billion metric tons. Thus, the rest of the world’s remaining recoverable oil resources are estimated to be 30.1 billion metric tons.
The parameters from the Hubbert linear trend are used to project rest of the world’s future oil production. Figure 17 shows rest of the world’s historical and projected oil production.
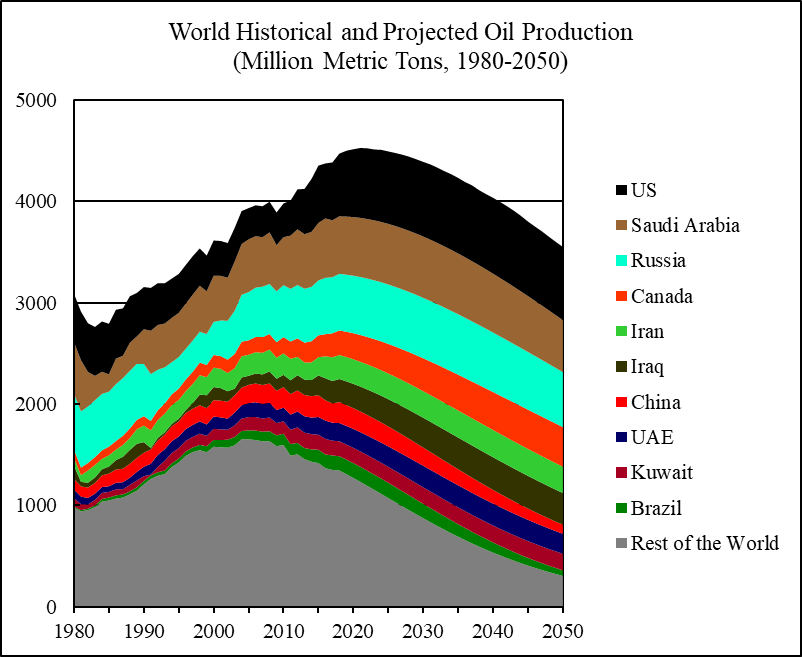
Figure 18 shows the historical and projected world oil production. World cumulative oil production up to 2017 was 192 billion metric tons. World ultimately recoverable oil resources are estimated to be 468 billion metric tons. World remaining recoverable oil resources are estimated to be 276 billion metric tons. By comparison, world oil reserves at the end of 2017 were reported to be 239 billion metric tons by BP (2018).
World oil production is projected to peak in 2,021 at 4,529 million metric tons and decline to 3,552 million metric tons by 2050. According to the historical linear relationship between world economic growth and oil consumption growth estimated in Figure 1, zero oil consumption growth is associated with a world economic growth rate of 1.2 percent. Other things being equal, absolute declines in world oil consumption will be associated with global economic growth rates less than 1.2 percent.
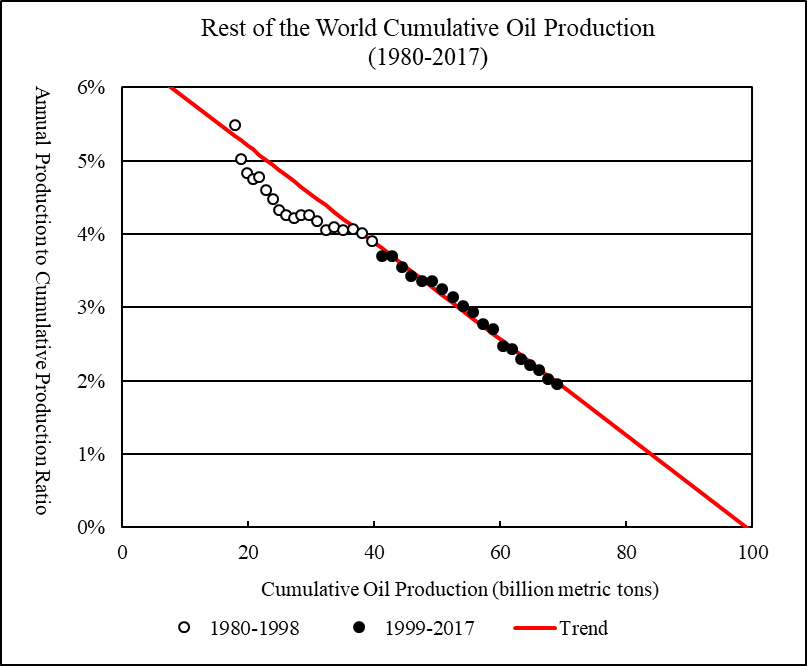
Figure 16 Rest of the World’s Cumulative Oil Production, 1980-2017
Sources: Rest of the world’s cumulative oil production up to 2007 is from BGR (2009, Table A 3-2). This is used as the reference point. Cumulative production ending in other years is then calculated using annual production data reported by BP (2018).
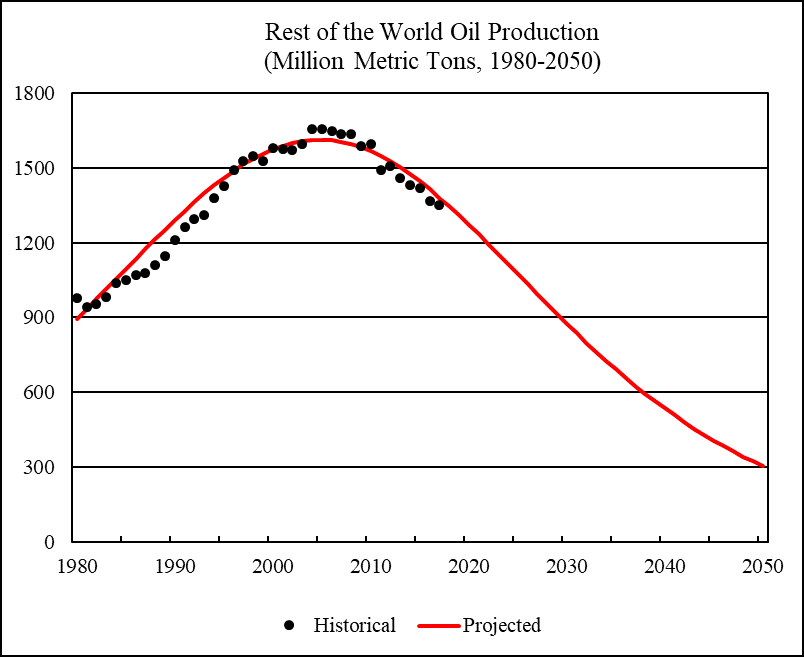
Figure 17 Rest of the World’s Oil Production, 1980-2050
Sources: Rest of the world’s historical oil production from 1980 to 2017 is from BP (2018).
Figure 18 World Historical and Projected Oil Production, 1980-2050
Sources: Historical oil production from 1980 to 2017 is from BP (2018).
References
Minqi,
Great post thanks. The estimated URR for Brazil is a bit suspect because the recent annual production divided by cumulative production (aP/CP) is only about 5%. The HL method gives poor results at such an early level of the production history.
Consider the following HL for the US from 1924 to 1945 when aP/CP is in the same range you used for Brazil (5% to 9%), the projected URR is about 67 Gb, when cumulative production through 2014 was 212 Gb.
Dennis, I think you are right about Brazil.
I also suspect the Brazil HL exercise could prove to be too conservative. But the implied remaining recoverable is still much larger than the “official” reserves. So at least it’s preferred to the reserves.
Since some of my estimates are likely to have erred on the optimistic side (such as for the US and Iran), this Brazil pessimistic bias might be a useful correction.
Minqi,
The US resources are probably overstated, but the AEO projection through 2025 is probably reasonable, after that the LTO resources are far lower than estimated by the EIA so the US C+C output from 2025 to 2050 will be far lower than forecast by the EIA.
In my view your Iran prediction looks ok, and Iraq might be a bit conservative from 2018 to 2025, based on the rate of increase for the past 7 or 8 years. Again the logistic was used by Hubbert as a convenient bell shaped curve, not every country’s output (or even the World) is likely to have that shape.
Thanks for this summary. We need to deduct OPEC’s paper barrels, so often mentioned by Jean Laherrere
http://crudeoilpeak.info/opec-paper-barrels
It’s not only China which has peaked 2010-15, but the whole Asia Pacific region which is supposed to be the growth engine for the next decades
Peak oil in Asia Pacific (part 1)
http://crudeoilpeak.info/peak-oil-in-asia-pacific-part-1
In the meantime, Australia is selling off all its gas as alternative transport fuel
Australia is exporting itself gas poor, plans LNG import terminals
http://crudeoilpeak.info/australia-is-exporting-itself-gas-poor-plans-lng-import-terminals
There is talk of $200 oil if Iran blocks the Strait of Hormuz
https://www.forbes.com/sites/edhirs/2018/07/25/oil-at-200-plus-per-barrel-iran-can-make-it-happen/#540814696840
If Iran blocks the Strait of Hormuz there will be war.
Iran would not try to block anything unless it is under attack by the US. The Pentagon is opposed to such an attack, but Trump is heavily influenced by Netanyahu and is advised by the same neocons who got the US into the fiasco in Iraq. Given the inability of the US Congress to enforce the constitution by denying the Prsident to start a war without a congressional declaration of war, it seems the USA may be on its way to destroy the world economy to please an extremist Israeli right wing government.
I write destroy the world economy because it’s doubtful Iran would respond as anticipated by the Americans, who have a tendency to fight wars with strategies based on previous wars and an excess of complex gadgets and extremely expensive technology. I don’t know what they have in mind, but I’m sure it would be unexpected, calibrated to avoid nuclear retaliation, and may evolve over time. But I’m sure others will see the risks, and the oil market will take off into the $100’s and possibly $200’s unless there’s adults left in the USA senate to block this craziness.
Shutting down the Straits of Hormuz would probably be Iran’s first step.
I have said it before and I will say it again. Iran shutting down the Straits of Hormuz would be Trump’s wet dream. He would like nothing better to happen. It would give him a chance to have “Trump’s War”, and to revel in what he thinks would be a quick victory and propel him to the heights of stardom.
If you think he would listen to advisors who would advise him against it, then you have not been paying attention. Trump listens to no one except himself. He sees himself as a “stable genius” and believes no one knows better than himself.
But of course, Iran knows this and would not likely try to shut down the Straits. Anyway, a strong American naval fleet in the Persian Gulf and Arabian Sea would probably prevent Iran from starting anything.
Iran has most of the world on their side regarding the sanctions on their nuclear ambitions. If they shut off the world’s access to oil, nobody will be happy with them, and would be more likely to side with the current US position. Nothing about shutting off the access, and setting themselves up as the “bad guys” makes sense. Then, again, I’m not an Iranian ruler, so who’s to say?
See the paper referenced by Aleklett et al 2012.
The “paper” barrels for OPEC may be real. We don’t have great information on OPEC reserves.
If the paper barrels were real and assuming a realistic depletion rate, Saudi Arabia would be producing 35 million barrels/day. And similarly Kuwait, Iraq, UAE, and Iran would be producing triple of what they’re producing today.
Frugal,
Only if one assumes that OPEC develops and extracts its oil resources as quickly as the US, UK, and Norway. As I said before read the first title in the references, a simple assumption is that OPEC has chosen to develop their resources slowly so that oil prices are not driven to under $30/b (2018$). Supply is constrained by demand and profitability. Even OPEC struggles with oil at $30/b as they subsidize consumption at home by charging below market prices for fuel.
Governments might be overthrown in OPEC nations if this policy was changed.
At some point OPEC may develop and extract resources more quickly to drive down oil prices to compete with EVs and possibly natural gas in the land transport sector, but this is unlikely to occur before 2035 to 2045 in my view.
Incorrect.
Here is something:
Trump, Iran and the New Guns of August
https://www.bloomberg.com/view/articles/2018-07-24/trump-iran-and-the-new-guns-of-august
Interesting commentary. I think that over time, oil export restrictions on Iran as part of sanctions are going to be very hard to enforce, since its oil exports are increasingly more critical to places like India, China, Korea, Japan. They will be more concerned with their energy imports than the regional conflict over the horizon.
I agree– and with all those KSA installations just 15 minutes away by unstoppable missile technology (1970 midrange seems a little hard for current technology), we have a quandary, not a problem.
Exactly. But I’m not sure US National Security advisor Bolton knows anything about low technology midrange missiles and drones, some of which, in a pinch, can be piloted by small light weight kamikaze martyrs.
Have I read this right that the outlier ist the USA with 59 Btons reserves with only 6 proven.
With all other countries, the reserves proven ratio is more in line with about 30% error.
So: Ist there an huge additional oil reserve in the USA we just haven’t found so far, or does the Hubbert model, which was created when there was only conventional oil production, just not work on shale oil + easy wallstreet money.
Another thing: Does the Hubbert model work with creaming oil fields, keeping production rates constant with a sharp decline in contrast to traditional oil production with it’s long slow decline.
Another big outlier is Russland with about 300% – it’s also known for creaming a lot, but in the big areas of Siberia the exsistence of undiscovered ressources is more likely than at any other place in the world.
EIA projections may eventually prove to be too optimistic.
On the other hand, the US “proved” reserves have always been too conservative. That’s the case even before the shale oil boom.
Great post Dr. Minqi Li, thanks.
I think the Hubbert Linearization trend line for China has changed. Daqing has started to decline very fast. This is because of water has hit the horizontal infill wells at the top of the reservoir. This will be the case for a lot of other wells that have been creamed by infill drilling with horizontal wells right along the top of the reservoir.
“This will be the case for a lot of other wells that have been creamed by infill drilling with horizontal wells right along the top of the reservoir.”
Do you think this keeps certain people up at night? It seems pretty harrowing to me. Worse than a beer bong.
Edit: How interesting to find this shit has been going on since the 90s:
https://www.ogj.com/articles/print/volume-98/issue-19/drilling-production/horizontal-wells-find-varied-applications-in-saudi-fields.html
There have been no problems since then, apparently. So we should conclude the oil is infinite…
Ron, many thanks for the comments.
I checked China’s National Bureau of Statistics. For the first six months of this year, it appears that China’s oil production has stabilized just above 500,000 tons per day or approximately 3.5 million barrels/day. So perhaps the annual to cumulative production ratios will begin to decline somewhat more slowly.
Ron, Daqing field has numerous relatively thin reservoirs, it has been water and polymer flooded, and the water cut has been really high for many years. I suspect the shift to a steeper production decline is a result of field operations optimization, which leads to well shut in when prices are too low.
If my guess is right, the production should stabilize and possibly increase a bit as prices go up. However, there’s a factor we see in fields like Daqing which won’t allow production to bounce back to the previous decline trend. Many wells making high water cut from a heterogenous and thick perforated section will produce 100% water after being shut in for several months. There’s a reason for it, but it’s too technical to explain here.
FWIW (which is to say, not much): As a lay person who has taken this seriously for years (learning about it first in the 80s in a geology class, doing lots of reading and monitoring of websites in the 2000s), I have to say–I believe none of it.
The peak oil experts were dreadfully wrong with their HL 15 years ago, so what prevents their being just as wrong now? I’m not even saying the date predicted here (+/-2020) will come and go and oil extraction will keep rising with demand.: No, I find it so untrustworthy that it might be wrong the other way: Perhaps the water will hit those horizontals in Ghawar tomorrow and production will fall off a cliff. Perhaps drilling won’t happen fast enough in the tight oil plays to stave off festering decline rates. Perhaps all the estimates of reserves by OPEC are big fat lies. How are we going to tell?
Note that it was the perfectly ignorant who turned out to be right 15 years ago–and not because they made any effort to be. The scholars–brilliant, well-meaning, well-informed–were shockingly off-base, but those who just screamed “Drill, baby, drill!” were right on. And fiddle-dee-doo.
I have a feeling were all just running blind into a future which is perfectly unpredictable and for which we cannot hope to be prepared. Over & out.
Yes, you can count on the projections being wrong. But its the best wrong we’ve got, overall.
“But its the best wrong we’ve got, overall.”
Perhaps you’re right. How would we know?
You don’t know who’s right until all the oil is gone.
Only hindsight is 20/20.
The worst thing for a date to guess is politics.
There are 10 countries that have to grow oil production to avoid peak oil – these with still big reserves.
One knocked out itself – Venezuela
One is under attack from the USA – Iran
Irak isn’t that stable, either.
A hot war can break out every moment, or a civil war devasting and blocking infrastructure for years, while other countries deplete.
Or peace can come and these ressources can get used.
These combined 10 mb/d alone will determine peak oil – by 5 years or more in either direction. These 10 mb/day can’t be replaced by russion oil tsars, US rednecks with too much Wallstreet money or Saudis opening secret valves of instant oil wonder production.
Venezuela can get a new government and increase production by a big amount, helped by international money. It has the ressources to get one of the big producers when the tar oil is lifted.
So in my eyes, it looks like somewhere between 2020 and 2030, perhaps even later.
The best we can hope for is that increasing renewable energy and EV’s take a big bite out of that proposed production curve. Of course falling population and industrial failure could do the same.
Win win?
I think that EVs will start to have a serious influence in a few years. I think the influence won’t be so much on volume as on price. EVs are much cheaper to operate than combustion engines, so the effectively cap the oil price.
The “economic” argument against peak oil is that as supply gets constrained, marginal sources come into play. EVs may limit that. High oil prices are more likely to increase demand for EVs than for marginal oil, simply because it’s faster and easier to build an electric car fleet than it is to accessed a new oil field.
Hi Michael B,
Couldn’t agree with you more regarding OPEC reserve estimates, they are all full of shit, and no one except a handful of people in those countries would know how much they have left.
Solving this peak oil timing is more similar to a quantum mechanics problem rather than a Newtonian mechanics one. It complexity, lack of transparency and political and economic implication make it impossible to have a deterministic answer, its pure probability, and also speculations.
Like you i think all these projections are wrong. Maybe we will extract a lot more oil with newer technologies or new field discoveries and end up cooking the planet with climate change, and we won’t see a “peak oil” for 100s of years who knows.
It’s one of those things in life which you just don’t know what the hell will happen. But so far the Cornucopians have been right and the Malthusians wrong.
Probably won’t find a lot of new fields, but there may be a bit of reserve growth. USGS estimates about 3000 Gb of “conventional” (not extra heavy oil or tight oil) and perhaps 1000 Gb of “continuous” oil, my medium or best guess is 2800 Gb conventional and 500 Gb extra heavy and 100 Gb tight oil (entire World). If the USGS is correct, we would still be likely to see a peak n C+C output before 2035. The extra heavy oil is difficult to develop quickly, but if there is 500 Gb of tight oil (5 times more than my guess) the peak could move 10 years to the future (from 2025 to 2035). My guess is that if there is tight oil developed outside North America, China might be the most likely place, Russia still has a lot of conventional reserves and may be slow to develop there tight oil resources the same rule applies to most OPEC nations.
Yes I agree with that and also if oil prices rise we might see more supply coming online. Canada for e.g. seems to have a lot of oil sands. It costs a lot more to produce so at higher oil prices they might ramp up their production also, which might lead to an oversupply and prices will fall until production is cut short.
But again i have no clue what the future holds. But i am almost certain we are probably all wrong in our predictions lol
To ramp up production in oil sands would take megabucks, and years of completion time. In the meantime, the decline rates march on. I see them doing that, but by the time it is online, peak oil has come and gone.
I recently decided to read the signs the most simple way possible: World oil production is flat since 2005, with the exception of sands and fracking. Now most of this was added and we’re entering a new flat period that might last about a decade. Then alternative energy sources should be ready to compensate for the decline. Otherwise …
Westtexasfanclub,
Not quite right, World C+C minus extra heavy and LTO output has increased since 2005, not by much, about 1 Mb/d, peak for “conventional” C+C (excludes extra heavy and LTO output) may be around 2021.
“But so far the Cornucopians have been right and the Malthusians wrong.”
That is a very interesting thought. How much further can we push the system past natural limits and still maintain a techno-industrial civilization with high population in a viable world?
Currently some think the fossil fuels will end this century, but they possibly could be extended well into the next. Eventually we will have to move to other energy sources, as we are starting to now.
Indicators now show loss of fresh water and soil to be greatly limiting factors.
Some think population will stall at 9 billion and fall (slow or fast), while others project 11 billion at the end of the century.
In the long run, unless we move to a whole new level of civilization, say a Type I civilization, natural limits will be the major factor sooner or later.
The further reality is that even an energetic Type I civilization needs to eat and drink, implying a reduced population and/or one that has strong knowledge and control over biological/ecological processes.
Will population crash before we move to the theoretical Type I civilization? Possibly, and with present knowledge, probably. But that does not fully exclude a rise to a Type I civilization later, unless the planet enters a toxic and anoxic phase of climate.
And then of course there is the proceeding of the extinction event. The breakdown of the fabric of the living system. A huge factor that may override history completely.
How much further can we push the system past natural limits and still maintain a techno-industrial civilization with high population in a viable world?
That’s the key question which no one knows in my opinion.
Environmental degradation and climate change might bite first I suppose. You can logically predict that eventually this expanding balloon of human civilization will pop, but what will trigger the popping could be so many different things.
At the moment I am not so sure anymore that energy will be the needle to pop the western civilization balloon.
I can’t “project” us being a type-1 civilization, (ignoring the inhibiting and relentless influence of entropy) humans are so divided. Religion, nationalism, racism, and political affliations being the main divisive agents, and i can’t see us ever getting rid of any of them. The human brain is still very primitive, and it seems it can’t keep up with the exponential change that has being occurring since the industrial revolution. But yea that’s just my worthless opinion.
Oswald Spengler wrote a book in 1919 predicting the end of western civilization by 2200AD i think. Very interesting book.
“But so far the Cornucopians have been right and the Malthusians wrong.”
Yep! As the pile of shit get’s higher and higher that chances of some of it catastrophically hitting the fan sooner or later gets higher as well. Yet the Cornucopians are totally convinced that because it hasn’t happened yet the Malthusians are totally wrong!
Guess the Cornucopians don’t get that past performance is no guarantee of future results. They should have a long sit down chat with the major global insurance companies to get a better understanding of risk assessment.
Malthus was right, only those that haven’t spent the time to actually read what he said will disagree.
Some of the damage is irreversible, meaning that as excess “shit” is trimmed off by the “fan”, there will be no recovery and continued destruction means more trimming. A pulsed decline, until it tumbles over the edge into complete oblivion or the source of decline is removed.
As far as things not happening yet, the only people that do not see that many losses have occurred already and more are occurring now, are blatantly and probably purposefully delusional.
“so far the Cornucopians have been right and the Malthusians wrong.”
I remember when cornucopians used to predict space travel, flying cars, prices for energy and raw materials so low as to be too cheap to meter/matter, political harmony, etc.
I think if we can look out at a world with extinctions proceeding at breakneck pace, global warming proceeding past the point of no return, coral reefs dying, oceans filled with plastic, life expectancy gains slowing or even reversing, energy prices and materials prices remaining stubbornly high, rising debt, inequality, stagnant wages, generations growing up with less income and more debt than those who came before, too poor to get married or buy a house, let alone have children, increasing military spending, authoritarianism, refugee flows, renewed arms races and angry populations the world over turning to populist leaders and looking to turn back the tide of globalization and put their little corner of the world first and we can call that a cornucopian vision come true, then this speaks more to how even the idea of what cornucopian means has been so reduced by the last few decades of struggle and stagnation, that we don’t even recognize how far we’ve fallen from what we once expected of our economies, our societies and ourselves.
Michael, look at the “rest of the world”. How can we say there has been no “peak oil”?
“The peak oil experts were dreadfully wrong with their HL 15 years ago, so what prevents their being just as wrong now? ”
Why is Oil at $70/bbl? Back in 1999 its was about $10/bbl. If there no supply constraints why did the price increase ~7 fold in less than 20 years? Also why the need to to drill for Shale Oil (Source Rocks) & develop in Deep & ultradeep water?
Conventional oil peaked in 2005, All the growth is coming from offshore & Shale. New Oil discoveries have dropped off the cliff. We found almost nothing in 2017. Oil Discoveries peaked in 1960s and been in permanent decline. Thus if we are discovery less and less new oil fields every year, below the rate of consumption, Oil production will have to fall to match discoveries at some point in the future.
Other clues:
1. Oil Majors perfer to drill on Wall street (aka using debt to fund stock buybacks) instead of developing new fields for future production.
2. Shale Debt: Shale drilling never made a profit, except for using OPM (other People’s money) to fund CapEx\OpEx.
3. US invaded or targeted with Regime change in Middle East Oil producing nations. Only Iran remains and you can already hear the War drumbeats for Iran.
Indeed, and thanks. Note that your answer has to do not with HL but with obvious signs & symptoms. Believe me, I’ve been watching, too. The uncertainty is killing me.
In a society driven and controlled by money, the common good will be forgotten to be replaced with the uncommon profit.
Michael, I have never been a peak oiler. I come at this from a different perspective: about 30 years ago I noticed exploration results were decaying, and started working in areas which would allow producing oil and gas in the far future from sources we weren’t tapping much at the time.
I remember sitting in a meeting around 1990 and suggesting to managers in a committee I was briefing that we needed to focus on locking up hydrocarbon molecules, wherever they were, cut down exploration and use that money on technology and getting access.
This is one reason why eventually I got involved in gas conversion to liquids, heavy oil, and the former Soviet Union, which to us appeared like a happy hunting ground, including its Arctic targets in the Barents, Kara, Yamal, etc. I also had colleagues who went into deep water, EOR, North America Arctic, and of course the hydraulic fracturing of vertical horizontal wells drilled in low perm formations.
So in my case I’ve been about 30 years now working on replacing conventional oil barrels with more difficult barrels. And those difficult barrels require higher prices. So the question is, what can poor countries afford?
So, “not a peak oiler” means you think the fate of conventional oil is not really all that important, and cost is the ultimate arbiter, not the resource?
Not a peak oiler means I don’t use Hubbert Linearization or similar techniques. In the past, my job has included the estimate of resources (not reserves). The preferred technique was to estimate technical reserves, meaning we supposedly didn’t focus on economics. But I couldn’t have staff working out numbers doing endless iterations and model runs for highly speculative cases, so I gave them the guidance to assume a really high price, a higher OPEX and CAPEX environment, and prepare conceptual field redevelopments and marginal field developments or targeting really low quality reservoirs. We devoted about 5% of the time budget for this effort. And I told head office I wasn’t about to use more manpower working such hypothetical figures, because we had to focus on reserve studies, and preparing projects to move reserves along the reserve progression pathway so we could meet our targets.
The fate of conventional oil is already written, in the sense that most of the extra oil we get from conventional fields comes from redevelopments which rely on higher prices, and EOR. The typical field with say 45% recovery factor can be pounded hard to push it to say 55%, going above 55% gets mighty hard, and pushing to 60% is nearly impossible. So there are limits, which involve the huge amount of resources (cash, steel, chemicals, and people) we use up to get those extra barrels.
One issue to consider is that these redevelopments which include EOR are not contributing that much extra rate. They stop decline, get a slight bump, and then yield a slower decline rate for 10-20 years. This means investments take tine to payout and if the world is suffering from acute shortages they don’t help that much. The on,y fast reaction comes from fracturing “shales” and low permeability sands, infills in newer fields, and workovers.
Thanks. If you were doing this in the 90s, sounds like you were “predicting” the future!
Sure sounds like a long explanation for your understanding of ‘peak conventional oil’. Nothing to be ashamed of.
Fernando,
Many people define peak oil as simply World output of C+C reaching some maximum level and then declining at some future point (there might be a plateau in output for 5 to 7 years before decline becomes rapid (more than 1.5%/year). I imagine that by that definition you might be a peak oiler.
In any case , I don’t think HL is a viable method and tend to use the estimates of the USGS and other experts for TRR along with discovery data as the basis for my scenarios. I do consider myself a “peak oiler”.
Peak oil on conventional reserves was called quite accurately. That peaked in 2005. The only reason production has risen since is different resources – tar sands and fracking. EOR running flat out as well but we’d still be way down without Canada + USA.
Also, Iraq finally came online and sanctions ended against Iran but those look like they have run their course now.
With oil discoveries the last 3 years in the toilet due to lack of capital investment and lack of major fields its just a matter of time mathematically. Be thankful we still have time before peak production hits cause I don’t think it will be fun post peak. Hopefully still 5 years until its official maybe less…When will Ghawar give up the ghost….?
Saudi Arabia may keep going for many years at 10 Mb/d, probably until 2030, perhaps beyond.
One can hope….they can produce 10 Mb/d to infinity according to their reserve numbers which never budge….I’d be curious what posters think their reserves are. 175-225 GB?
It’ll be interesting to see how KSA shakes out when oil consumption begins to zero in on oil production, and exports decrease.. ELM.
https://ycharts.com/indicators/saudi_arabia_oil_consumption
While other countries’ fields continue to deplete at the same time.
Get your looms and home gardens ready…
As Michael B. says, those Saudi MRC wells could hit 100% water tomorrow. There was a lot of lying done by everyone for decades.
Including the EIA.
I’m not sure where to jump in so, here goes:
1) Exxon Mobil publishes a yearly outlook: A view to 2040 is often in the title. Here is a link to their latest:
https://cdn.exxonmobil.com/~/media/global/files/outlook-for-energy/2018/2018-outlook-for-energy.pdf The graph on page 35 depicts crude oil and condensate production peaking in the 2040 timeframe. The 2005 peak in conventional production can be seen but is masked. The 2016 version of this graph clearly shows that peak that was famously called by Deffeyes as occurring on Thanksgiving Day 2005. Their 2015 graph is at the bottom of this reply.
2) I’m driving an EV now. It’s averaging about 4.6 miles per kwhr or roughly 46 miles to the “gallon” where the “gallon of electricity” (e.g., 10 kwhr) costs $1.00
3) The PV on my roof provides about 300 kwhr in January where my home has used a max of 2200 kwhrs. In the late spring to early fall, I am overall a very very very slight exporter of electrical energy.
4) I’m trying to figure out if solar thermal might be of use in January or adding more PV would be more efficient.
5) When Matt Simmons challenged Saudi Aramco back in 2004, the Saudis said they could pump 10 million a day starting in 2004 before peaking in 2042 or rising to 12 million a day by 2016 before peaking in 2033. If they followed a Hubbert Curve, they would peak around 2025. The graph above shows the Saudi production peaking at 600 million metric tons (a year) which works out to 12 million barrels a day. This graph shows them peaking a little before 2034 at 2030. Not sure how to tie Dr. Li and the Saudi Aramco graphs together. I have a copy of both the Simmons and Saudi Aramco presentations in PDF form (3 and 5 MBs, respectively).
I’m hoping that solar cell efficiency climbs to 40 to 60% and battery storage falls to a few cents/kwhr. I know we are on our way there. It’s an interesting horse race.
They say:
• Global liquids production rises by 20 percent to meet demand growth
They figured demand growth would rise by 20% so they just said that supply would grow by 20% to match it. It’s just an assumption that supply will automatically grow to meet demand. So they need to figure out where that growth will come from. Most of the increase, they say, will come from natural gas liquids and tight oil with deepwater and oil sands supplying most of the rest.
They have natural gas liquids almost doubling and tight oil increasing by about three fold. Their take below, bold mine.
• Technology innovations lead to growth in natural gas liquids, tight oil, deepwater, oil sands and biofuels
• Technology enables efficient production from conventional sources, which still account for more than 50 percent of production in 2040
• Most growth over the Outlook period is seen in tight oil and natural gas liquids, which reach nearly 30 percent of global liquids supply by 2040
• Continued investment is needed to mitigate decline and meet growing demand
• Liquids trade balances shift as supply and demand evolve
• North America swings to a net exporter as shale growth continues
• Latin America exports increase from deepwater, oil sands and tight oil supplies
• The Middle East and Russia/Caspian remain major oil exporters to 2040, and Africa shifts to an importer
• Europe remains a net oil importer, as demand and production both decline
• Asia Pacific imports increase to 80 percent of oil demand in 2040
You’ve pointed out why it’s impossible for a lay observer to get a firm handle on this.
Pete, if the cost per watt of PV is low enough, why are further gains in efficiency all that important?
Well, we did discover that ‘elephant” in Azerbaijan in 2000–
It has only been 18 years.
There was no elephant oil discovery in Azerbaijan in 2000.
Ah—-
Kazakhstan
So sorry
Another consideration is discoveries and reserve appreciation. Consider estimates of conventional C+C using Hubbert Linearization by Jean Laherrere which have gradually increased from 1998 (1800 Gb) to 2016 (2500 Gb.) In addition, there is not any particular reason that output would tend to follow a “Hubbert” type logistical function.
Generally estimates based on Hubbert Linearization would be a minimum estimate in my view.
In addition conventional oil Extraction rates (output divided by producing reserves) in the World (5.6% in 2016) are far lower than the United States (14.8% in 2016, all C+C), so there is the potential that with higher oil prices the average extraction rate for the World may increase. The World conventional extraction rate was about 11.6% in 1979. A gradually increasing rate of extraction might allow a plateau in output to be extended for many years (to 2030 at least). Impossible to predict of course, the number of scenarios that can be created is large.
One such scenario is presented below (peak in 2025 at 85.5 Mb/d of C+C or 4275 Mt/year).
The analysis using the logistic function does not account for this potential.
International Energy Agency – Oil Market Report: 12 July 2018
now available to non-subscribers
download from here: https://www.iea.org/oilmarketreport/omrpublic/currentreport/
https://pbs.twimg.com/media/DjC5s79XcAA0_xG.jpg
https://pbs.twimg.com/media/DjC564-W0AETF5a.jpg
https://srsroccoreport.com/top-u-s-shale-oil-fields-decline-rate-reaches-new-record-half-million-barrels-per-day/
“While the U.S. reached a new record of 11 million barrels of oil production per day last week, the top five shale oil fields also suffered the highest monthly decline rate ever.”
Good article.
I disagree. Oil prices are more likely to increase than to fall to $30/b and more of these companies are likely to be profitable as oil prices rise, also 3 of the top companies are profitable, so a “well run” oil company can indeed be profitable, those that are less well run will either change the way they operate or they will go out of business. The better companies buy the worthwhile assets on the cheap and life goes on.
It’s called capitalism folks. 🙂
Also the DPR is not very good, I ignore that report and use EIA’s tight oil estimates (link below) and shaleprofile.com for good information.
https://www.eia.gov/energyexplained/data/U.S.%20tight%20oil%20production.xlsx
“Also the DPR is not very good”, is an understatement. I have never seen an analysis use so many different fruits to come up with bananas expected.
Dennis.
A lot of lying was done by the shale guys for at least the last 5 years. Few of them have made money, and all of them would lie to their own mother on her deathbed if they thought it would get them a nickle.
You are far too cornocopian and credulous. These shale guys are over $350 billion in debt (yes, billion) which is unrepayable at any oil price. The EIA wants to believe desperately in their shale narative because that’s how they get paid. Why would you listen to people hopelessly in debt, to the tune of hundreds of billions? I would consider that to be a very serious miscalculation.
Sounds like another 2008 Wall Street debacle to me.
Michael Sutherland,
I dont believe the shale companies. I take the data from Shaleprofile, Enno Peters excellent website, and EIA tight oil data, see link in previous comment.
I also base costs on the comments of Mike Shellman and the excellent blog posts of Rune Likvern.
The reality is that the debt will be paid back by 2027 and after that there will be positive cash flow under reasonable oil price scenarios.
The whole debt will never be repaid argument depends on $75/b oil forever.
Not likely to happen as peak oil is approached and supply cannot meet demand at $75/b.
I suppose by “decline rate” they are talking about the “legacy decline”
As an example, I will use approximate data from a fairly good tier 2 well in the Eagle Ford. It starts off production at 33k the first month, and drops rapidly after that to reach 8k by the final month. Let’s say it produces 175k the first year, which would be profitable at today’s prices. The next year it produces 55k, and the next year 36k. By the fourth year it is producing less than 100 barrels a day, and by the sixth year it is questionable to keep up. Little better than stripper status. Tier three stuff is much worse, it may reach stripper status by the third year. Eventually, all will be tier two and three status wells. That’s the majority of reserves estimated. Estimating future production from current production doesn’t touch on reality. Eventually, to keep up on initial production, you would have to drill twice as many wells. But, you won’t keep up with twice as many, because the decline rates will be higher. There is a lot of difference between a 600k EUR well, and a 300k EUR, or a 150k EUR. 2042 for US peak? Not hardly.
Guym,
I agree, probably 2023 to 2025 will be the US peak, after that decline is likely to be rapid because mostly tier 2 and tier 3 wells will be left, high oil prices may make them profitable, but it will be impossible to keep up with the decline rate of legacy wells after 2025 and US output will decline rapidly (4 or 5% per year) after 2030.
Exactly.
One snag: The Shale Debt starts coming due in 2019 and continues through to 2024. Shale drillers were successful since the borrowed at rock bottom interest rates and investors practically fought each other begging Shale drillers to take their money. Not so sure it will work if interest rates are higher, and The Shale sweet spots aren’t endless.
That might slow the start up, for sure. If the price of oil gets high enough, that will barrier will be short lived.
As oil prices increase so does the costs. It takes a lot of diesel to haul Water, Sand, and oil. Shale drillers never really made a real profit, even when Oil was over $100/bbl. One must consider the EROEI for Shale & rising CapEx\OpEx as the cost of Oil rises.
Second, its likely that consumers cannot afford high oil prices. As prices rise, Consumers will cut back and it will plunge the global economy back into recession. Perhaps the Worlds Central banks can coach something back into the global economy, but it won’t work over the long term.
FWIW: Some of the recent data is showing weakness in the global economy: Housing sales are falling and prices in the hot regions are flatlining. Trumps tariffs are also taking a toll as global trade is falling. And there are cracks in the developing world credit markets. We might see a stock market correction this fall, which would likely see commodity prices fall (including Oil).
” consumers cannot afford high oil prices. As prices rise, Consumers will cut back and it will plunge the global economy back into recession.”
Well, that likely depends on how fast and far the prices go. Slow steady rise can be well tolerated pretty far. Energy is so cheap for what you get, after all.
Many other countries have a much better GDP/unit energy consumed than the USA, and with price pressure the USA could get there too. I suspect we could shed 10-20% of our oil consumption without big effect, particularly if we did it slowly. For example, it wouldn’t affect the GDP at all if we slowed down to max 60 mph. Painless saving of energy, if you choose good music.
It is the fast changes in price that really tend to hurt.
“I suspect we could shed 10-20% of our oil consumption without big effect, particularly if we did it slowly.”
It doesn’t work that way. Consumers cut back on spending, from eating out, going on vacations. They loss confidence and delay major purchases like new cars, homes, etc.
Most of the population commute to work well below 60 mph. Traffic usually limits speeds to 40 mph or less during commuting hours.
To understand how high oil prices affect the economy just research the events around 2007/2008. Schools & business were planning to reduce work & school days to 3 or 4 days a week. Thieves were draining fuel from parked trucks and cars. The higher oil prices caused food prices to soar, which lead to the arab spring in Africa & the middle east. Europe had frequent riots. Airlines & shipping companies impose fuel surcharges. People homes had utilities shutoff. since they could afford their energy bills.
Funny how quickly people forget the aftermath of high energy prices. Doesn’t anyone read or study economics?
Funny how quickly people forget the aftermath of high energy prices. Doesn’t anyone read or study economics?
LOL! Given that this is a comments thread on a post from Dr. Minqi Li, professor
Department of Economics, University of Utah, I think at least some of the people commenting might have actually read it!
But maybe more people should read and study ecology instead! Then they might understand that the ‘economy’ is actually a subsidiary of Ecosystems Inc.
And if they read and studied physics and chemistry they might also understand that fossil fuels are not synonymous with energy.
They might even understand that combusting fossil fuels to produce heat energy, is a very dirty and inefficient process and it produces CO2 which when emitted into the atmosphere changes the climate and causes floods and droughts which cause crops to fail and therefore cause food prices to soar, which lead to the arab spring in Africa & the middle east and other places.
Who’d thunk it?
Fred, wouldn’t you say as well that both Economics Inc and Ecology Inc are subsidiaries of Entropy Corp?
Michael B,
Entropy Corp
Sure! That would fall under the Venn diagram of the intersection between Ecology, Chemistry and Physics and perhaps an approximation of a circular, synergistic, non linear biophysical economic model.
http://www.uni-kiel.de/ecology/users/fmueller/salzau2006/ea_presentations/Data/2006-07-05_-_Thermodynamics_II.pdf
Ecosystem Thermodynamics
Presentation given in the course of the
Master’s Programme
Environmental Management
– Module 2.1.1 “Ecosystem Analysis” –
You can also Google: Kate Raworth’s, Donut Economics, if interested in an example of that.
Cheers!
Tech guy- one way or another people will have to get used to living with less oil. If it needs a depression to make the adjustment, so be it. If it happens gradually, and with strong attempts at adaptation, maybe it will less painful.
I certainly wouldn’t want to have a livelihood that was dependent on discretionary energy use by average income people. Thats a recipe for painful downsizing.
Fred Wrote:
“CO2 which when emitted into the atmosphere changes the climate and causes floods and droughts which cause crops to fail and therefore cause food prices to soar”
Thats not it, since food prices fell when oil prices fell. Petrochemicals are used to fertilize land, pesticides, fungicides. Fuel is needed to irrigate crops (pumps), harvest crops & transport it to markets.
In the poor countries, they got out-priced by the wealthier nations, so they didn’t get the fuel they needed to support their agracultural needs. Also wealther nations turned food in to fuel (ie ethanol) so there was less surplus grain getting exported to the poorer nations.
None of this had anything to do with climate change. But Fred, you only have your climate change “hammer” so every problem (nail) is a result of climate change. I presume when you stub your toe you blame climate change.
When Oil becomes expensive, People will resort to cutting down all of the trees. Consider that in Brazil they destroy the rain forest to make way for sugar cane to produce ethanol fuel for there cars. When the soil is exhausted of nuetrients they move to another section of rain forest. Thus increasing CO2 emissions as well as destroying a valuable CO2 sink. The real elephant in the room is over population. The global environment will not improve once Oil supplies are constrained. They get much much worse.
90%+ of the global population lives in poverty and don’t give a rats ass about the environment. They do what every they need to get by. Environment degradation will accelerate once Oil production begins to decline, as people find alternative ways to get by
The destruction won’t be limited to the third world. I recall the EU made plans to tap undersea coal reserves by igniting them to produce coal gas, when Oil was expensive back in 2007-2008.
Techguy wrote:
None of this had anything to do with climate change. But Fred, you only have your climate change “hammer” so every problem (nail) is a result of climate change. I presume when you stub your toe you blame climate change.
Not going to get into a long dissertation here about causes and effects of climate change. I don’t traffic in simplistic one trick pony views. suffice it to say you are wrong. If you care to discuss this in detail I’ll be happy to address it point by point over on the non petroleum thread.
When Oil becomes expensive, People will resort to cutting down all of the trees. Consider that in Brazil they destroy the rain forest to make way for sugar cane to produce ethanol fuel for there cars. When the soil is exhausted of nuetrients they move to another section of rain forest. Thus increasing CO2 emissions as well as destroying a valuable CO2 sink.
Again you are wrong on so many levels here it is difficult to know where to start! Suffice it to say,
that I’m Brazilian by birth with a background in Biosciences and first hand knowledge about the Amazonian deforestation and sugarcane agricultural practices in Brazil I also know about the Brazilian Ethanol program, Ironically I owned a made in Brazil 100% ethanol powered VW back in the early 80s while working as a subcontractor for Petrobras, I’m also well versed in Brazilian politics and culture. Sugarcane is ill suited to the climate and the soils of the Amazon it is not a main driver of Amazonian deforestation.
To be clear, I’m not for a moment suggesting that deforestation is not a major problem in Brazil, it is! But it has other causes.
Sugarcane is mostly produced in southern Brazil in drier climates.
Maybe watch this 20 minute video on how things are changing in Brazil with regards agricultural practices in general and sugarcane production specifically.
https://www.youtube.com/watch?v=G-pr0cYzuDQ
The real elephant in the room is over population. The global environment will not improve once Oil supplies are constrained. They get much much worse.
On the population point we can agree! Though things will get worse with or without constraints on oil supplies. Another dissertation needed on this point alone.
90%+ of the global population lives in poverty and don’t give a rats ass about the environment. They do what every they need to get by. Environment degradation will accelerate once Oil production begins to decline, as people find alternative ways to get by
Wrong again! The problem is wealthy nations and the high consumption patterns that they take for granted. BAU is not sustainable. To blame the less fortunate for the outsourcing of the problems of the rich is unconscionable to say the least!
Again I don’t want to get bogged down in a long discussion here on topics better suited to the non petroleum thread but would be happy to discuss this in more detail there, if you should be so inclined.
Cheers!
“Brazil senate considers lifting ban on sugarcane production in Amazon”
https://www.theguardian.com/world/2018/mar/26/brazil-senate-considers-lifting-ban-on-sugarcane-production-in-amazon
“Rainforest rapidly cleared for sugarcane in Bolivia”
https://www.google.com/url?url=https://news.mongabay.com/2016/10/exclusive-rainforest-rapidly-cleared-for-sugarcane-in-bolivia/&rct=j&q=&esrc=s&sa=U&ved=0ahUKEwi5wP-h3sPcAhVMKqwKHe9pDtwQFggcMAE&usg=AOvVaw3gr-owfpnbdJL5Ff83RHZa
“Sugar cane, Palm oil, and Biofuels in the Amazon”
https://globalforestatlas.yale.edu/amazon/land-use-and-agriculture/biofuels
[wile sugar cane is mostly grown outside of the Amazon, some groups allege that this cultivation displaces cattle ranching, encouraging deforestation in the Amazon.]
[Soy: The other biofuel crop fueling deforestation. include Brazil]
https://www.nytimes.com/2017/02/24/business/energy-environment/deforestation-brazil-bolivia-south-america.html
If not the amazon, then in indonesia, australia, etc.
https://news.mongabay.com/2018/01/biofuel-boost-threatens-even-greater-deforestation-in-indonesia-malaysia-study/
You are a pain in the ass. You literately hang on to every word and declare it totally wrong unless the details down to 15 decimal places. Bottom line: biofuels have caused deforestation worldwide and will continue to do so as the cost of oil rises.
You still failed to disprove anything I’ve said. You just nitpick at the details and declare I am wrong, Yet provided zero evidence that food shortages that triggered riots were caused by Climate change. Did Climate change suddenly reverse, causing food prices to decrease? If climate change is to blame why aren’t the riots worse today?
Or perhaps the real reason for falling food prices was the collapse in energy prices?
Again You wield your “Climate change Hammer” for all problems. When your argument is weak, you nitpick on the details using misdirection to change the argument. What are you, a 10 year old man-child?
Seriously?!
Yes, there is sugarcane in the Amazon region but it is NOT a MAJOR driver of Amazonian deforfestation! Have you ever been to the Brazilian Amazon?!
Just about everything you have put forth are basically cherry picked strawman arguments!
Since the best you have been able to come up with is a personal insult to me, I conclude you are not all that interested in a serious discussion about facts that contradict your world view!
You might want to start by reading this paper in the Journal of Geophysical Research:
https://agupubs.onlinelibrary.wiley.com/doi/full/10.1002/2015JD023929
Spatiotemporal drought variability in the Mediterranean over the last 900 years
If you care to prove me wrong than please respond under my latest comment in the non petroleum thread.
http://peakoilbarrel.com/open-thread-july-26-2018/#comment-646883
If not, that’s fine too. And in that case we can consider this discussion over.
Techguy,
My model for the Permian assumes new well EUR gradually decreases starting in Jan 2019 which accounts for sweet spots being limited. The technically revoverable resource in the Permian is probably about 35 Gb based on USGS estimates, cumulative production, reserves, and areas not yet evaluated by the USGS (I assume about 8 Gb from those sub-basins), which is roughly 3 times more than the Bakken, the new well EUR is similar to the Bakken, many estimates for the Bakken assume about 40,000 total wells can be drilled, so perhaps about 120,000 wells in the Permian if oil prices are high enough to allow all of the TRR to be extracted (ERR is likely to be a little lower than TRR).
Using a price scenario similar to the EIA’s AEO 2018 reference case, the Permian is likely to be profitable and debt will be repaid, based on current costs and tax rates.
Also keep in mind that as the World economy continues to grow (in constant dollars) it will be able to handle higher oil prices.
In 2012, the World spent about 4.8% of GDP on C+C output, using IMF estimates for GDP growth through 2022, if the World spends 4.8% of World real GDP on oil and output is 85 Mb/d (my medium scenario estimate) then the oil price would be $142/b in 2017 $.
In 2012 this was not a problem, and it may not be a problem in 2022, though oil prices probably won’t be that high, my guess is about $110/b in 2022 or about 3.7% of World real GDP, at 2018 World GDP estimate by IMF, 3.7% spent on 82 Mb/d of oil would occur if average oil prices were $101/b.
I am confident that $100/b oil price level is not likely to be a problem for the World economy in 2018.
A gradually rising oil price from $75/b (2017$) today to $120/b in 2017$ by 2025 can probably be handled by the World economy without major problems. This is about a $5.62/b increase in oil price per year if the increase in oil price follows a simple linear relationship.
Not 2030 Dennis. Try 2020. Perhaps even 2019 for a US peak.
The shale guys were all, to a man, the worst liars that ever beset humanity. As I said earlier, they would tell a lie to their own mother on her deathbed if they thought it would gain them a nickle.
These shale people are horrifically in debt, to the tune of $350 billion. The oil price, no matter how high it gets, can save them. The hundreds of 2017 shale bankruptcies will continue apace going forward.
Mike,
I have done an analysis of the Permian basin that suggests rising oil prices (to 110/b by 2023) will be enough to allow debt to be paid off and allow a substantial annual ROI on the order of 15% from 2018 to 2040 for the tight oil industry operating in the Permian basin as a whole.
In addition, reasonable assumptions for the rate of drilling in the major tight oil plays (Bakken, Eagle Ford, and Permian basin), suggests a peak in tight oil output between 2023 and 2025 (tight oil output is relatively flat over that period so the peak is most likely to fall in that window).
The peak in World output is most likely between 2023 to 2027 for similar reasons, if my most likely estimate for World C+C URR (3400 Gb or 466 million tonnes).
“I have done an analysis of the Permian basin that suggests rising oil prices (to 110/b by 2023) will be enough to allow debt to be paid off”
Did you factor in higher fuel prices & material costs with those rising oil prices? It takes a lot of diesel to transport water, sand, steel, concrete, and Oil. The costs of the fuel & construction materials will also increase. Its likely interest rates will also increase. Debt on Shale starts coming due next year. Also consider that Shale Oil always sells at a significant discount.
Shale drillers didn’t make any money when Oil was at $120/bbl just a few years ago, but did go on a massive borrowing binge.
I doubt $110/bbl oil is sustainable. People and business are much deeper in debt & continue to pile on more debt every day. For commodities this is deflationary. I suppose Central banks can just print money, but that only results in currency devaluation.
Of course, one can never underestimate the stupidity of investors. Perhaps they’ll double down on there bets and loan even more money to the shale drillers.
Tech guy,
So far cost per foot has not increased. I do the calculations in real dollars, so inflation is assumed.
Even with high oil prices inflation remained fairly tame from 2011 to 2014. The oil input into the economy is small (3 to 5% of real GDP), it is not likely to be a huge factor in increasing costs.
The debt can be serviced, it is not a problem, as oil prices increase, it will be even less of a problem.
As an industry ramps up, it takes on debt, as the industry (tight oil in this case) matures and grows more slowly the debt gradually gets paid back.
Also as the industry matures it finds better ways of doing things and real costs tend to decrease rather than increase, I have made the conservative assumption that well costs do not decrease, but remain fixed in real terms.
One could think of it in terms of rising costs for the reasons you state being offset by improved operational efficiency so that overall there is no change. In any case it is the assumption I make, real well cost is unchanged from 2018 forward.
Mike Sutherland,
If you look my comment you will see I said peak for tight oil is 2023 to 2025, then gradually increasing decline rates from 2025 to 2030 and by 2030 the decline will be steep 3% or more.
Nice report. Production decline is a short time away if we don’t keep drilling.
Speaking of legacy wells, the huge number of abandoned wells from the past is leaving us a legacy of leakage. The even bigger number of recent wells will continue that legacy.
https://arstechnica.com/science/2016/11/abandoned-oil-and-gas-wells-are-still-leaking-methane/
150 year old wells in the eastern USA could indeed leak methane. But I would not rely much on Arstechnica, it’s a blog run by a guy with a liberal arts degree very well crafted to be a cheering section for renewables. It may even be subsidized by Yingli Green, a Chinese solar panel maker.
Are you seriously claiming that a peer reviewed scientific paper, in the ‘Proceedings of The National Academy of Sciences of The United States of America’ is somehow untrustworthy because it’s conclusions were mentioned by Ars Technica?!
They also provide a link to the paper:
http://www.pnas.org/content/113/48/13636
Identification and characterization of high methane-emitting abandoned oil and gas wells
Abstract
Recent measurements of methane emissions from abandoned oil/gas wells show that these wells can be a substantial source of methane to the atmosphere, particularly from a small proportion of high-emitting wells. However, identifying high emitters remains a challenge. We couple 163 well measurements of methane flow rates; ethane, propane, and n-butane concentrations; isotopes of methane; and noble gas concentrations from 88 wells in Pennsylvania with synthesized data from historical documents, field investigations, and state databases. Using our databases, we (i) improve estimates of the number of abandoned wells in Pennsylvania; (ii) characterize key attributes that accompany high emitters, including depth, type, plugging status, and coal area designation; and (iii) estimate attribute-specific and overall methane emissions from abandoned wells. High emitters are best predicted as unplugged gas wells and plugged/vented gas wells in coal areas and appear to be unrelated to the presence of underground natural gas storage areas or unconventional oil/gas production. Repeat measurements over 2 years show that flow rates of high emitters are sustained through time. Our attribute-based methane emission data and our comprehensive estimate of 470,000–750,000 abandoned wells in Pennsylvania result in estimated state-wide emissions of 0.04–0.07 Mt (1012 g) CH4 per year. This estimate represents 5–8% of annual anthropogenic methane emissions in Pennsylvania. Our methodology combining new field measurements with data mining of previously unavailable well attributes and numbers of wells can be used to improve methane emission estimates and prioritize cost-effective mitigation strategies for Pennsylvania and beyond.
I am an academy member. I also know how to search for methane leaks. And I’m aware the academy publishes papers which lack the quality one would like to see. But if you want credibility, I would skip Arstechnica and link directly to the paper.
The Arstechnica editor has an axe to grind, publishes a bunch of garbage, therefore I never pay attention to it. Regarding the paper itself, it’s not representative of what goes on in say Texas. There are areas in Texas (say Spindletop) where gas leaks should be present from the wells drilled with cable tools in the old days. But a better sense for what goes on now is gained from looking at wells drilled and abandoned in Texas and Louisiana in the last 40 years.
Regarding Pennsylvania methane leaks, in the overall picture they are meaningless. There are coal mining regions in India and China which can be seen as very large hot spots from satellites.
A better link can be found here: https://earthobservatory.nasa.gov/images/91564/what-is-behind-rising-levels-of-methane-in-the-atmosphere
And then you have to ask yourself what happened in 2006 to change the way methane was rising? Was it the climate? Or was it South Dakota?
I did link directly to the paper!
As did ArsTechnica.
Turn around fast, danger rabbit hole ahead!
Hippity hoppity! Off to a tea party with the Mad Hatter and Alice! As in A Large Ion Collider Experiment at the LHC. Much more fun than dealing with the crippled egos of idealogues.
Cheers!
https://www.edf.org/media/new-oil-and-gas-study-shows-once-again-industry-severely-underreporting-methane-emissions
If the wells are plugged, the concrete eventually fails (30 years) so we have an ongoing source of methane that could last for centuries. Millions of wells across the US, much more across the world.
https://www.scientificamerican.com/article/abandoned-wells-leak-powerful-greenhouse-gas/
And guess what, those ideas of storing CO2 underground, well now we have millions of pathways for the CO2 to escape, so actual sites would be few and far between.
Ethan Davis, an energy analyst and consultant with the Union of Concerned Scientists who looked over the new analysis, concurred, noting that even if the 3.2 percent leakage rate was accurate, it is above what some studies have shown would be necessary to realize any climate benefit from the coal-to-natural-gas switch.
https://www.forbes.com/sites/tomzeller/2015/04/21/natural-gas-leaks-a-30-billion-opportunity-and-global-warming-menace/#6e38cb551632
The original Canadian study I read a few years ago has disappeared from the internet. It showed the long term potential leakage of well systems.
All this Hubbertian analysis is useful to set a ceiling on production, but the world’s economy runs on making a profit and so producers have a minimum price they must receive, while the end consumers have a maximum price they can afford to pay.
In mid-2008 the effect of a 72% price rise in 18 months caused a $1.75 trillion extra cost on OECD oil imports and the world economy crashed. Recovery required the USG to guarantee loans to frackers to get the production numbers up. I am not saying that they won’t try that again, but this can only go so far. Surely next time this happens, no one will be able to avoid the obvious conclusion that there is no future profit in oil production, and the oil industry will have its share prices downgraded, reducing the collateral for loans, whereupon they will go out of business in a puff of smoke.
This will happen long before any URR impacts, so I wonder at how much this analysis is worth.
USG guaranteed loans to frackers???? Interest rates for everyone was low then, but I don’t remember reading about any guarantees. Drilling horizontals is a little past SBA stuff.
If the “oil industry” means the IOCs then they are a minor player now. The NOCs dominate the reserves and production, of course they all seem to be having money issues as well but maybe they manifest in a slightly different way – i.e riots, uprisings and infrastructure collapse.
It’s already noticeable that many of the big companies are switching to share buy backs (Total, Shell, Anadarko) and less development spending even as the price has been rising. The one which has switched the other way is ExxonMobil, and not uncoincidentally it is the only one with really good recent discoveries. That straight line H/L for the rest of the world is just the tail run out on existing discoveries, most of which are also already developed and wouldn’t be taken off line even with bankruptcies for the operators. If only as chemical feedstock oil is way better in almost every way than anything that could be made from water/CO2/renewable energy so if civilisation lasts long enough most of it will be used.
Dave Kimble,
The Global Financial Crisis arose due to poor regulation of the financial industry in the US and Europe, this rise in oil prices was likely a minor factor in the grand scheme.
This view is supported by the fact that World oil prices were high from 2011 to 2014 (average about $114/b in 2017$) with growth in World real GDP (at market exchange rates) over that period of 2 to 3%.
At some point (2030 to 2040) cheaper alternative transport may bring oil prices down so that all of the technically recoverable oil may not be produced due to falling oil prices.
Minqi’s model does not account for this possibility and of course not all agree when this will occur (many believe it will be after 2050, some think it will be never).
Forcing a logistic curve on some of those production histories might give some big errors, though maybe they cancel out overall. Hubbert said himself that H/L wouldn’t work well on production that had been artificially constrained by a cartel (e.g. OPEC for Saudi, Kuwait, UAE, Iran and Iraq) or environmental moratoria (e.g. some US and Canada oil). For oil sands they tend to be built on 50 year project lives, with steady production and a fast fall off rather than a traditional decline curve. About 50 mmbbls of reserve is already tied into operating, steady production. Future developments will be similarly constrained with the additional limit from environmental objectives to both the extraction and pipelines. Logistics curves might still come close if the reserve estimates are good, but that is also the biggest unknown as other comments have said.
Projections are not meant to be predictions. Even EIA or IEA say that. But they are always useful to illustrate given certain assumptions, what will or what are likely to happen.
That has been said, given our understanding of the inherent limitations of projections/data, a careful and cautious application of these projections does provide us some idea regarding the likely range of future development. For example, the projection for the US oil used in this report is likely to be too optimistic especially for years after 2025, as many have pointed out. That will reinforce the case for a global peak oil before 2025
In addition to production, I think the consumption data in the report also provides some interesting information. I wonder if someone cares to comment about that.
Well, obviously consumption can’t be over production for any great amount, or we won’t have inventory. Peak production precedes any mythical peak demand. Consumption mostly follows production is my guess. At probably a much higher price than today.
Minqi,
A much better way to do it is to look at real GDP vs C+C output. The relationship is statistically much stronger.
Also better to use more years of data such as 1982 to 2017.
Do the tstats on the regression really hold up over a longer period? They should be 2 or higher for intercept and slope.
The World has been using less and less oil per unit of real gdp. As oil prices increase this reduction in oil needed for GDP increases is likely to accelerate.
So in short I doubt the assumption of a linear realation ship between oil consumption growth and GDP growth is a good one.
I have said this before and we just disagree on the best approach.
I use 1991-2017 because the world bank PPP real GDP starts in 1990
If you use real GDP in constant US dollar, the correlations may be stronger. But world GDP in purchasing power parity is the preferred measurement for IMF et al these days
Minqi,
Seems there is not universal agreement that PPP is best, the measure seems pretty nebulous, I prefer market exchange rates.
IMF has PPP data back to 1980. So we can easily do the same using PPP.
If we use market exchange rates we can look at the relationship back to 1975.
http://www.imf.org/external/pubs/ft/weo/2017/02/weodata/weoreptc.aspx?sy=1980&ey=2017&scsm=1&ssd=1&sort=country&ds=.&br=1&c=001&s=NGDP_RPCH%2CPPPGDP&grp=1&a=1&pr.x=67&pr.y=9
link below to spreadsheet with PPP data for World real GDP (2011 international$) from 1980 to 2017.
https://drive.google.com/file/d/10I_s8f22fcnIZvpJr0I-iuB-j_0H3TA5/view?usp=sharing
It looks like there may be a break in about 2004 (change in slope around 70,000), but the regression (ignoring the break) has tstats of 48 for the y-intercept and 25 for the slope. Adjusted R squared is 0.945.
Clearly though there is a change in slope around 70k.
Hi Dennis, thanks for the data.
What you did is level-to-level correlation and my graph is about growth rate-to-growth rate correlation
Level correlations are normally always much higher than growth correlations (I also get very high R-square for those per capita GDP/per capita energy consumption regression)
Growth rates may not be related linearly, R squared is not really the important thing it is the t-stat that is more important.
Even looking at the level, there is a definite shift around 2004 where the slope drops by a factor of 2 and when a regression is done from 1982 to 2004 and then from 2005 to 2017, both regressions are significant at the 95% confidence interval with no overlap of y- intercept or slope over the 95% confidence intervals for each separate regression.
In short, it is unlikely that the relationship between the growth rates is fixed over the 1983 to 2017 period the relationship is not statistically significant, also 2009 is clearly an outlier,the only year from 1980 to 2017 where World real economic growth was negative (PPP measure), that point should probably be dropped. When that is done the statistics are worse.
I agree the energy/capita vs GDP/capita relationship is very strong, as is energy vs GDP also a strong relationship.
Oil can be substituted as prices rise with other sources of energy (natural gas, solar, wind, and nuclear). So we would expect the relationship between real GDP and oil consumption to change over time.
Note that unlike BP, I do not consider NGL to be “oil”, just as I do not consider natural gas to be “oil”. I use EIA C+C data.
Growth rates regressions and level regression serve different purposes. Actually, for most time series economics studies, they prefer first differenced (some times second order/third order differences) regressions.
In this case, I simply want to interpret them in term of growth rates. So for example the trend line in Figure 1 allows me to say what is the expected rate of change of oil consumption given zero economic growth rate.
I am also attaching a graph, using the same underlying data as I used for figure 1. But in this case, it’s a log linear regression on the two variables. As expected, R-square is very high.
Minqi,
Why log-linear? In this case you are not doing a time series analysis. Just looking at growth rates for two variables, Real GDP and oil consumption.
I agree the log linear relationship is very strong, I used C+C vs IMF PPP data from 1982 to 2017 and the tstats are above 30 for both intercept and slope.
Hi Dennis, one “benefit” using PPP is that you get a somewhat higher energy efficiency growth rate than using market exchange rate, because the world GDP measured by PPP grows more rapidly.
I looked at those IMF PPP data, they do not exactly match those from World Bank although they are similar. By using the world GDP from world bank, that allows me to match those national GDP data. By excluding the 1980s, the average energy efficiency growth rate is also slightly higher. The average energy efficiency growth rate for the 1980s was 1.3 percent and the average for 1990-2017 is 1.5 percent.
An info about the cost of permian wells:
https://www.zerohedge.com/news/2018-07-26/top-us-shale-oil-fields-decline-rate-reaches-new-record-half-million-barrels-day
“Pioneer spent $818 million on capital expenditures (CapEx) for additions to oil and gas properties (drilling and completion costs) during Q1 2018, brought on 63 horizontal wells in the Permian, and only added 9,000 barrels per day of oil equivalent over the previous quarter”
So it’s round about 13 million $ per well, not 7 million.
The number of wells brought on isn’t proportional to wells drilled. And the CAPEX isn’t proportional to wells drilled. Therefore it’s hard to derive a per well cost from such figures.
Yeah, there a lot of DUCs, and you have to consider that Pioneer lays out some bucks for its gathering system and gas processing plant in the Permian. Hard to isolate per well from total capex figures.
At least it tells, why the calculation
(Sale of oil) – well cost – variable cost per barrel = profit
does not work that good – there are lots of hidden costs even under CAPEX, that are almost as high as completion costs when these 7 million$ / well are right.
And I think these cost are not one time cost just only in this quarter – there is alway a pipeline to build, a convertert to install, a gravel road to the site to build and so on.
I use 9.5 million per well for full cycle cost in the Permian, based on comments by Mike Shellman and well cost analysis by IHS
Rystad has first half figures for discoveries a bit better than last year, though more on the gas side than oil, but there was a billion barrel Equinor discovery in Brazil this week that will make things look better. I thought things were worse, partly because I assumed the Guyana discoveries would count as appraisals and be back dated against 2016 and 2017, but it looks like they are new fields. Overall though it still shows a big drop over the past few years.
https://www.rystadenergy.com/newsevents/news/press-releases/2018-conventional-discovered-resources-on-track-increase/
Oilprice.com is presenting the same data with a lot more hype and celebration.
A “remarkable” recovery from “abnormally” low levels – complete bollocks, and pretty close to self-contadictory. Everything is, and always will be, awesome in the oilprice universe, if not they’d lose their revenue stream.
George, I admit I had to rub my eyes when I read that op.com version.
Loathsome Nonsense.
Yeah, because they are mostly deep sea stuff, we should expect to see that pumping by next month??
How much oil? Looks like mostly gas discoveries for the last 5 years.
Baker Hughes rig count up two for USA, twelve for Canada. GoM down one oil and one gas.
http://phx.corporate-ir.net/phoenix.zhtml?c=79687&p=irol-rigcountsoverview
My estimate for Texas production in May is 4280 kbd. The second month production reports and second month pending data files support both Dean’s and my estimate that April was closer to 4150k than the 4217k that EIA has posted for monthlies. Not significant, but I think the production was flat to down from March to April, not up. Mine shows an increase of about 130k for May from April from mine, and Dean’s estimate. Dean is way over mine for May. He has about 4369, or almost 90k more than mine. I take the difference between my original count of the first month’s pending and production data and the second month, and use that as the amount to add on to the original and pending for the current month. That is the way I estimate production from actual RRC data.
Behind a paywall but here is the gist of the article
WSJ: As Oil Industry Recovers From a Glut, a Supply Crunch Might Be Looming
Dearth of investments in oil projects mean a spike in prices above $100 could be on the horizon
Crude across the globe is being used up faster than it is being replaced, raising the prospect of even higher oil prices in the coming years.
The world isn’t running out of oil. Rather, energy companies and petro-states—burned by 2014’s price collapse—are spending less on new projects, even though oil prices have more than doubled since 2016. That has sparked concerns among some industry watchers of a massive price spike that could hurt businesses and consumers.
The oil industry needs to replace 33 billion barrels of crude every year to satisfy anticipated demand growth, particularly as developing countries like China and India are consuming more oil. This year, new investments are set to account for an increase of just 20 billion barrels, according to data from Rystad Energy.
The industry’s average decline rate—the speed at which output falls without field maintenance or new drilling—was 6.3% in 2016 and 5.7% last year, the Norway-based consultancy said. In the four years before the crash, that decline rate was 3.9%.
Any shortfall in supply could push prices higher, similar to when oil hit nearly $150 a barrel in 2008, some industry participants say.
“The years of underinvestment are setting the scene for a supply crunch,” said Virendra Chauhan, an oil industry analyst at consultancy Energy Aspects. He believes a production deficit could come as soon as the end of next year, potentially pushing oil above $100 a barrel.
SNIP
In parts of Brazil and Norway, decline rates are already above 10-15%, Energy Aspects’ Mr. Chauhan said. Output from Venezuela’s aging fields fell by more than 700,000 barrels a day over the past year, according to the IEA. In June, Angola’s output hit a 12-year low, while Mexico’s production is down nearly 300,000 barrels a day since the middle of 2016, despite efforts to open up the industry and reverse declines, the IEA said.
“Nobody is really stepping in,” said Doug King, chief investment officer of the $140 million Merchant Commodity hedge fund. “People still got burned by the downturn.”
The unstated premise is, “Invest, and ye shall find.”
Hmmm.
“The oil industry needs to replace 33 billion barrels of crude every year to satisfy anticipated demand growth, ”
The phrasing is odd. “replace”. What does replace mean in the context of increased CONSUMPTION (not demand). I guess it means you have to discover that much or endure an annual decline in reserves, because 33B is global consumption. Not consumption growth. The reporter doesn’t understand the math.
Unaugmented field decline (we proposed a name for this . . . gross or net or something) 6.3% and then 5.7% the next year. How? As for it being so much higher than pre 2008 . . . shale?
” … a production deficit could come as soon as the end of next year.” – aren’t we already in deficit with stocks having fallen for a good few months now?
A new feature of the industry that I haven’t seen mentioned in any article yet is that there just isn’t the big backlog of attractive, investment ready projects there used to be. Lot’s got hoovered up in the febrile high price years, even some pretty marginal ones, and they haven’t been replaced due to discovery collapse. It’s noticeable that companies don’t seem to be positioning themselves as if they expect there to be a recovery for such projets – IOCs are localising, switching to share buy backs, concentrating on US tight oil, moving into gas (though that seems to have run out of steam as well); some NOCs seem completely lost as to what to do now with no new production in the pipeline.
The 20 Gb of development that has been approved will almost certainly contain a lot of short cycle projects, so the natural decline rates will be inevitably continuing to increase.
Another issue is going to be industry capacity for new developments even if there is something to develop. The “great crew change” that was expected a few years ago actually was just a mass crew retirement, without so many replacements required (so far anyway).
Awareness of the predicament is not going to come real soon. When it finally does, it will, no doubt, come as a result of a continuing decline in inventories vs the rah rah of EIA and the press. The US being the last place it will be apparent, because of the oil that is waiting to get exported, and can’t be used effectively by refineries here. I can’t help but wonder, that if we were able to seperate inventory count between oil waiting for export vs commercial inventories, what it would look like. The floodgates open in 2020 on that oil, which looks like good timing for the Permian.
What is the true full cycle cost of a barrel of oil? It should include exploration costs. It’s not $70 a barrel, obviously. No one has made enough additional bucks to cover sufficient exploration. If it’s there.
Expectations of the Permian are vastly overblown like they were in the Eagle Ford and Bakken. This is an old article, but still pertinent.
http://www.ogfj.com/articles/print/volume-14/issue-11/features/how-sustainable-is-permian-tight-oil-growth.html
The time is past when I can devote a lot of time to reading and commenting here, so I don’t know if somebody has posted this link already.
But it’s highly relevant to the overall discussion here.
https://foreignpolicy.com/2018/07/16/how-venezuela-struck-it-poor-oil-energy-chavez/
Excellent find, OFM. Thank you.
Peak Oil is not a phenomena that will have happen in one particular moment. It is really more of a phase, with many moments.
One of the early moments of this phase was in 2005, at the time of peak conventional oil production (and export?).
Another moment was in 2011- ” as Egypt transitioned from a net exporter to a net importer of energy, and oil prices peaked as a result”. The government was forced to cut subsidies on wheat and other basic products. Cuts in “energy subsidies is attributed to popular revolts against price hikes of subsidized goods in the past”.
We can find numerous such moments.
I declare one minor symbolic moment to be March 15, 2018- on this day StatOil announced a change of name, to “Equinor”. According to the company “The world is changing, and so is Statoil. The biggest transition our modern-day energy systems have ever seen is underway, and we aim to be at the forefront of this development. The name Equinor reflects ongoing changes … low carbon strategy.”
It has come up in this discussion that the EU might somehow be forced to buy more expensive natural gas from the US than Russia. But an article in the Wall Street Journal questions that, and also suggests US producers are more interested in selling to China anyway because China pays more.
“Russian gas is simply cheaper and U.S. exporters may not actually want to rush to Europe, given their gas fetches a higher price in Asia, driven by surging Chinese demand.”
“It has come up in this discussion that the EU might somehow be forced to buy more expensive natural gas from the US than Russia.”
That will not happen. How could the EU enforce this?
Australia is to be the source of China’s increased need for natural gas, not the US. Their shipping distance is less, their price will be lower.
But that doesn’t mean Europe will buy US gas instead of Russian gas. As I recall, you have said the US will essentially “force” Europe to buy higher priced gas from us. But not everyone anticipates that scenario.
The point is price need not determine the transaction.
If Russia is painted sufficiently evil, then it won’t get the business. I’ve never seen a study, but I suspect that through the history of mankind more transactions have taken place with something other than price defining the configuration of the transaction than otherwise. No reason for this to be different.
About 10 years ago, GAZPROM was supplying Natural Gas to the Ukraine at prices far below what that gas could have fetched from Europe. If price were definitive, that gas would have been shipped elsewhere and none would have gone to the Ukraine. They had their negotiating arguments, but as long as there was a pro Russian government in Kiev, Ukraine got a cut-rate price. And now they don’t
Has anyone noticed that NASA contracts with Soyuz launches to do crew turn over missions, and there’s no discussion of price.
The price, like most prices, is not determined by supply and demand.
I’m not sure the US can or will paint Russia as sufficiently evil to shift gas purchases from them to the US. This might be especially true if we alienate enough other countries that none of them wants to cut us any favors.
If Russia is painted sufficiently evil, then it won’t get the business.
Yeah, sure!
.
As long as the pipelines go through Ukraine, the Russinas have a simple problem, you may call it theft. This problem will disappear with NordStream 2.
Wood Mackenzie estimate for first half of 2018 discoveries is 3.9 Gboe, a bit less than the Rystad number (above) but I think Wood-Mac only tracks the top 50 or so companies, however they usually report bigger overall annual numbers than Rystad, so who knows.. A bit more gas than oil I think, and mostly ultra-deep, which might suggest onshore/shelf/shallow/deep aren’t attractive rather than that ultra-deep is really good. They indicate another 13 Gboe potential in the second half, which could mean as low as 2 Gboe discoveries given recent success rates, and that would give a total well down on last year which they gave as 12 Gboe (7 oil, 5 gas).
https://www.epmag.com/oil-majors-focus-deep-water-pays-1710831#p=full
Energy Secretary Rick Perry: ‘True energy independence is finally within our grasp’
” further natural gas development and production are prime examples of the success of President Donald Trump’s American energy dominance agenda.”
https://www.cnbc.com/2018/07/29/energy-secretary-perry-true-energy-independence-is-finally-within-ou.html
Amazing Stuff even if NG is never liquid at Room Temperature! Got PV for Critical Loads yet? Who Do you Call? These Masters of the Universe just might fix Energy as they did Libya and Health Care.
What he didn’t point out is how that natural gas has reduced interest in coal. But he did say this.
“Indeed, partly due to our natural gas boom, the United States has led the world in cutting energy-related carbon dioxide emissions, reducing them by nearly 14 percent – or 700 million metric tons – from 2005 to 2017.”
From what I heard, the last Energy dominance meeting was cut short, because they ran out of crayons.
https://www.houstonpublicmedia.org/articles/news/2018/07/30/297619/fracked-oil-wells-declining-faster-than-drillers-might-realize-report-says/amp/
Permian decline rates picking up, apparently.
Hi Dennis, in response to your question above.
A log-linear regressions allows one to say if, say, X rises by 1%, by what % Y will rise.
Another difference between linear and log-linear is that log-linear regression allows oil consumption to grow somewhat more slowly than GDP instead of imposing proportionate growth
Minqi,
I understand what log-linear is, I was looking for a theoretical justification for why we would expect such a relationship rather than a simple linear relationship. I agree however that the statistical relationship is very strong for the log-linear relationship, probably a more elegant solution than some arbitrary change in the linear relationship in 2004, though one could point to a rapid shift to higher oil prices that might have changed behavior.
Venezuela, fuel news
2018-07-30 (Argus Media) Vehicle owners without valid cards (A homeland identity card not the common national identity card) would have to pay higher fuel prices or could be denied fuel altogether, according to a senior official of the ruling socialist party (PSUV) familiar with the government’s still-evolving fuel control plans.
Energy ministry and government officials with direct knowledge of the matter tell Argus that the government plans to raise local gasoline and diesel prices to international levels in conjunction with a new national currency – called the sovereign bolivar – that will be launched on 20 August to replace the now worthless strong bolivar that was created in 2007 by late president Hugo Chavez.
PdV’s local refineries with a combined nameplate capacity of 1.3mn b/d “are almost shut down completely,” says a senior oil union official at PdV’s 940,000 CRP refining complex in Paraguaná. “Local gasoline consumption has dropped below 140,000 b/d, all of it imported mainly through PdV crude-for- fuel swaps with foreign suppliers.”
https://www.argusmedia.com/en/news/1725882-venezuela-to-direct-scarce-fuel-to-loyalists?backToResults=true
EIA 914 survey – US crude production falls to 10,442 kb/day in May from 10,472 kb/day in April (10,467 kb/day previously)
https://www.eia.gov/petroleum/production/#oil-tab
Federal Offshore Gulf of Mexico 1,507 down from 1,582
Texas 4,243 up from 4,223
New Mexico 651 up from 648
North Dakota 1,237 up from 1,212
The EIA 914 is below the EIA STEO (released July) by -331 kb/day, The STEO had May at 10,773
My estimate I posted for May above is 4280. I show it flat for April, and up some in May. Theirs shows it is up for April, and flat to down for May. Either way, it pretty flat since April. I wouldn’t expect much for June or July, either. Permian is on hiatus until the new pipelines, and EIA is way over on their STEOs and weeklies. GOM is down again for maintenance as George indicated. Add another 180k to GOM, and normal should be about 10,600k for US, which it will probably remain until late next year. Looks like the Permian is maxing out at around 500k growth until the new pipelines. Any significant increases in the Eagle Ford or Bakken would not show up until the second or third quarter of 2019, if it’s going to happen. My prediction, so far, is pretty close.
Think the analysts will catch on anytime soon?
The GOM seems to show a certain fatigue. Is this confirming what George Kaplan is saying all along?
Thanks, Dean
George said the decreases were for scheduled maintenance, but he can answer your question better than I can.
There’s a lot off for maintenance that should come back in June and July numbers, though June had some weather related outages. Overall though each month has decline of about 20 kbpd and the new wells aren’t enough to compensate, so there will be a declining trend at least until Appomattox starts next year (due towards year’s end but recent projects have often been early). That may provide a blip up if it ramps up quickly.
Maintenance time seems to be creeping up, whether planned or unplanned, so maybe there is a bit of fatigue. There are some ageing structures out there and maybe they didn’t get all the TLC they needed when money got tight.
Thanks!
Dean
US Ending Stocks – May
Crude Oil down -1.8 million barrels from April
Oil Products down -5.9 million barrels
Crude Oil & Oil Products -7.7 million barrels (This is shown on the chart)
SPR (not included) down -3.8 million barrels
Natural Gas(not included)(ethane, propane, butane) up +17.9 million barrels
Chart: https://pbs.twimg.com/media/DjdP39kW4AAEGfy.jpg
Total crude oil & products inventories are still up in May +5 million barrels from the end of 2017
https://pbs.twimg.com/media/DjdROkjW4AIeRDb.jpg
Yes, and the US is the ONLY country producing over a million barrels a day more than they did this time last year. It is fairly myopic to concentrate on US inventories to determine where the world is, but that’s what analysts do. Your posts on world inventories are quite informative.
2018 YTD +5 million barrels is the smallest inventory build for all these years
The trend over the last 4 years would suggest a large negative number next year and probably a large strategic reserve release starting sometime this and continuing until who knows? Yet the threat of economic downturn from a trade war and a weekly stock increase based on API survey seem to be bigger news and prices are down today.
I don’t know what is going on
API is reporting that crude oil stocks are much higher than the EIA is saying at the moment.
But weekly crude oil draws in Europe ARA -2.3 million barrels and Japan -6.1 million barrels.
The answer is probably going to show up in the change in net imports of crude which will be reflected in the EIA report this morning. Contrary to popular opinion, we are a significant net importer of oil.
Ok, EIA weekly is out, and shows a smaller increase of 3.8 million barrels. Imports remained about the same, but there was a 1.3 million barrel a day drop in exports, which will vary from week to week, depending on multiple factors. If exports would have remained the same as the previous week, then there would have been a draw of about 5 million, which would be in line with the most recent months.
Be interesting to see how long it will take the anal yts to catch on? US production not matching up to predictions, and dropping world inventories should be a clue, but I don’t get the big bucks, so how should I know?
Include SPR decrease, and there is a draw, and not a build.
There are a few people here who think that producing electric cars will mitigate Peak Oil.
If we look at Global oil consumption by sector.
https://www.globalpetrolprices.com/articles/39/
We can see that cars form only a fraction of global oil consumption.
Shipping today uses around 9 million barrels per day, this is an old article but not much has changed. Most ship built today burn oil and it would take decades to replace the 55,000 merchant ships with liquefied natural gas.
https://newatlas.com/shipping-pollution/11526/
The aviation industry cannot do without oil, biofuels simply rob poor people of food and riots will end most of it’s production.
When peak oil occurs, in order for industry to have enough oil, transportation must make do with less.
Cars use around 45 million barrels per day. How many electric cars would have to be produced to reduce consumption enough so peak oil would not lead to crippling oil prices.
Globally 100 million vehicles will be sold and 50 million scrapped.
Of the 100 million at least 50 million need to be electric vehicles just to keep consumption of private transportation the same. In order to reduce consumption, to allow all the other uses of oil time to change, that number needs to be 60 to 70 million. This year globally 2 million will be sold. If peak oil happens around 2022-2025 we are obviously going to miss the mark by a long way.
High oil prices will hit everyone and the weakest will go under.
Peter, thats a pretty good explanation of why you should certainly want to have a plugin hybrid or full electric vehicle. Then you can get around with affordable miles after the peak. The market choices on these vehicles will be mushrooming over the next 5 years.
I’m not saying it will put a big dent on oil demand, but the more people that have them the more resilient they will be, at least when it comes to mileage costs.
btw- check out what this company is doing
https://nikolamotor.com/press_releases/nel-asa-awarded-multi-billion-nok-electrolyzer-and-fueling-station-contract-by-nikola-47
Hickory
Hydrogen fuel cells have many advantages over battery cars. Hydrogen can be produced from excess wind and solar and used for cars, lorries and heating.
But time is really short
1900 NEW eBuses in China a week frees up diesel by the tankers. BYD buses uses LFP cells. Cobalt free. Non Toxic.
Less data from China
2018 July (IEA OMR) In April, China stopped reporting detailed trade statistics and since then we have had to estimate the level of imports of some products (in particular naphtha and LPG) based on a three month average. In May, the reporting by China OGP of another crucial component, stocks data, stopped.
Canada, Alberta AER, Total Crude Oil and Equivalent Production at 3.39 million barrels per day in June, almost flat +0.015 month/month
(2017 average 3.18 million b/day)(2017 June 3.0 million b/day)
https://pbs.twimg.com/media/Djg-DfQWsAEater.jpg
Canada, Alberta AER, crude oil closing stocks at 70.4 million barrels in June, down -2 month/month
https://pbs.twimg.com/media/Djg-RzAWwAAax0B.jpg
EIA U.S. Petroleum Balance Sheet
Crude oil exports at 1,310 kb/day (lower by -1,373 from last week)
Products Supplied (implied demand) was lower too
EIA pdf file: http://ir.eia.gov/wpsr/overview.pdf
Saxo Bank chart summary https://pbs.twimg.com/media/DjhYOIQXsAAbz9G.jpg
2 charts by TFA, y-o-y inventories https://pbs.twimg.com/media/DjhWieQX0AAvyvm.jpg
https://pbs.twimg.com/media/DjhW3kZXsAADEVt.jpg
Minqi,
Thank you very much for this article.
Your article states Kjell Aleklett’s book “Peeking at Peak Oil” gives a URR for Saudi Arabia at 390 billion barrels.
I double checked Kjell’s book. It states Saudi Arabia’s “original proven reserves” is 360 billion barrels.
He also estimated peak year in 2028 based on 360 billion barrels whereas your article states 2030.
This is a minor point since you used a different URR but I mention it for accuracy.