The OPEC Monthly Oil Market Report for January 2020 was published this past week. The last month reported in each of the charts that follow is January 2021 and output reported for OPEC nations is crude oil output in thousands of barrels per day (kb/d).
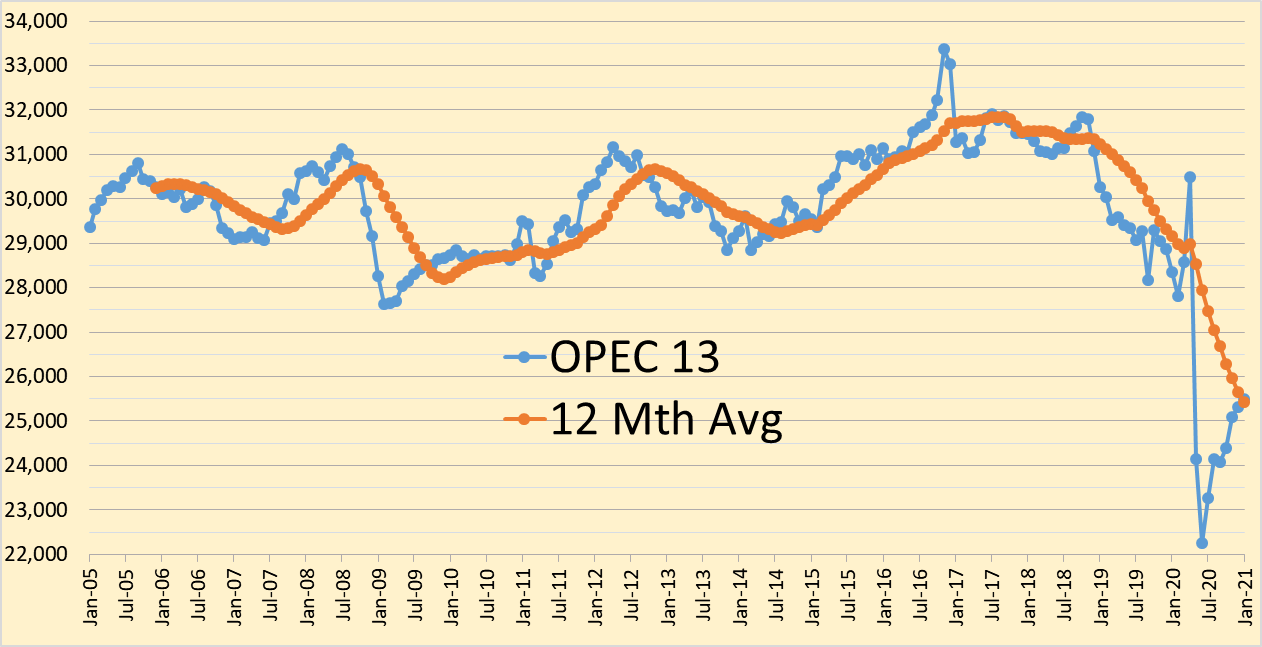
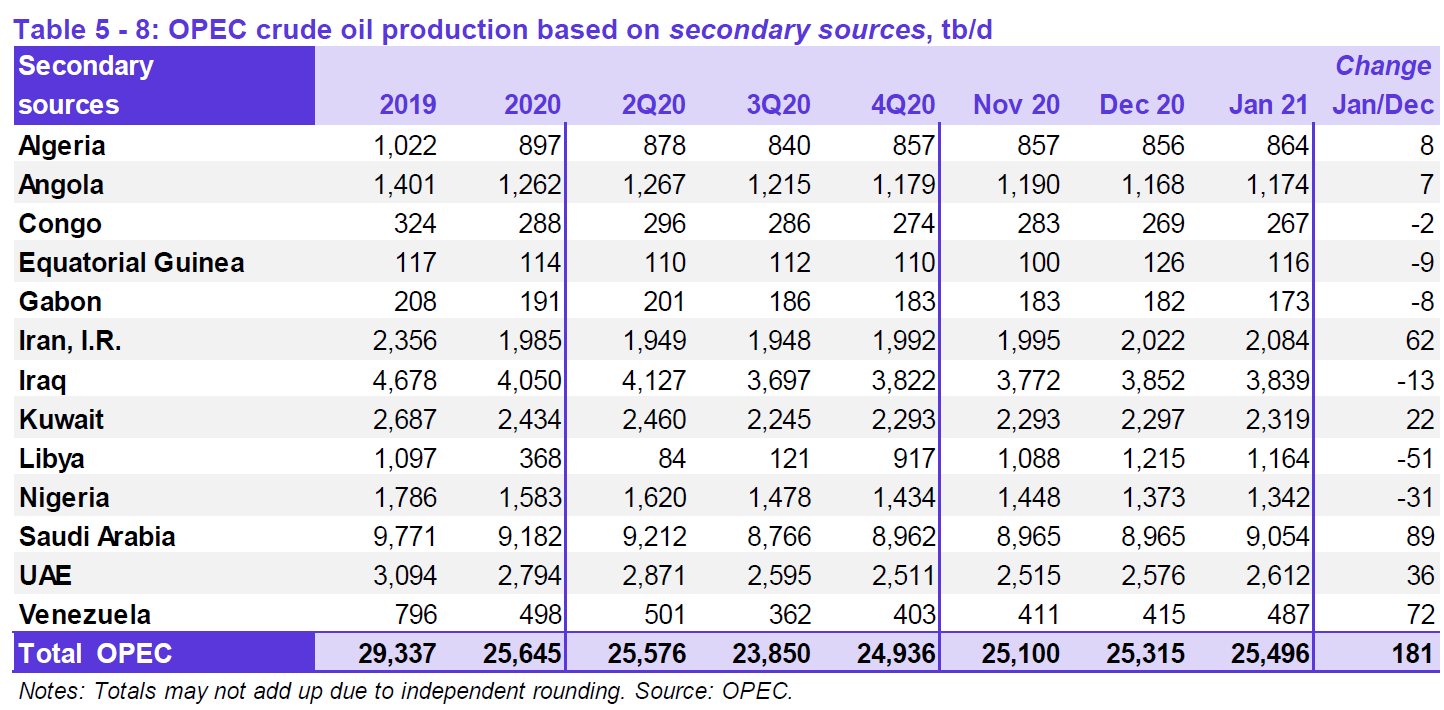
OPEC crude output increased by 181 kb/d in January 2021, December 2020 output was revised down from last month’s report by 47 kb/d.
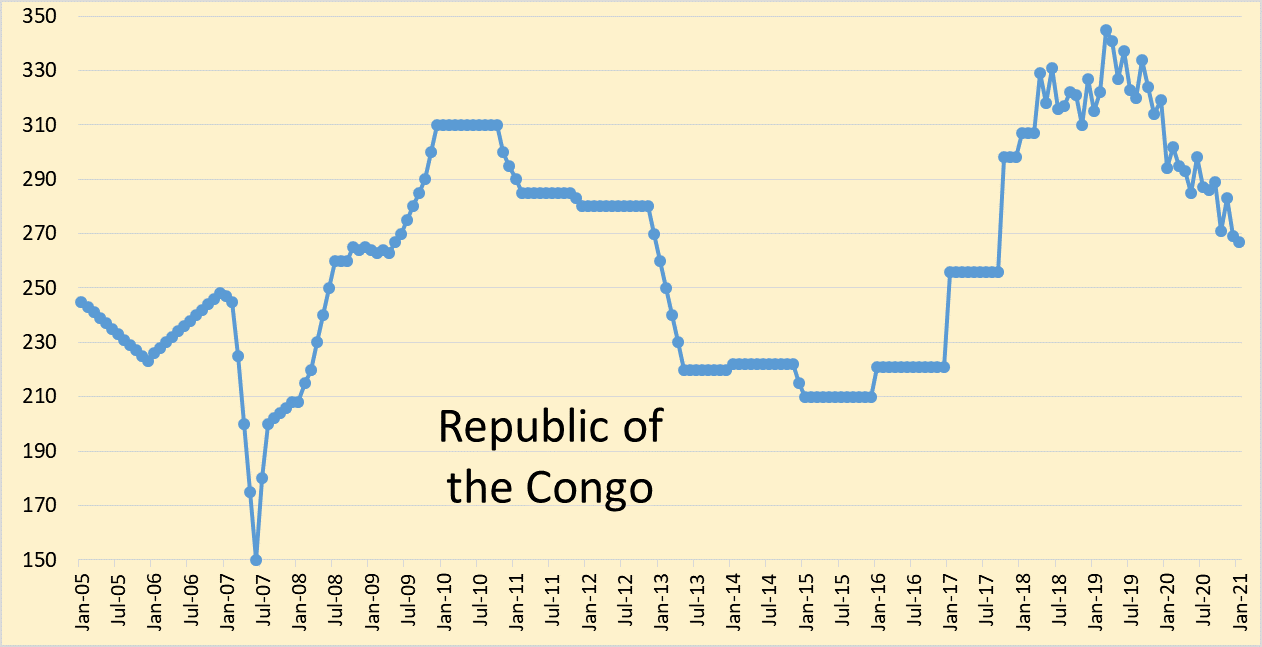
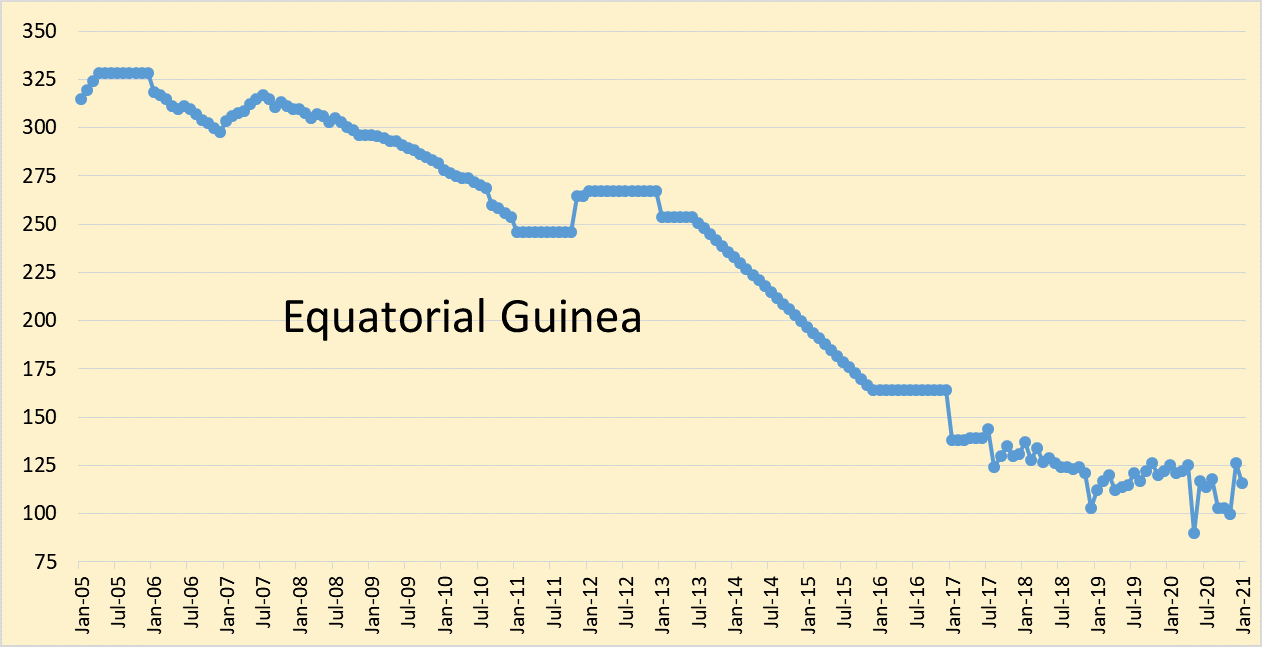
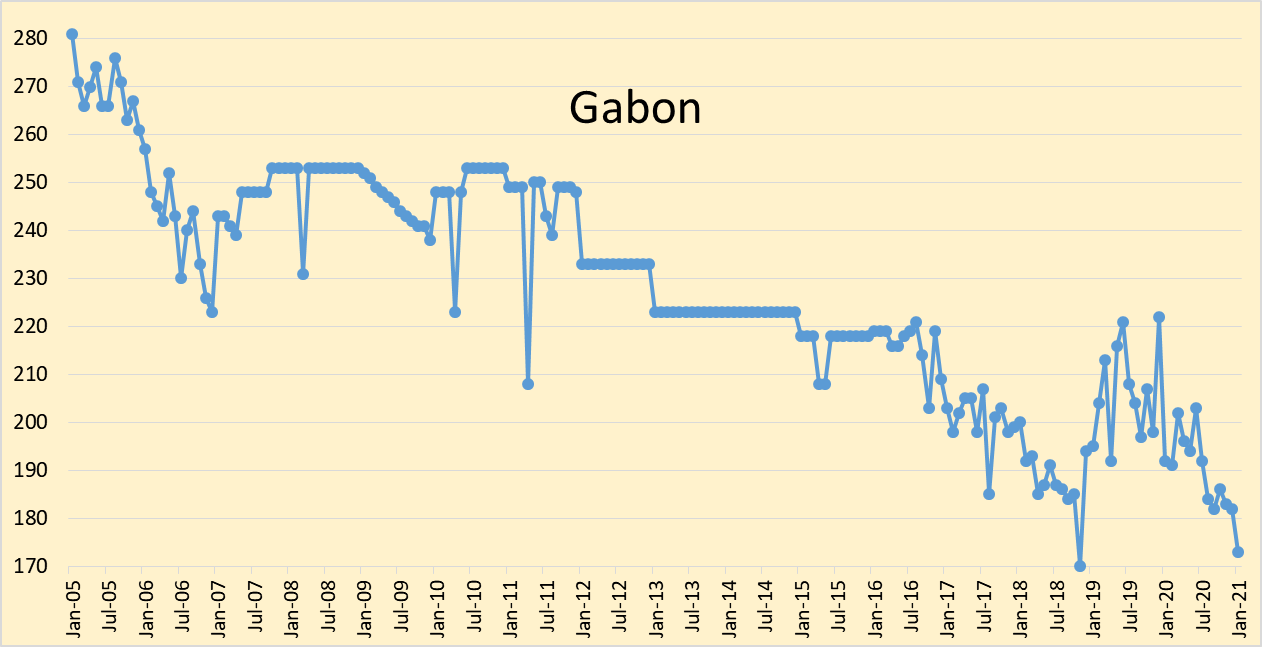
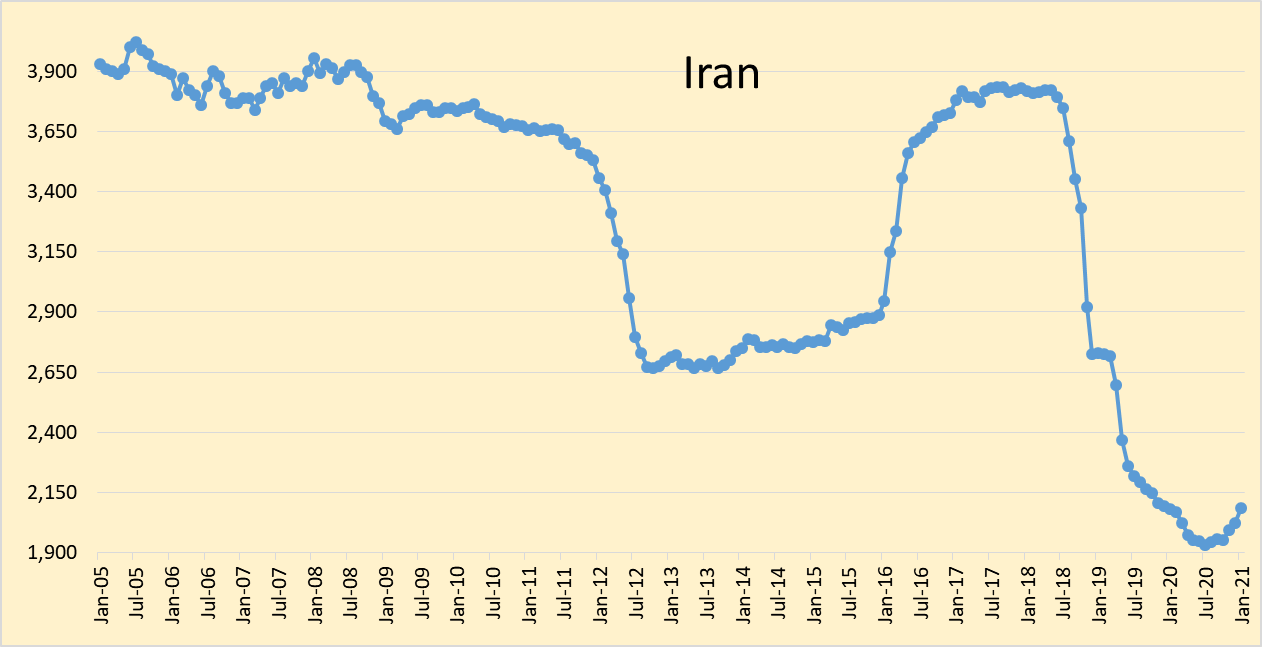
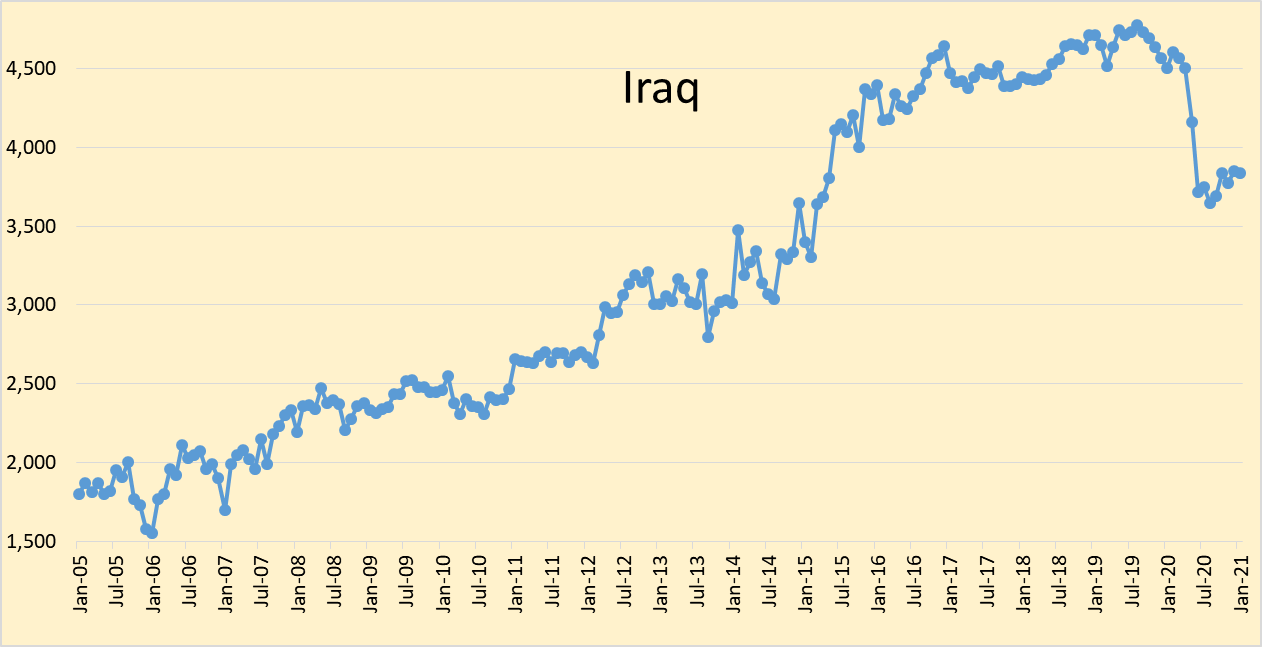
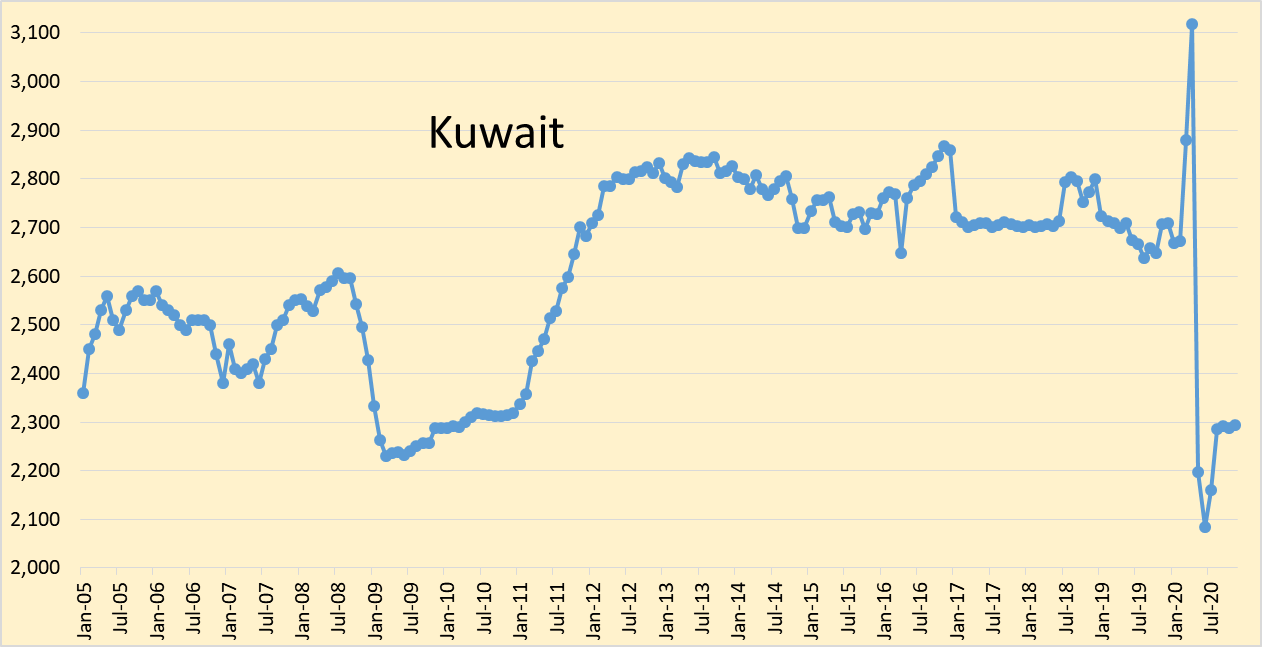
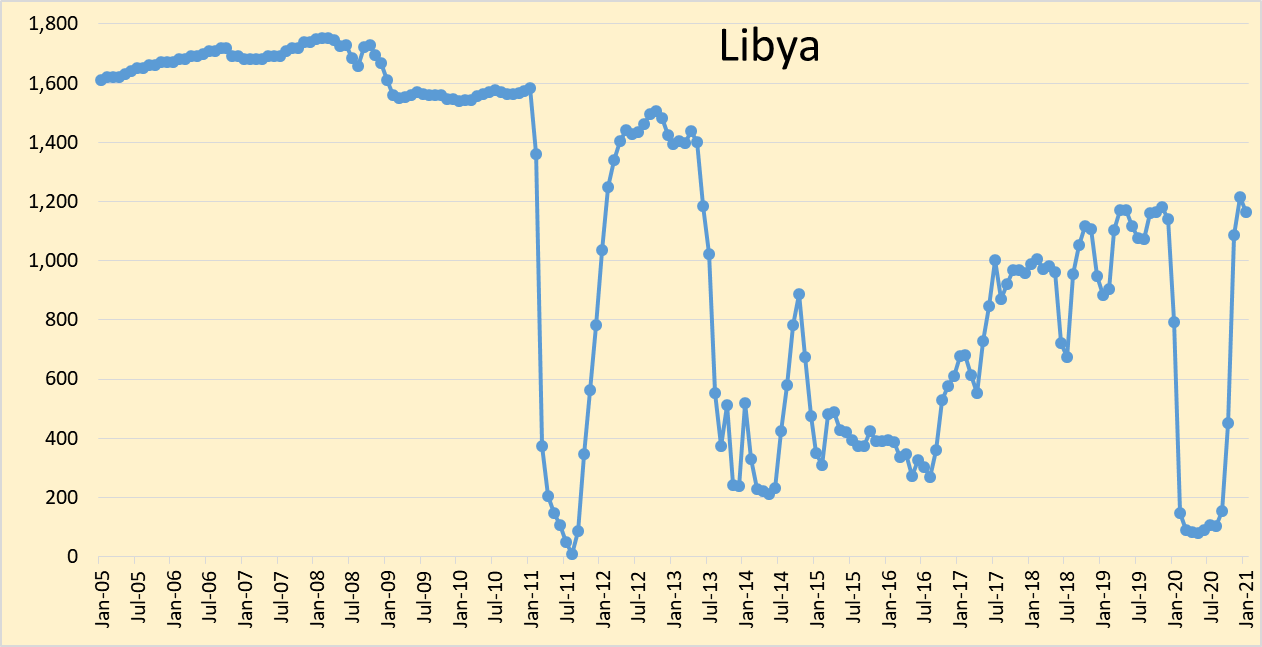
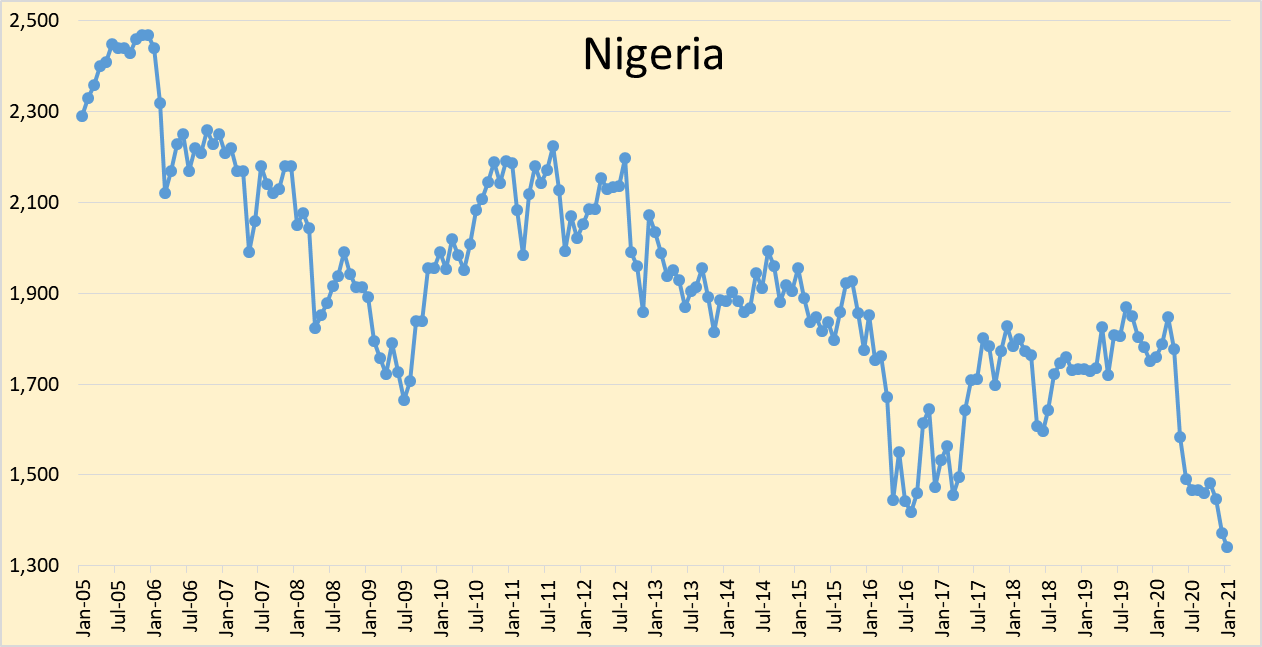
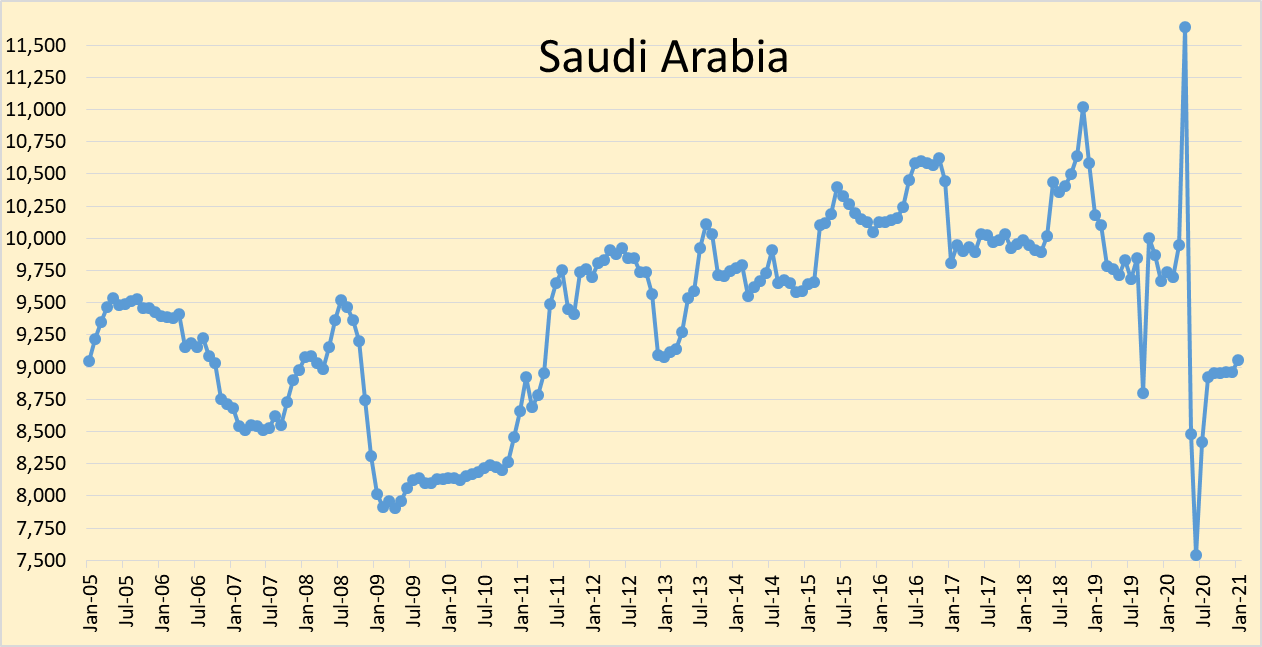
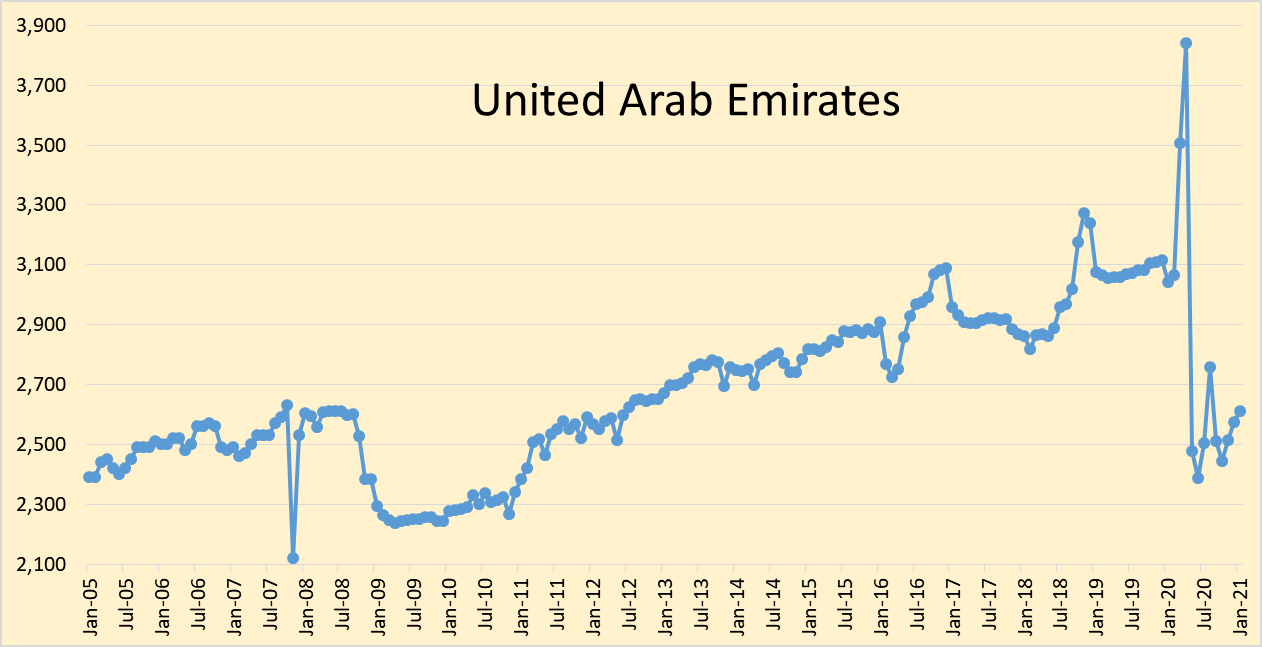
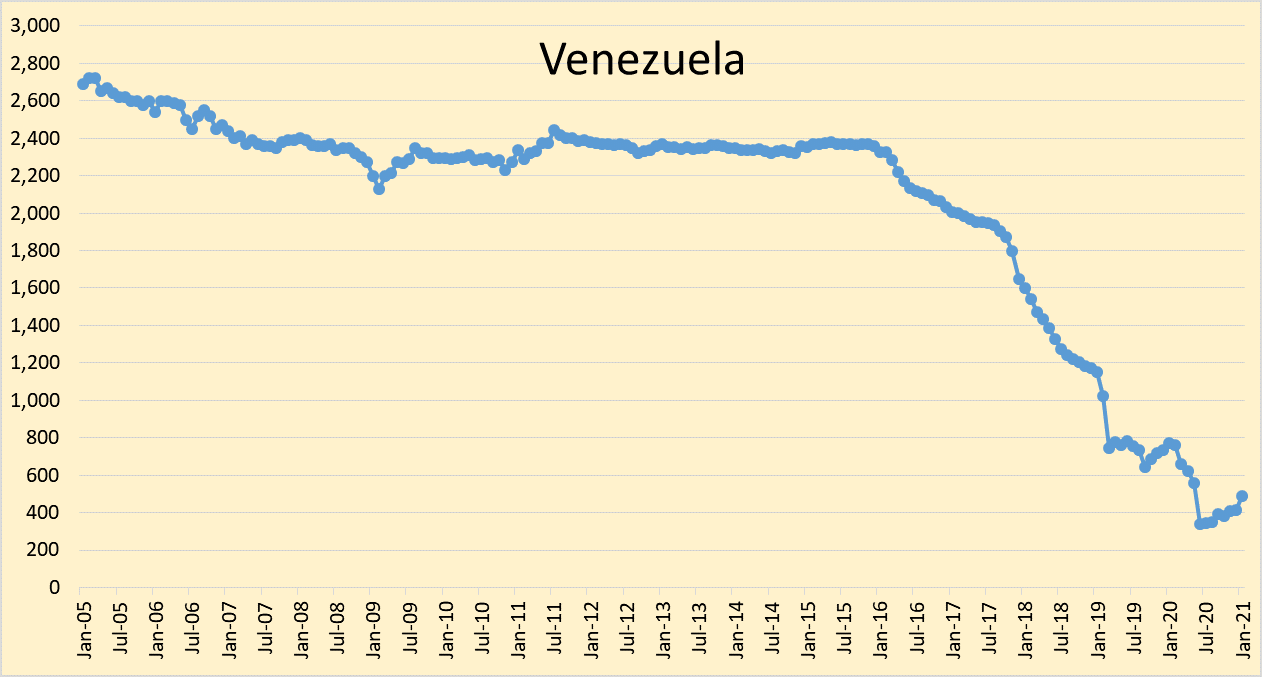
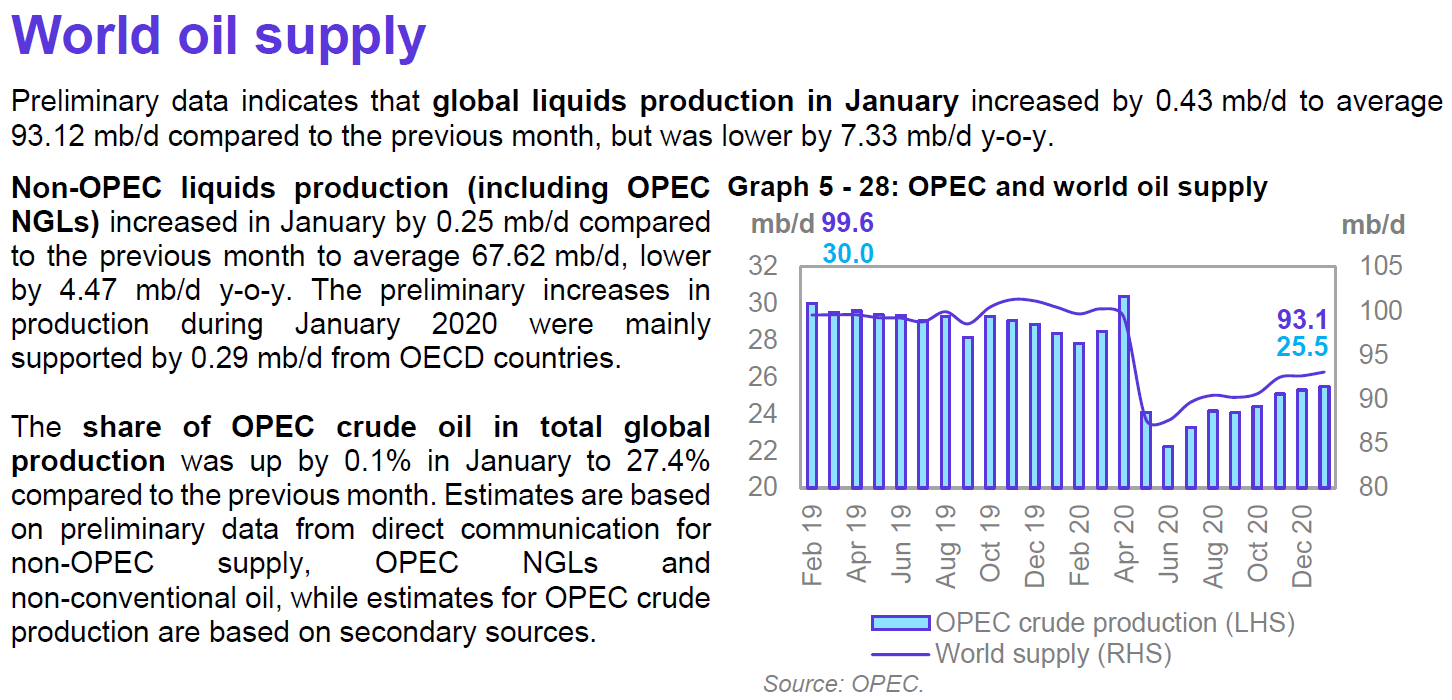
World liquids output was down about 7% from the January 2020 level.
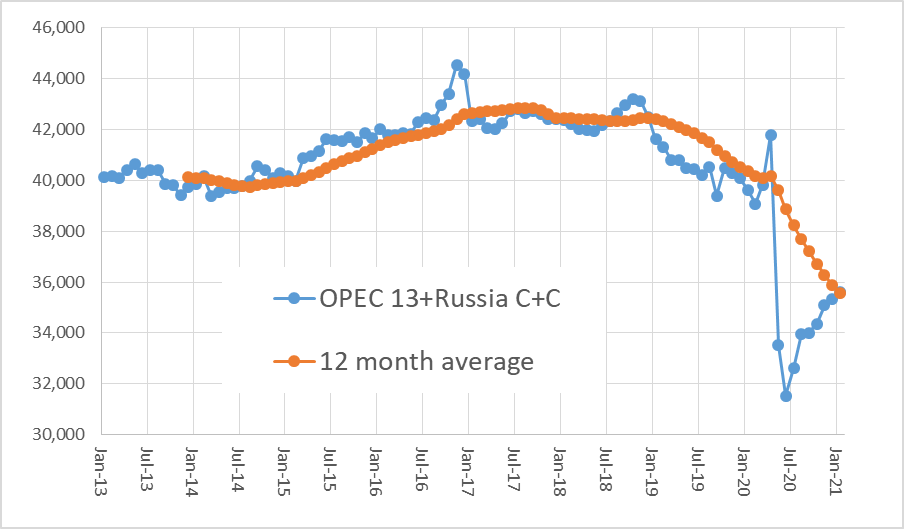
The chart above uses data from the Russian Energy Ministry and converts from metric tonnes to barrels at 7.3 barrels per tonne, the combination is OPEC crude plus Russian C+C output. Russian output increased by 100 kbo/d in January 2021, OPEC13 crude + Russian C+C output increased by 281 kbo/d in January 2021.
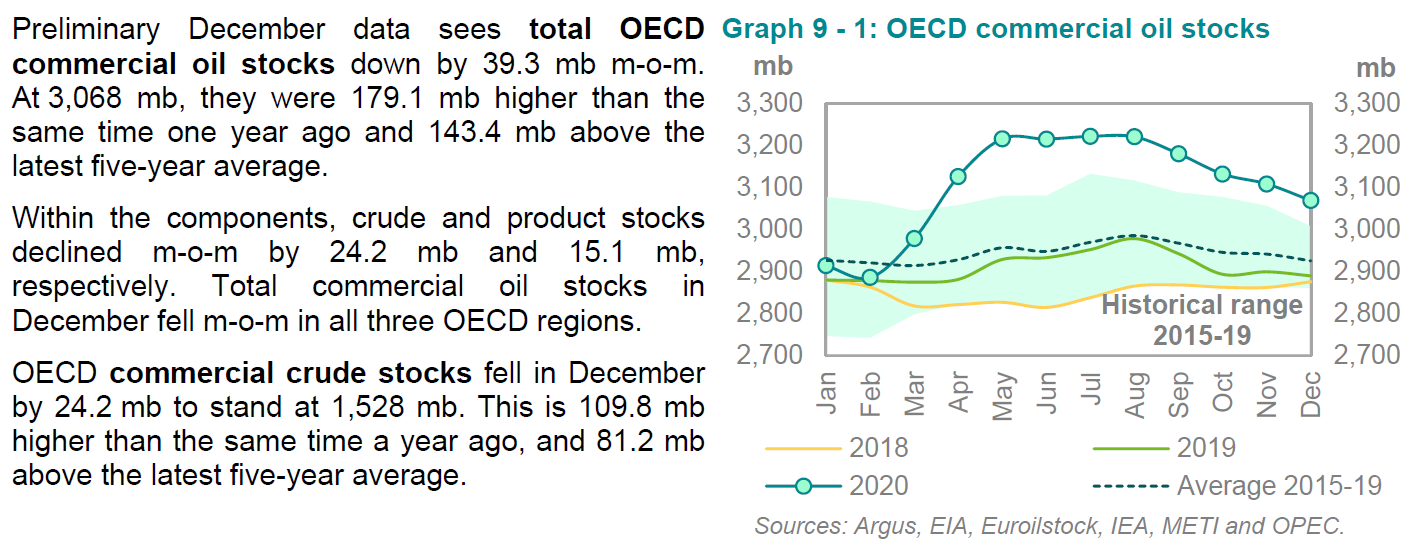


If OPEC’s World demand estimate for 2021 is correct and their estimate for non-OPEC liquids output is also correct, then an OPEC average output level of 25 Mb/d in 2021 would reduce World stocks of petroleum products and crude by 730 million barrels per day (365 times 2) because average demand for OPEC crude is estimated to be 27 Mb/d in 2021. Note that only 143 million barrels need to be drawn from OECD stocks to bring them to the 5 year average level. At a 25 Mb/d crude output level for OPEC, only 72 days (2.4 months) is needed to get back to a balanced oil market under the assumption that OPEC estimates of future World oil demand and non-OPEC output are both correct and that average OPEC output remains about 25 Mb/d for the next 2.4 months.
Exports seems to be falling:
OPEC+ seaborne exports down 1.8 mbd in January ahead of further planned cuts
Kpler data shows OPEC+ seaborne oil exports slumped by 1.8 mbd to 25.5 mbd in January.
Further Saudi cuts are likely to boost storage draws: global oil inventories have fallen 33 million barrels (mb) in January, of which 20 mb in Eastern Asia only.
Russia to slash oil exports to curb rising domestic fuel prices – report
The world’s second-biggest oil exporter, Russia, is planning to cut overseas shipments of its seaborne crude from the country’s western ports next month, to curb a record surge in domestic fuel prices.
The exports of Urals crude from Russia’s western ports will be slashed by up to 20 percent in February, Bloomberg reports, citing the loading program.
On Feb 2, I posted the following comment:
WTI punched a $55 ticket this morning. Last time that happened was Jan 23, 2020. Looks like the extra SA cut is working.
Today is Sunday February 14, 9:14 EST:
WTI punched a $60 ticket this Sunday evening somewhere in the world where markets are open. Something is happening out there that is not apparent. Anybody have some good ideas.
Six of the 13 graphs that Dennis posted are in decline.
Ovi,
Many of the OPEC nations in decline long term are the smaller producers. The key chart is figure one. OPEC output started declining mostly in 2019, part of this was sanctions on Iran and also oil prices fell from $85/bo in late 2018 and OPEC cut output in an attempt to increase output. Obviously a crash in World demand due to the pandemic did not help the price situation, leaving a big surge in petroleum stocks. Chart below shows OPEC 13 minus Iran and Venezuela, two nation that have been affected by sanctions and other political problems, the drop in output after 2018 is explained by lower oil prices in 2019 and then by the pandemic in 2020. Iranian and Venezuelan output are not likely to drop much more from current levels in the near term and eventually a deal might be reached with Iran and return output to the 2016 level.
Dennis
Those three peaks in your chart, Non-16, Nov-18 and Feb-20 are revealing in the sense that they are hinting of a potential peak in OPEC production since Feb-20 was an all out move to maximum production.
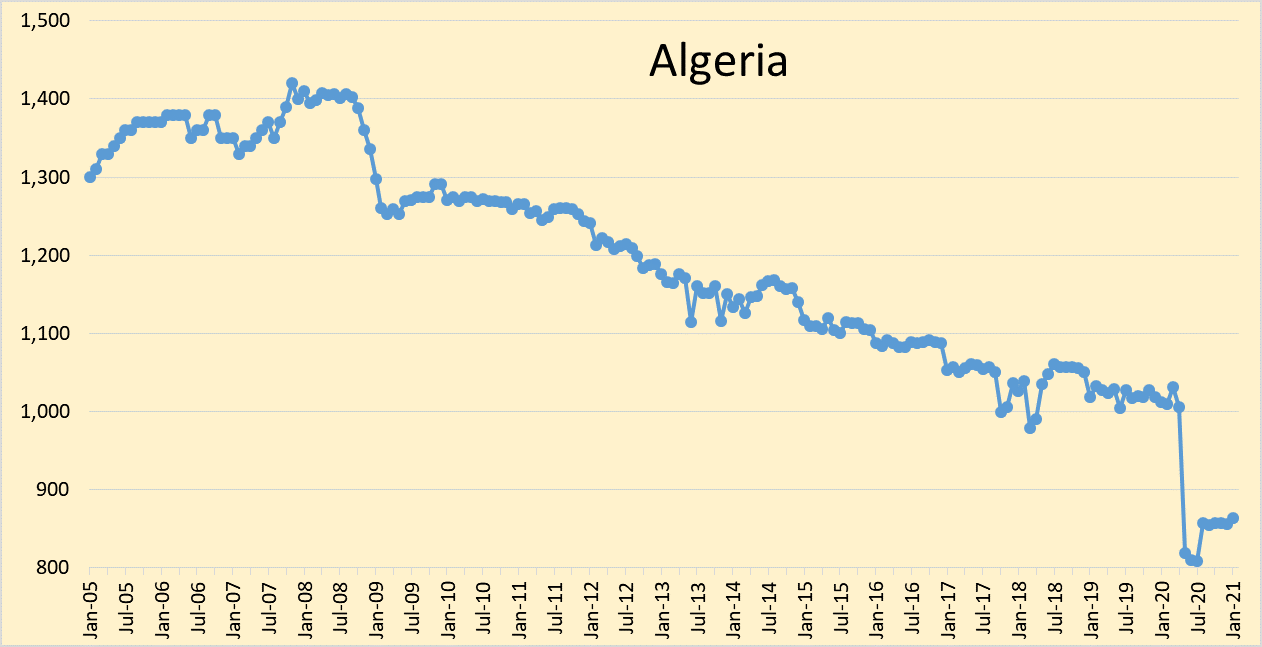
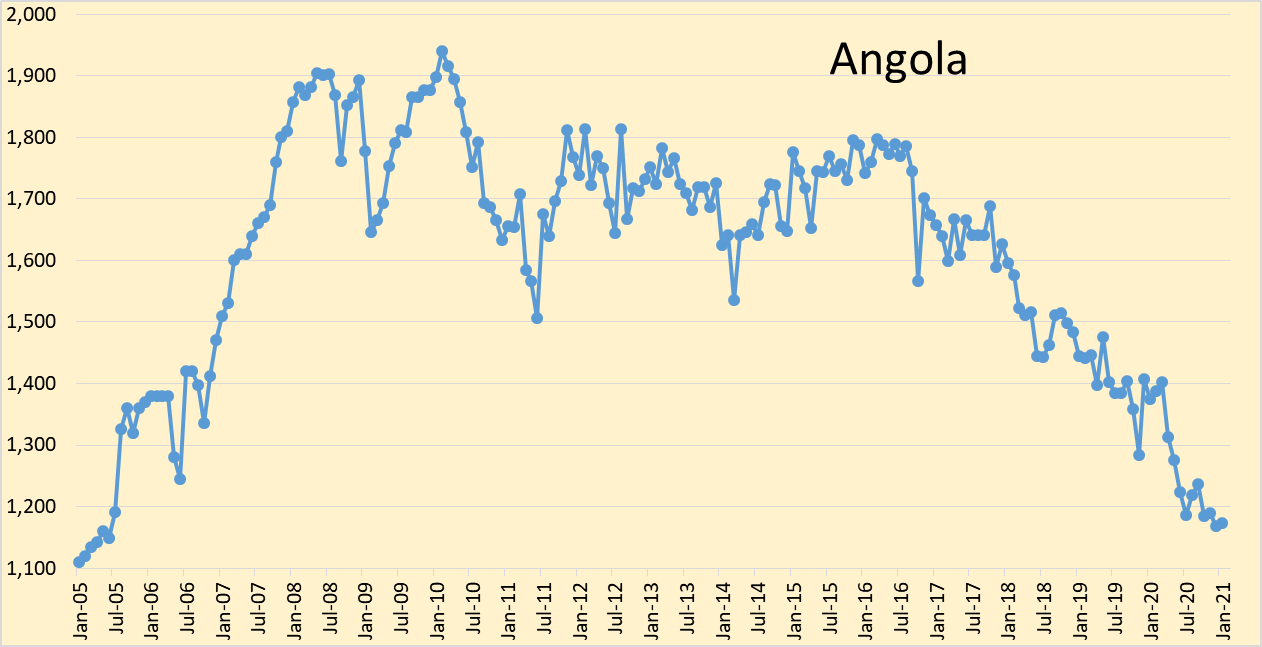
While the countries in decline are small producers, their overall decline rate is not negligible. Attached is a chart using the EIA C plus C data for five declining OPEC countries shown in your chart. The average decline rate is close to 150 kb/d/yr. I did not include the republic of Congo since its decline just started two years ago. Over the last two years it has declined at close to 40 kb/d/yr.
Yes, this is a valid point. I had it in my posts:
5/2/2021
Peak oil in Africa (part2): Export zero sum game
https://crudeoilpeak.info/peak-oil-in-africa-part-2-export-zero-sum-game
19/1/2021
Peak oil in Africa part1: OPEC quotas Jan 2021
https://crudeoilpeak.info/peak-oil-in-africa-part1-opec-quotas-jan-2021
We also still have the problem of OPEC’s paper barrels.
2/3/2011
WikiLeaks cable from Riyadh implied Saudis could pump only 9.8 mb/d in 2011
http://crudeoilpeak.info/wikileaks-cable-from-riyadh-implied-saudis-could-pump-only-9-8-mbd-in-2011
And another hint:
1/10/2019
The Attacks on Abqaiq and Peak Oil in Ghawar
http://crudeoilpeak.info/the-attacks-on-abqaiq-and-peak-oil-in-ghawar
What we would need are production profiles by field. Similar to:
https://crudeoilpeak.info/wp-content/uploads/ExxonMobil-Middle-East-liquids-prod-2000-19.jpg
Ovi,
The centered 12 month average is the important number in my view. The peak for the 11 OPEC nations in my chart (Iran and Venezuela are excluded) for the 12 month centered average is 2019Q1. It is mostly about the drop in oil prices due to excess oil supply in late 2018 and then the demand crash in 2020 due to Covid19. When demand increases OPEC will increase output, in addition tight oil output will increase by about 2 Mb/d from 2022 to 2026 and demand might just barely reach the 2019 level by 2025, with perhaps a bit of increase beyond the 2018/2019 level to perhaps 85 to 87 Mb/d of C plus C demand by 2028-2030, then we will see a plateau to 2035 and then a gradually accelerating decrease in World demand for C plus C from 2035 to 2050.
That’s how I see things now, next year this guess is likely to be revised.
There are a few factors at play IMO.
One factor is a change in one of the three large producer’s policies. This large producer is also the only producer that consumes more than it produces and therefore the only one of the three that favors lower prices. I’m referring to USA, of course.
USA shale (and to a much lesser extent GOM) growth kept a lid on prices. Where would prices have been 2010-19 without USA adding 7 million BOPD?
USA growth doesn’t appear to be headed toward adding 1 million BOPD or more per year in the future. USA companies are all being pressured to pay dividends. To cover dividends, USA companies need much higher prices. USA companies aren’t forecasting growth like past years.
For the first time ever, the USA government is not making oil production growth, either domestic or foreign, a priority. I am not making a “political” statement here trying to rile up the left on the board. Just look at oil prices since the USA election on 11/3. Not a coincidence. Not likely USA will be intervening anytime soon in the ME to protect oil supplies. At least not in a big way.
I have no idea how high oil prices will go. I wonder what happens politically in USA with $3 gasoline? $4 ? Are high gasoline prices no longer a political liability? They weren’t for Obama in 2012. But USA was drilling like crazy in 2012. Not sure what happens this time if that occurs, given clear desire of Biden Administration to discourage USA oil production growth.
Another factor is the Western European producers have told the market recently in a very straightforward manner that their oil production is past peak. The CEO’s of both BP and RDS have stated this. Total is also transitioning away from oil. Equinor also, it changed its name to remove the word oil.
Next, even though total worldwide demand will still be below a record, demand growth from 2020 to 2021 worldwide will be big, much bigger than from 2009 to 2010 after GFC. What did prices do from the depths of GFC to 2011? Compare GFC stimulus to COVID stimulus.
Last, how many paper barrels are traded per physical barrel? With the increase in paper barrels (I would call them more accurately day trader barrels) volatility in the oil market has grown. The price went negative big time one day last April. It was purely a day trader phenomenon.
Just my thoughts. Feel free to disagree.
Everyday you can find headlines that point to a huge transition underway in the world energy scene.
For example today-
-Exclusive: Equinor considers more US asset sales in global strategy revamp, and
-Ford bets $29B on leading the ‘electric vehicle revolution’
There is a huge scramble underway to adapt to the conditions these big companies now see coming to be over this decade.
In the meantime, I think that oil demand growth will be very strong over the next 18-24 months.
And as the price of gas in the USA goes up in this rebound phase, the great difference in travel cost/mile between plug-in vehicles (like a Ford mustang) and ICE vehicles will become a widely known fact. Ford (and the other manufacturers) all know that now, even if they were slow on the uptake.
This world is going to change rapidly this decade in so many ways.
I think a general feeling of optimism that there is light at the end of the Covid 19 tunnel is helping as well.
“ For the first time ever, the USA government is not making oil production growth, either domestic or foreign, a priority.”
Great observation. I recall when GWB2 went to KSA to ‘kiss the ring’ and ask for more oil production. I wonder how it will play out next time.
““ For the first time ever, the USA government is not making oil production growth, either domestic or foreign, a priority.”
Of much greater impact- For the first time ever, the major oil companies are not making oil production growth, either domestic or foreign, a priority.
Both are happening simultaneously.
Both are making a big impact.
Trump jumped on KSA when oil prices went up during his admin.
Will Biden?
The Biden administration is under pressure to see oil prices rise. The green agenda of wind, solar and EV’s is only cost competitive with fossil fuels in two ways: 1) green subsidies; or 2) higher oil prices. Until high oil prices threaten the economy, the Biden administration will enact policies that gladly see oil prices rise. And with the oil price experience of 2009 to 2014 still relatively fresh in people’s minds, the Biden administration is not afraid of $60, $70, or even $90 oil. They are hoping for it.
“$60, $70, or even $90 oil. They are hoping for it.”
As are the people working in the oil industry.
As far as anyone on this board is considered, the higher the price of oil the better. Let’s phase out oil production in the US over the next three decades and keep the price high the entire time so the producers make money and people are incentivized to switch to less polluting EVs. It’ll be like the TRC for the whole country but heading towards a bottleneck. Auction drilling rights so only the best wells get drilled. Keep restricting drilling in a phased manner, enact a gradually lower cap on the number of wells that can be drilled until it goes to zero in twenty years and then maintain these stripper wells until they are empty.
Can you imagine any US party that would actually dare to promote a higher cost for gasoline? Personally, I think there should be a big carbon tax and fuel tax surcharge imposed to fix infrastructure, but whatever.
Confession: I am not anti oil. My son works in the Cdn industry. I just think people drive more than they should and that energy should be priced higher. Win win.
So $90 oil is good for:
-Saudi
-Democrats
-Shallow
-Tesla
-Renewables
But not for:
-Rednecks with huge vehicles
The election calculus gets tricky here.
PAOIL-
I disagree that high oil prices are needed to make green energy competitive, because oil is already very expensive energy, which is why it is rarely used to generate electricity. Wind and solar compete against coal, nuclear and gas, not oil.
Oil shines as a way to store energy in a moving vehicle and power internal combustion engines. As such, it really competes with batteries, not with the rest of the energy market at all. And batteries still have a tiny impact on oil markets.
So higher oil prices might be useful for the EVs, but not particularly useful for wind and solar. But in reality, the EV market is suffering from chronic battery shortages as manufacturers struggle to build factories fast enough to meet 20% or more annual demand growth. The oil price really isn’t an issue, and raising oil prices wouldn’t help.
If Biden’s goal was to make EVs more competitive, the government has an easy way to raise oil prices, which is to raise taxes at the pump. This would be more or less neutral to the oil price from the producer point of view. It would just encourage exports and discourage imports, improving America’s balance of payments. But it hasn’t worked in Europe, where taxes are over 60% of the price at the pump. The most effective way to promote EVs is subsidizing the purchase price of the vehicle. That has been very effective.
Hoping that the American consumer will keep oil demand up internationally no longer makes sense, as America’s relative economic importance has been falling since 1945. I’m not sure what the previous administration was trying to accomplish by talking down the price.
“But it hasn’t worked in Europe, where taxes are over 60% of the price at the pump. ”
So average fuel economy in Europe and US is the same?
I have driven a Toyota Corolla on an 4 week US trip.
With an engine for the US market – you can’t buy this modell in Europe. It was very steady going – and thirsty. At least for european thinking, we used 7-8 litres / 100 km by mostly driving country roads in cruise control at the given speed (didn’t wanted to deal with US police). Slow for my feeling, I’m driving faster in Germany.
And use only round about 6 litres with a car of similar size, which is a bit faster than this Corolla – with this lazy slow driving I would use below 5 litres with my car (and get a lot of flashing).
So there is a difference in fuel economy.
Jeff –
That was a little unclear on my part. I meant high gasoline prices haven’t gotten people to buy, EVs, but direct subsidies seem to work.
It’s also worth mentioning that $120 oil didn’t really dent consumption much, and certainly didn’t inspire many to buy EVs.
In my opinion liquid fuel is cheap. I mean I think that consumers aren’t willing to make significant changes in behavior even if prices increase significantly.
Alimbiquated, as an European in a well-to-do country, the matter of car buying is somewhat more complicated than just gasoline price. E.g. fully electric car availibily, their price, distances that need to be travelled (range anxiety in other words) are still important. Hybrid cars are also rather expensive. Here it seems that these two car groups are selling better and better, public charging points are increasing etc so we will see what happens. As I have a full electric car I got relatively cheaply (still a bit of ouch…) I think I will not get a petroleum or diesel car ever…
“The green agenda of wind, solar and EV’s is only cost competitive with fossil fuels in two way” Three ways, actually. The third is when we finally start to realize the actual cost of destroying the environment by burning fossil fuels
Global crude oil may have peaked 2018-19 before Covid
https://pbs.twimg.com/media/EsHyv1FVQAIDRAd?format=jpg
If ever we come out of the Covid tunnel, there could be surprises ahead
Definitely past peak.
What’s interesting is to see how the propaganda bureau spins it to avoid panicking the sheeple — you can bet it will be a victory for the “green energy transition” … ala, BP & RDS.
Yes, we were already post-peak when the covid epidemic began.
The above chart is through November 2020 and is Crude + Condensate.
The conspiracy theorists would point to that coincidence.
Strike threatens shutdown at Norway’s giant Johan Sverdrup offshore oilfield
A dozen workers that are members of the Safe union are threatening to down tools at the Mongstad terminal from midnight on Monday if talks with the industry body aimed at breaking an impasse over a 2020 wage settlement with Equinor fail.
Other fields that could be impacted include Kvitebjorn, Visund, Byrding, Fram and Valemon, with gas output exports from the Troll area also in danger of being hit.
With an excursion to Gabon and Azerbaijan
15/2/2021
Exxon-Mobil’s refinery closure in Australia: peak oil context
https://crudeoilpeak.info/exxon-mobils-refinery-closure-in-australia-peak-oil-context
An interesting scenario showing what happens when demand outstrips supply due to lack of investment is playing out right now in Oklahoma and Texas. There has been a lack of investment in the region last year due to the drop in prices, and in Oklahoma, the slowing of investment has been happening for a few years. The massive cold snap that descended on the region made spot prices (not the futures price you can look up on Bloomberg etc) rise from $2 an MMBTU, to $5, to $9, to $300, to $600, all in the course of a week. It is currently higher. The cold weather has caused shut ins of wells, and processing plants. You have a situation where demand is increasing but supply cannot keep up. I know this is a micro problem that will resolve itself as temperatures increase, in the coming weeks, but this could be an example of what oil prices might see in the near future. There has been a lack of investment for years in large projects, if demand rebounds quickly as vaccine roll out continues, we will not be able to turn back on new production fast enough to keep prices from running higher, resulting in some temporary ridiculous price spikes.
I saw this resulted in a lot of wells that have been shut in for 5-10 years being reactivated.
Shallow, are you affected by the cold snap or power outages?
Yes. We have about 10% frozen off. Our pumpers decided what to drain and shut in, and what to keep on. They are real pros. You can’t find better.
Our people are the key. We owe them bigtime. They have been out there in this stuff keeping the rest from freezing.
We will be good soon, temps will come up.
Keep in mind, with one exception, our pumpers are 50+ years old.
Are there millennials that are going to keep the strippers going 24/7/365?
Takes special people.
No. I work in construction biz. 90% of twenty somethings can’t work five minutes without looking at their phones. They are useless. All my buddies have the same complaint.
An interesting clip from this article:
“This isn’t a consensus view yet but it’s quickly coming. Two heavyweights in the past week have stepped up and called out the problem.
The first was Goldman Sach’s Jeff Currie, who called the bull market in the early 2000s.
“I want to be long oil and hang on for the ride,” Currie said in an interview with S&P Global Platts on Feb. 5, warning “there is a lot of upside here.”
“Is it back to $150/b? I don’t know… as it is a macro repricing we are talking about and everything needs to reprice.”
The other is JPMorgan and Marko Kolanovic, who said Friday that oil and commodities appear to be entering a supercycle.
“We believe that the new commodity upswing, and in particular oil up cycle, has started,” the JPMorgan analysts said in their note. “The tide on yields and inflation is turning.”
“We believe that the last supercycle peaked in 2008 (after 12 years of expansion), bottomed in 2020 (after a 12-year contraction) and that we likely entered an upswing phase of a new commodity supercycle.”
https://www.forexlive.com/news/!/what-an-incredible-turnaround-for-oil-prices-20210215
WTI hit $60 today. How come high oil prices seem to be doing nothing for the shale business.
Anyone? Anyone? Bueller? Dennis? 😉
They’re too busy spending all their earnings…
Drillers Trying New Pricing Structure
Shale driller bases rig lease costs on well performance
Rigs are typically rented out at a daily rate for a period of a few months, which has meant less money for oilfield service providers as drilling becomes quicker and more efficient. So Helmerich & Payne Inc. is touting a new pricing model based on overall well performance, and almost a third of its U.S. rigs are now being leased on that basis, CEO John Lindsay said Wednesday on an earnings call.
In the Permian Basin of West Texas and New Mexico, home to the busiest shale patch in North America, operators are now drilling the same number of wells with 180 rigs as they were with 300 rigs a year ago, according to industry data provider Lium.
https://www.worldoil.com/news/2021/2/16/shale-driller-bases-rig-lease-costs-on-well-performance
Yeah okay. That’s all great. But what I was looking at was oil production. It’s going down, not up. With these prices oil production should be increasing, not decling. Why is that? After all, that’s really all that matters.
Ron there is a well known lag between changes in oil prices and changes in production.
Okay, I misspelled declining. Sorry about that.
Good to hear from you Ron.
In ShaleProfile published today, the Permian is showing a slight bump up in production. It may have hit bottom. The latest STEO is showing US production dropping till June and July before beginning to increase. Looks like many more LTO wells have to be put on line before the decline from all of the current wells can be offset.
Ron,
DPR I ignore. We only have real data through December 2020. My models have assumed lower oil prices than we see at present and it will take time for these prices to affect output, we will know more in June. February oil prices won’t affect output until April to June and we don’t get the tight oil output data until June to August.
Chart below has tight oil data and a model based on lower oil prices from short term oil report from last month, model needs revision for higher oil prices.
Keep in mind that futures prices are less important than spot prices, the current front month futures contract is for March in the case of WTI or April for Brent futures contracts. Real Brent spot price in 2020 US$/bo through December 2020 in chart below.
When we see the spot price for Brent reach $65/bo for average monthly price and/or WTI average monthly spot price reach $60/bo (in 2020 US$/bo), we are likely to see US tight oil output increasing within 2 to 4 months. Even with a lower oil price scenario I expect the bottom for tight oil to be 6.5 Mb/d in June or July. Higher oil price scenarios such as nominal oil prices climbing to $75/bo (Brent) by the end of 2021 would see an earlier bottom (maybe March or April) and perhaps only falling to 6.8 Mb/d (for US monthly tight oil output) before starting a slow increase.
It is doubtful that US tight oil output returns to previous peak (November 2019) before 2025, unless we see sustained Brent real oil prices (2020 $) above $75/bo. If that happens soon (within 12 months) and is sustained it is possible we reach the previous tight oil peak earlier, perhaps by early 2024.
U.S. oil output plunges as Arctic air freezes Permian shale fields
(Bloomberg) –U.S. oil production has plunged by more than 2 million barrels a day as the coldest weather in 30 years brings havoc to key producing states that rarely have to deal with frigid Arctic blasts.
Oil traders and company executives, who asked not to be identified, lifted their forecasts for supply losses from an earlier estimate on Monday of 1.5 million to 1.7 million barrels. They said the losses were particularly large in the Permian Basin, the most prolific U.S. oil region, which straddles West Texas and southeast New Mexico. Output cuts were also significant in the Eagle Ford, in southern Texas, and the Anadarko basin in Oklahoma.
Two million barrels would be the equivalent of about 18% of overall U.S. crude production, based on the most recent government data.
Wonder if this drop will show up as a drop in US inventories on Feb 24. While production is down, so is driving.
https://www.worldoil.com/news/2021/2/16/us-oil-output-plunges-as-arctic-air-freezes-permian-shale-fields
This affect will be very temporary, it will warm up soon.
Reminder back in the day in the Bakken they had to equip their onsite huge storage of fracking water with heaters, because NoDak is cold. One suspects the Permian is not equipped with that and widespread frozen pipe damage can be expected.
Pipes can be repaired and lines can be filled with antifreeze temporarily, the smart producers will be prepared.
Dennis.
When the power goes off unexpectedly during below freezing temperatures, there is isn’t anything that can be done to prepare. Everything above ground freezes up, the colder the quicker.
Not sure about anti-freeze. Where did you read about that?
Texas will be warming up quite a bit, the best thing that could happen.
Couple of things to think about. Texas has a lot of water floods and CO2 floods, more than any other state. If those are down for awhile, they might permanently lose some production.
Another issue, I am not sure how deep they bury flow lines, injection lines, etc in TX. It is a big state, I suspect things are done differently in different areas. I have only been to the Permian Basin once, and that was before shale. I recall seeing lines on the top of the ground there. Those could have been temporary, I don’t know enough to know how they do things there.
Another issue would be the injection plants and gas processing plants. I bet those aren’t insulated and heated like they are further north.
This time around, we didn’t lose power where we are. So not much of our production went down. The low volume stuff that freezes easily, we drained everything so pipes wouldn’t burst. However, we don’t drain our separators. The stove pipe sized ones I am sure are solid ice and will take many days to thaw.
It also matters how cold it gets and stays, for how long. Think about how the ice freezes on ponds. The colder for longer, the thicker the ice gets. That ice is in the top of the water tanks just like a pond, you tend to get ice chips going through your injection pumps, which causes damage. If you keep running, the produced water running in the tank helps keep the ice to a minimum because it is warm as it is coming from deep below ground. When everything stops, no more naturally heated water is running through anything.
We wrap most of our above ground lines with insulated foam. We also use heat tape on water legs, and other above ground lines at the tank batteries. Our injection plants are insulated. We use heat lamps. When it warms up, the foam is removed. It tends to cause condensation to build on the fittings, etc above ground, including the top joint of tubing in the injection well, which isn’t good. So you don’t leave that on but for when it will be really cold. The injection plants have large doors, in the summer they are all opened up, and we have electric fans blowing on the pumps to keep them and the engines cooler.
Of course, all of this costs money and takes time. We have to do it because we can go well below zero in the winter and get up to 100 in the summer. I think a lot of areas in TX don’t get that cold hardly ever, so they don’t do all that stuff.
What TX went through would be like if it got -40 F where you or I live for several days. That would be hard on us, but someone above the Arctic Circle would be prepared.
Shallow sand,
The Texas operators knew this was coming, the better companies know what is done in colder climates and do all they can to prepare. Antifreeze in water lines is often used to prevent freezing in cold weather. Many people have summer camps that are winterized by putting antifreeze in water lines while the camp is idle during winter, RVs often do the same, I have no idea what is done in the oil field. My thinking is that you bury waterlines below the frost line so no need to worry about lines freezing, in Texas they are closer to the surface so they would freeze and should have been temporarily filled with antifreeze to prevent damage.
I don’t know, Dennis. I don’t think the operators in Texas could have done as much as you think on fairly short notice.
The main problem was the power went out. When the power goes out, and the temperature is significantly below freezing, everything above the surface freezes.
I am not following how operators use antifreeze in their lines. I don’t think we’d want antifreeze mixed in throughout our system. Our water floods are closed systems. Oil and water come up the well, go to the separator, oil goes into the stock tank, water goes into the water tank, and then is injected either back into the producing zone, or into a deeper zone below the producing zone.
Seems like the antifreeze would end up everywhere in our closed system, including our oil, which I suspect would be a bad deal.
I don’t pretend to know everything, so maybe if you point me to where antifreeze is used as you say, I could look into it more.
In any event oil production and gas production is heavily reliant upon electricity. When it went out, everything powered by electricity stopped. Then everything froze up. That’s what happened in TX based upon my reading about the situation and in communicating with those operating wells there.
Dennis. I have done some reading, and do see where methanol is used as an anti-freeze for natural gas production applications.
Shallow sand,
I don’t know anything about oil field operations. I was speculating that the water lines could have been temporarily filled with antifreeze, perhaps not practical in practice.
Tight oil model update with oil price assumption for real Brent crude price (in 2020 US$) rising to $75/b by Dec 2021 and then remaining at that level until Dec 2040, then real Brent oil price is assumed to decline linearly to $30/b (2020$) by 2063 and then remain at that level until 2080 (end of scenario). URR is 92.6 Gb for this scenario, peak is 2027/2028 at 9.7 Mbo/d.
Future oil prices are unknown along with producer response to prevailing oil prices, in other words both the future oil price and completion rate assumptions of this model are likely to prove incorrect, the scenario is an educated guess based on current information and like all scenarios of the future the probability of choosing a correct scenario of the infinite possible scenarios is exactly zero.
Dennis
The part of your chart I don’t like is 2023 where production goes up 1 Mb/d. That is what killed the oil market last time. I hope that they wake up and instigate some minimum level of proration in Texas.
There is no part of the chart that I don’t like. I just love that chart. I especially love that dramatic upturn this coming summer. Turning on a dime. 😉
Hi Ron,
That is what might happen if oil prices continue to rise. We will see.
Yeah, you are correct if the price of oil is the only determining factor. But I think geology, as well as oil field economics, just might have some say in this scenario. But as you say, we shall see.
I misspoke there. I meant to say oil price is not the only determining factor. Not by a long shot. Geology is the most important factor.
Ron,
The scenario is based on estimates for tight oil resources by the United States Geological Survey, those guys know their geology and geophysics. The Permian basin is estimated to have technically recoverable resources of about 75 Gb, based on the economics using current capital and operating costs and assumed productivity decline for new wells based on the current resource estimates, well spacing, and total acres with productive rock, I estimate about 62 Gb of economically recoverable resources from the Permian basin and 90 Gb for all US tight oil (Bakken and Eagle Ford about 17 Gb, and rest of US tight oil about 11 Gb.)
Prices are not the only factor, just one of many (such as well cost and well productivity). Many of these factors are in the model, which will never be a perfect reflection of reality, simply a rough approximation, if assumptions about the future are roughly correct (which is not likely.)
…technically recoverable resources of about 75 Gb,…
“Technically recoverable” means that the oil and/or gas can be produced using currently available technology and industry practices. This is regardless of any economic or accessibility considerations. For example, the technology required to produce oil from a location might exist, but it costs more than the oil is worth.
Ron,
That is correct 75 Gb TRR and when using an oil price scenario with a maximum oil price of $75/b the economically recoverable resources are 62 Gb using standard economic assumptions and assuming no further reductions in well cost, or operating cost and that average estimated ultimate recovery from new wells falls starting in Jan 2020. Likewise I use TRR of 11 Gb for North Dakota Bakken with ERR of 8 Gb and TRR of 14 Gb for Eagle Ford with ERR of 9 Gb and for the rest of US tight oil I make a guess of TRR as there are no USGS estimates, ERR for everything else (Niobrara, Anadarko, Granite Wash, Monterrey and condensate from Utica and Marcellus, Haynesville and other shale gas plays) is 13 Gb.
Dennis, that is about 19 years of production at the rate they were pumping before the pandemic drop. (Using DPR data that you think is inflated.) That is an absurd number. Eagle Ford and the Bakken had already peaked before the drop.
I would rather believe the absurd Saudi numbers. They are far more realistic.
Ovi,
The model has an increase of 840 kb/d (from 7567 kb/d to 8408 kb/d) in 2023. From Nov 2018 to November 2019 US tight oil output increased by 1045 kb/d (from 7235 kb/d to 8279 kb/d. So the model is pretty much a repeat of the 2018 and 2019 trajectory, no reason that this cannot happen at Brent prices of 65 to 75 per barrel, imo.
Dennis
I am not questioning that it can’t happen. I don’t understand the concept of flooding the market to wreck the price of oil especially considering the mess they created last time. Why not just produce a steady amount that maximizes profit or cash flow. A basic business concept. I would think that XOM and CVX might do that. However I am not sure how much of the production potential they control. They would have to act as the OPEC of Texas in the sense of limiting their production while the independents pump all out.
Ovi,
Each business acts independently and assumes their output does not affect the price of oil. The oil producers in the US are not part of a cartel and the Texas RRC has long given up trying to influence the price of oil through production quotas, in fact most Texas oil producers are against such a policy, afaik. An assumption that producers will hold back output to keep oil prices high is unreasonable in my view based on history.
Note also that the World economy might rebound sharply once most of the World population is vaccinated, it is not clear how quickly this can be accomplished. It is possible output could be lower if the completion rate of new tight oil wells is more limited. My scenario assumes Permian basin completion rate is as in chart below (I show centered 12 month completion rate).
Slightly different scenario with maximum completion rate in Permian of 485 wells (scenario above has a maximum completion rate of 600 wells). The URR of both scenarios is about 92 Gb, the AEO reference case URR is about 122 Gb and the low oil supply case also has a 92 Gb URR (similar to my models). Note this chart uses annual average output where the precious chart used monthly data.
Russia Oil Output Below OPEC+ Quota Amid Cold Siberian Weather
The OPEC+ member pumped 1.38 million tons a day of crude and condensate on average from Feb. 1 to 15, according to two people with knowledge of production data, who spoke on condition of anonymity. That equates to a daily rate of 10.115 million barrels, about 44,000 barrels lower than January’s level.
Rosneft oil production to decline as it parts with legacy assets
Russia’s Rosneft is braced for a decline in oil production this year despite a gradual removal of output restrictions that have been imposed on the company by the Kremlin under its commitments to members of the Opec+ alliance.
Speaking on a conference call on Friday, Rosneft first vice president Eric Liron said the oil giant expects annual output of oil and condensate to fall by 5% in 2021.
In 2020, Rosneft reported an 11% annual decline in oil and condensate production to 4.1 million barrels per day and a 6% drop in gas output to 63 billion cubic metres.
Rosneft Oil : Igor Sechin Reports to President of Russia on Company’s Performance in 2020
Samotlor was one of the key fields where the Company significantly ramped up drilling in 2020. According to Igor Sechin, due to the investment incentives, Rosneft increased and maintained local production levels and fulfilled investment agreements, signed with the Finance Ministry.
Note that Samotlor peaked in 1980 at nearly 3.2 million b/d, is 80% depleted with water-cut up to 96%. Over 19,000 wells have been drilled at the field. But it is still considered a “key field”.
SAUDI DATA: Crude stockpiles slump to record low as exports keep rising
Stocks ended the month at 140 million barrels, down from 143.4 million at the end of November and the lowest since the data started being collected in January 2002, the JODI data released Feb. 17 showed.
Nice overlapping bar graphs comparing US Oil and NG Production per region.
https://www.naturalgasintel.com/natural-gas-production-from-seven-key-u-s-shale-plays-to-fall-from-february-to-march-eia-says/
There is a lot of reasons to be bullish on oil at the moment. There is one problem lurking over next 4-5 months though. Treasury will shrink the TGA by about 1 trillion USD. Most assume this will be bullish for most things other than the dollar. But as this cash gets pushed into the economy/markets. Banks are forced to hold more collateral, mainly T bills. Short end of treasury yield curve is without a doubt going negative as banks have to have collateral to except all this cash. Likely another collateral shortage in the making (repo blowup) Fed would likely have to cut QE purchases to get yields back into positive territory. Which is no different than hiking interest rates on an economy with a massive debt load that can’t handle higher rates.
Most of the US government debt is on short end of the curve. Therefore most of the debt will have a negative yield. This would likely end the reflation narrative/ inflation narrative we currently have. It’s likely dollar bullish because the collateral underpinning everything just went negative yield. And if it turns out to be highly dollar bearish. Well lookout oil prices would be well beyond the moon.
Not more than a few months ago Jim Cramer said, and I quote, oil is not investable and never will be again.
Will oil go higher? Yes. Will oil make new lows (meaning minus $30/B)? Yes.
Will either affect society? Probably not.
Economics and finance are gobbledygook at this point. Go find the website of the u.s. debt clock. I don’t have the link handy, but once you get there don’t just look at the headline number. Click some of the other stuff.
Watcher
Those are the type of statements that begin to tell you the bottom is near. Even Buffet has been selling his oil stocks. Surprising since his motto, I thought, was “Buy when there is blood on the street.
Demand in India keeps on falling . Just not affordable . Today’s price of petrol is $ 1.33 per LITRE .
https://www.argusmedia.com/en/news/2188041-indian-diesel-gasoline-use-drops-amid-high-prices?backToResults=true
Interesting article, thanks.
“ Fuel dealers have blamed the decline in consumption on high taxes, which have helped send retail fuel prices to record levels. India’s BJP government has more than tripled gasoline taxes and raised duties on diesel ninefold since it came to power in 2014. …leaving retail motor fuel prices higher now than they were when crude prices hit a record $147/bl in 2008.”
“ But India’s crude import dependency has risen from 77pc in 2014 to 85pc now, despite Modi’s ambitions to cut imports…”
Yes, Roger . Govt can print currency but they cannot print oil . Peak oil is a bitch .
Hole in head,
They could cut taxes on oil and find revenue elsewhere (perhaps higher taxes on wealthier citizens). I imagine you could propose a better policy as you are more familiar with the problems of the nation.
Declining fuel consumption is a feature, not a bug. India has always worried about imports, and the best way to do it is reducing overall consumption.
High fuel taxes are very effective in reducing consumption. European fuel taxes are very effective: light vehicle passenger travel uses about 18% as much as the US, per capita: very roughly 40% fewer kilometers traveled per vehicle, 40% less fuel per km, and 50% fewer vehicles per capita.
Dennis , nothing can be done . Overshoot , LTG and PO are predicaments and India is right in the midst of this triangle . Waste is rampant . The Prime Minister ( big ego) just purchased 2( yes 2 not 1) Boeing 747 last year in midst of the Covid crisis and had them outfitted as Air Force 1. Cost to the taxpayer $ 1 billion . They now sit on the tarmac as all personal meetings are cancelled and discussion is via Zoom .
Nick , reduce consumption via high taxes does not work in India . Europe and USA have the capacity to reduce because they have the infra for public transport .In India the public transport system is in shambles. Hence if there is a reduction in consumption then it is leading to a recession and we are already there . The tax on fuels was raised to cover up the shortfall of corporate, income and sales tax collection which crashed due to Covid . It has nothing to do with an effort to reduce consumption ,though this will occur but the cost will be a deepened recession , loss of income an higher unemployment . Just for your info youth unemployment is now 40% .
By the way, oil products consumption/supply did decrease (oil peak in North Sea in 2004-2005) in Europe and as a result, economic activity is faltering along the decrease of supply/consumption.
A new thread October Non-OPEC oil production has been posted
http://peakoilbarrel.com/october-non-opec-oil-production-resumed-climb/
A new open Thread Non-Petroleum has been posted.
http://peakoilbarrel.com/open-thread-non-petroleum-february-20-2020/