A Guest Post by George Kaplan
Mexico C&C Production
Mexico oil production is in decline though, at the moment, not as steep as it was expected to be (at least by me – IEA predictions are closer).
Data is through June and comes from Pemex and National Hydrocarbons Information Center (CNIH) (both sites are pretty good).
For June C&C was 1870 kbpd, down 25 kbpd from May and 170 kbpd y-o-y. Yearly decline rates for each region are shown in the chart below. Production peaked in 2004/2005 at just over 3500 kbpd, so overall decline is approaching 50%.
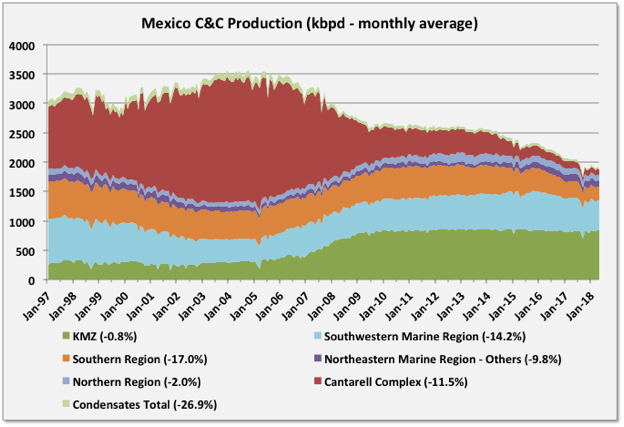
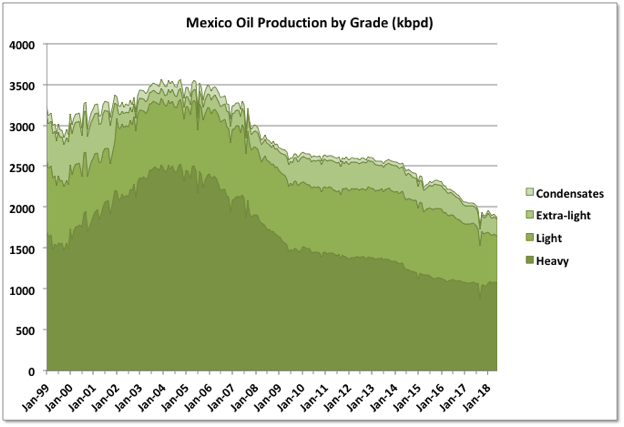
Most of the decline has been in light oil and condensate, with heavy oil holding fairly level.
Ku-Maloob-Zaap
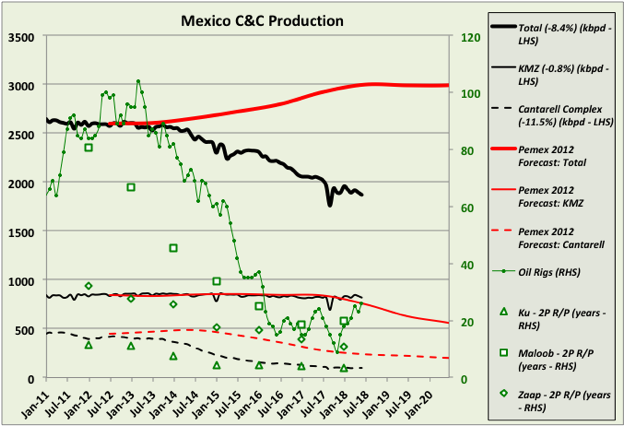
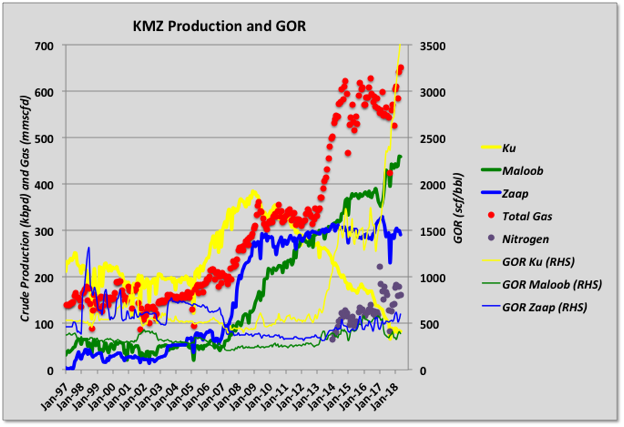
The largest producer is the Ku-Maloob-Zaap complex (KMZ), which has been kept on a plateau, contrary to predictions of a decline starting about now from a Pemex presentation in 2012. The production has been maintained mainly by increasing flow from the Maloob field, and it looks like this has resulted in increased nitrogen production. Ku and Zaap production has been maintained, but the Ku field is getting close to exhaustion now. Ku is a medium oil at API 22°, while Maloob and Zaap produce heavy oil at API 12°. The two types of oil are processed separately so it’s not clear that decline in Ku can be fully replaced by the heavier oil fields, which I think also require more nitrogen for voidage replacement. Nitrogen injection to maintain production there was started in 2014, which was also when overall production came off a temporary plateau and started the current steady decline period. It would be interesting to know how the total available nitrogen is apportioned to the fields; presumably the total available is fixed and therefore so too is the net voidage replacement capacity and hence the total amount of heavy oil that can be produced. The nitrogen gas produced is (again presumably) reinjected so local compression capacity would also be a limit, for example there is still a high amount of nitrogen produced in Cantarell for relatively low oil production and eventually the same fate must befall KMZ.
There’s a six day shut down planned for one FPSO operating on KMZ, which will knock 95 kbpd off, affecting July and August numbers.
Regional Details
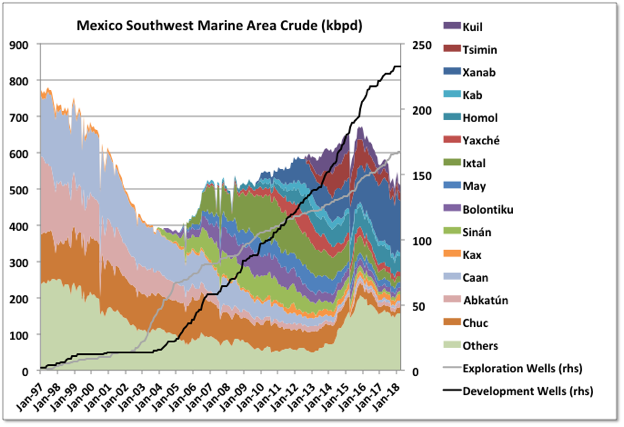
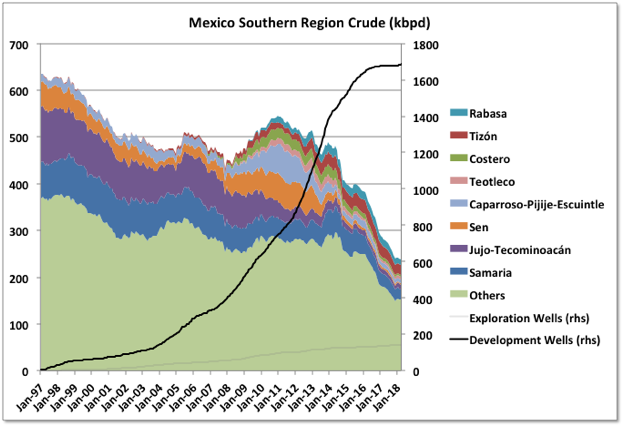
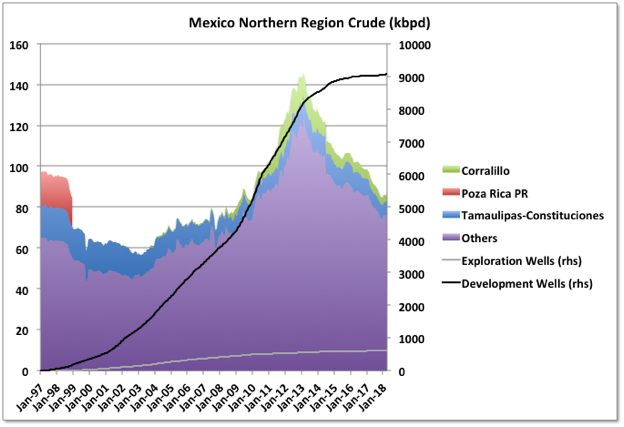
There are four producing regions in Mexico, two onshore and two offshore. The offshore regions are where most of the new drilling and developments are occurring. The onshore basins are mature, show clear creaming curves for drilling, and with few new wells have declines that are steady and almost linear at the moment. Even the two marine areas show evidence that they are in late life stages with declining flow in almost all the fields and creaming of the well numbers. The charts show production stacked but the cumulative completed wildcat and development wells are shown as normal trends.
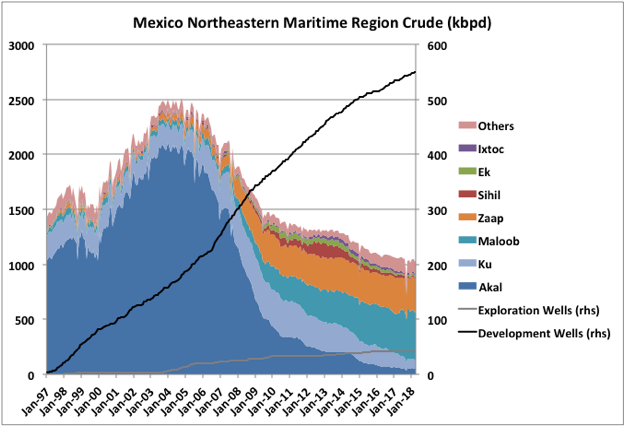
Note Akal is by far the largest contributor to Cantarell, other fields are almost negligible by comparison.
Mexico Reserves
Oil
Remaining Mexico reserves have been falling continuously in all categories for several years. The chart shows estimates for oil reserves with 2P (i.e. ‘proven plus probable’, which is usually the best estimate for what is likely to be ultimately produced), with some of the larger fields highlighted, together with total P3 (‘possible’, which tends to decline to zero as a province plays out) and cumulative production since 1999, when data first became available. The offshore proportion of the 2P reserves is also highlighted. KMZ and Cantarell are still the fields with largest reserves, although Cantarell production is well below what might be expected given that its remaining reserves are nominally still enough to class it as a supergiant (and therefore possibly limited by nitrogen capacity – see above). Ek-Balam has been announced as a redevelopment and Abkatun was a large field, produced mostly in the 80s and 90s and now largely depleted.
The biggest reserve additions this year were for the Amoca, Mizton and Tecoalli shallow fields, which Eni is developing as a fast track project with early production planned for next year and ramping to 100 kbpd in 2021. These fields show 2P total reserves at 413 mmboe, and 3P at 706 mmboe, with most of the ‘possible’ additions being natural gas rather than liquids.
The current overall R/P ratio is a respectable 17 years, representing a rise after fairly consistent slight falls in recent years.
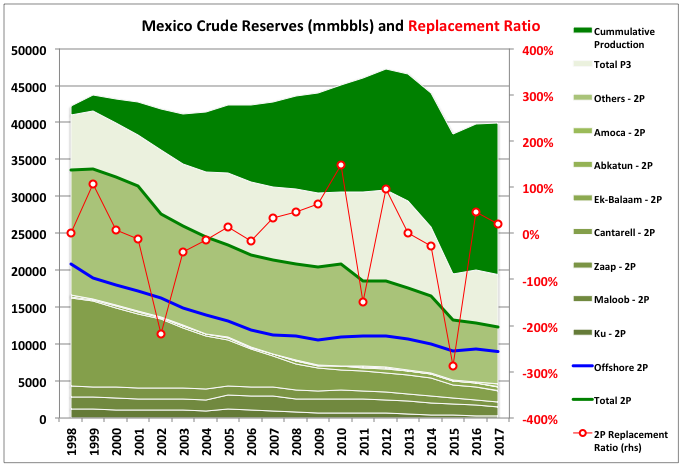
There has been some excitement over the potential for significant deep-water discoveries, but so far there has not been much to show. What discoveries there have been presently only constitute P3 resources, as none of the fields have any firm development plans, and were revised down to a relatively minor 500 mmbbls from 780 mmbbls last year. There may also be some shale oil potential onshore but few exploratory wells have been drilled and I think no reserves booked so far.
Only three years since 1999 have had reserve replacement ratios greater than 100%. Many years’ numbers have actually been negative, some of them significantly so, and the estimated ultimate recovery has been revised slightly downwards overall.
Note I’ve labeled the years against the end date for which the reserves and production apply, which is how most countries report them, but Mexico labels them by the reporting year (i.e. one year later).
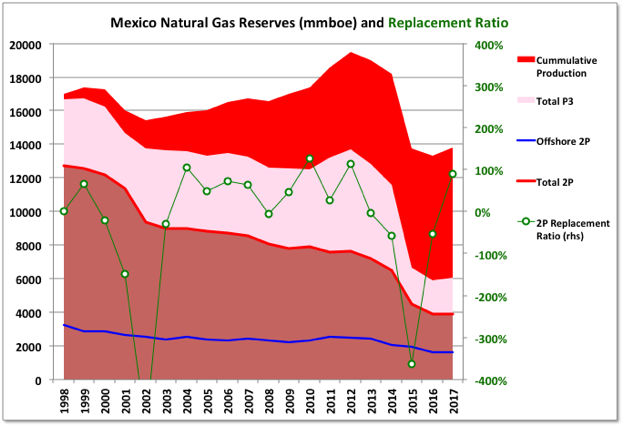
Natural Gas
Natural gas reserves have been declining faster than oil, both for ultimate recovery and those remaining, but flattened out this year because of some onshore discoveries. There might be more discovery potential for gas than oil, with extensions of some of the Texas shale gas plays onshore and the deep water sites maybe turning out to be more gas prone.
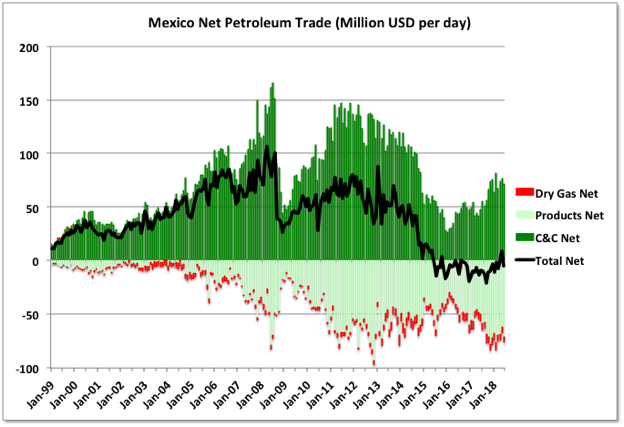
Mexico Petroleum Imports and Exports
As the oil price has increased Mexico has returned to a neutral trade balance for petroleum related goods. The Mexican refining industry is running well below capacity; I think this is mainly because it cannot handle the heavier slate of domestic crude that has resulted as the light grades have been depleted faster, but also from general underinvestment on ageing plant. There have been attempts to open up the Mexico industry to foreign investment, but with limited success and some notably disappointing lease sales, and that effort may now reverse again with a recent change of government. The new Mexican president has said that he intends to end the import of foreign fuel within three years, that is not going to happen by a long way, and reverse the decline in oil production, that is not going to happen at all without several large and easily developed deep water discoveries and even then not in less than five to ten years – in fact some time during his second and third years the decrease from KMZ is likely to get very noticeable
Off Topic Finish
Flying spiders – noted by Darwin on the Beagle. They get aloft by using the atmosphere’s electrostatic fields interacting with static on their silk strands, and use air currents to stay up and move around. They have been recorded as getting over two miles high and travelling a thousand miles. “Life, ah, will find a way.”

https://www.ecowatch.com/mexico-bans-fracking-2592125998.amp.html
Not going to get any shale oil investment this way. Although, if you declare all drilling as illegal, maybe you can get the cartels involved.?
In all seriousness, without a concerted effort by the government to attract investment, México oil and gas production is going nowhere.
On the positive side, capitalism is alive and well in Mexico, so I don’t see a purely socialistic society surviving for very long. My guess.
I lived there last year.
A very politically literate society compared to the US– but that is a low bar.
We shall see.
On the positive side, capitalism is alive and well in Mexico, so I don’t see a purely socialistic society surviving for very long. My guess.
Two observations, one, the drug cartels, like all cartels operate under a for profit capitalistic paradigm.
They may not be recognized under current legal systems and they may appear at first blush to incorporate brutally violent inhumane practices, but on deeper examination they operate much as any other sophisticated multi billion multinational business and marketing operation.
See this TED talk: https://www.ted.com/talks/rodrigo_canales_the_deadly_genius_of_drug_cartels
Rodrigo CanalesatTEDSalon NY2013
The deadly genius of drug cartels
Yale professor Rodrigo Canales in this unflinching talk that turns conventional wisdom about drug cartels on its head. The carnage is not about faceless, ignorant goons mindlessly killing each other but is rather the result of some seriously sophisticated brand management.
And second, unless you happen to be a member of the small group of financially elite beneficiaries of the capitalist system, capitalism sucks big time for the average poor person in places like Mexico and elsewhere. And furthermore as it is currently configured in it’s classical neoliberal incarnation it is destroying the planet. It is obsolete as are most ‘isms‘ and that of course does include socialism, but that, is a separate dissertation!
https://www.youtube.com/watch?v=ZyyfgacCx_c
ESMT Open Lecture with Giacomo Corneo
An open lecture held at ESMT Berlin on January 23, 2018:
Is Capitalism Obsolete?
After communism collapsed in the former Soviet Union, capitalism seemed to many observers like the only game in town, and questioning it became taboo for academic economists. But the financial crisis, chronic unemployment, and the inexorable rise of inequality have resurrected the question of whether there is a feasible and desirable alternative to capitalism. Against this backdrop of growing disenchantment, Giacomo Corneo presents a refreshingly antidogmatic review of economic systems, taking as his launching point a fictional argument between a daughter indignant about economic injustice and her father, a professor of economics.
Worth noting that the minimum wage, in Mexico, for 2018 is $88.36 pesos per day.
NOTA BENE that is pesos per DAY, not hour.
NAOM
Today that comes to 4.65 dollars per day.
Mexican Pesos to US Dollar
Note that despite a drug war killing lotsa young men age 25 or so, the life expectancy for Mexico is only one year less than the US.
Not sure what that says. Maybe superior doctors. How weird is that?
You are way, way overestimating the effect of homicides on the total population of Mexico. Although Mexico’s homicide rate is about three times that of the USA, Mexico’s homicide rate is still only about .15 people per 1,000 people. Or 1.5 per 10,000 people.
That is still not going to affect the overall death rate all that much.
Note that despite a drug war killing lotsa young men age 25 or so, the life expectancy for Mexico is only one year less than the US.
If you watch that TED talk I linked to you might understand that the drug wars are NOT really killing lotsa young men! But that all the violence is rather the result of some seriously sophisticated brand management!
To be clear, I am not in any way minimizing the fact that the violence is very real and young men are certainly being killed! However the actual numbers are much lower than one might think, certainly not high enough to affect national death rates.
It is not in any of the Drug Cartel’s business interests to allow escalating random acts of violence, much less all out warfare among rival factions. The violence is a highly controlled part of their marketing and recruiting campaigns which are employed when they move into any new territory.
Think, Wallmart undermining local mom and pop grocery stores to establish their monopolistic business model as they move into a new territory. The only difference is that Wallmart doesn’t have to depend on actually killing people in the streets because Wallmart is legal and pays taxes…
Watch the video, it clarifies what I’m saying!
If you are not a player, it doesn’t seem to be a problem.
And I have driven the length of the country several times, and being street smart, never had a issue.
Lived there last winter.
Guym,
There is a little bit of a bright spot for Mexico’s oil sales: One of South Korea’s refineries has been upgrading its capacity for refining heavy sour crudes and names Mexican Maya specifically as one that will boost their margins.
The upgrading is to enable the refinery to produce low-sulfur fuels for shipping in order to meet the new sulfur standards the IMO will impose in 2020. It’s cheaper to buy high-sulfur crude if you’re able to refine it. Someone’s looking ahead, anyway.
Maya blend sells better in the US. This could change when the Canadian pipelines reach Houston. The far east refineries seem to have been focusing on Canadian Pacific exports which are hindered by the greens, and some middle east heavies, as well as pdvsa sales in long range trade out of curazao.
Will cartels come to own the shales, or will it be the traditional wealthy class?
Mineral rights in Mexico belong to the Mexican government since 1921.
Which means that Mexico produces a lot less oil than it would otherwise, right?
In the long run, probably more.
We will never know.
How much would the US be producing if it’s oil production was managed like Mexico? Maybe 70% less? Certainly no LTO…
Almost certainly not.
Definitely less.
Yeah. For one example, does Mexico have anything like Shallow Sand’s small operation? Does it have anything like the vast network of stripper wells that provide a large fraction of US oil production?
I have audited, consulted for, appraised properties up for bids, operated properties previously owned by national oil companies in Argentina, Colombia, Ecuador, Venezuela, Russia, Azerbaijan, Kazakstan, China, etc.
In general the state oil companies are inefficient, corrupt, dirty (lots of enviromental damages), have poor relations with local communities, are heavily unionized, drill slow, have political apoointees, etc. PDVSA prior to Chavez was pretty good compared to say the Argentinian YPF.
The Chinese had a huge work force, ancient technology, but they recovered a lot of oil because they seemed to have endless amount of polymers and could produce to really low water cuts.
The worst enviromental damage I’ve ever seen was in former USSR, and Venezuela after Chavez fired 18000 employees in 2003.
This article is two years old but still an interesting read.
Riyadh’s Dirty Secret: Saudi Arabia Thirsty for Yemeni Oil, Gas Reserves
Why does Saudi Arabia continue to bomb Yemen back into the Stone Age? The crux of the matter is that Yemen has oil reserves, while Riyadh is steadily running out of the commodity, American political analyst Phil Butler explains.
It’s always good to review one’s sources: Sputnik is a news agency, news website platform and radio broadcast service established by the Russian government-owned news agency Rossiya Segodnya.
And from a quick look at Phil Butler’s website, he also appears to be a Russian spokesman.
Errrr, and this means that any input on Saudi reserves he gives has to be a damn lie? Or, perhaps he may be far more inclined to tell the truth than someone with Saudi connections.
Well, did I say that?
What I would say is that if you read through their stuff, they have a pretty clear agenda, with some obvious misinformation. And some of the pro-Russia things I’ve seen on TOD have been pretty sad – links to articles by people who claim that the ethnic cleansing in Serbia never really happened, for instance.
So, you have to double check anything you read – you can’t treat it as a primary source of reliable information.
The ethnic cleansing in Serbia never happened. I assume you refer to the Clinton and Blair claims that a genocide was taking place in Kosovo (at that time part Yugoslavia)? That was a lie made up to justify bombing the Serbs because Clinton wanted to show he could help Muslims somewhere on Earth. Sometimes what you think you “know” happens to be the garbage you are fed to make you support the endless wars the US public seems to enjoy paying for.
I was thinking primarily of this:
https://www.hmh.org/la_Genocide_Bosnia.shtml
People tend to confuse Bosnia with Kosovo. The so called genocide was a war crime committed by Bosnian Serbs (murdered 6000 Bosnian Muslims as the UN peacekeepers stood around and did nothing). But that wasnt really associated with Yugoslavia, which had cut off from Bosnia.
The confusion arises because the US pressured to have Milosevic put on trial for the presumed Kosovo genocide. During the trial the prosecutor could not even prove that a genocide had taken place, and this led him to shift the trial to the unrelated Bosnian war crimes. So its easy to get confused.
My nephew spent years digging up and documenting mass graves in Bosnia. The massacres were very real. You’re just inventing lies. I doubt you have any good information.
One of my neighbors is a Serbian refugee from Bosnia. The was a lot of mass killing, and it was the Serbian side who initiated it. For example, the way my neighbor tells it, everything was more or less fine between the Orthodox, Catholic and Moslem communities in the Bosnian village where he lived until some thugs dressed in Serbian army uniforms came in from Serbia (just over the hill) and burned down the mosque and some houses and shot several people. This was the direct result of the Serbian Communists turning fascist to stay in power when their government collapsed. Then the troubles started and got worse and worse. He got the hell out.
He works as a cook in Germany and has built two houses in the village (one for each son). Things are looking up.
Dude, i explained there were massacres in Bosnia, but it wasnt a genocide. The Soviets murdered 15000 poles in a few days at Katyn, and nobody talks of a “Polish genocide”.
You are mixing up terms and locations. The Bosnia war took place BEFORE the Dayton Agreement. Clinton met with the Bosnian contenders and Slobo in Dayton, Ohio, and they worked out a deal which ended the Bosnian war.
Years later, starting around 1997, the Kosovo Liberation Army started a campaign in Kosovo with significant help from Albania. And in 1998 Clinton decided it would be a good idea to ignite a conflict in which he could use bombing to show support for Muslims.
At the time Clinton had taken the Israeli side in peace negotiations, and he feared blowback from the muslim radicals such as Al Qaida. So the Kosovo bombing had to be justified and Clinton with his loyal poodle Blair made up the “Kosovo genocide” and started bombing in March 1999.
Clinton’s bright idea led to the killing of over 600 civilians in Serbia and Kosovo, and this makes Clinton a war criminal. Thus the lie about the genocide has to be maintained at all costs, and you wont read or hear much about the truth.
The fact that the genocide in Kosovo never existed is simple to prove: Slobo spent years on trial in The Hague and was never convicted. They were prepared to extend the trial as long as possible until he died, which he did. This as far as US and UK are concerned, eliminates risks and being exposed as a bunch of criminals.
The blowback over the failed israel-Paalestine peace talks the CIA had warned Clinton about wasnt avoided by bombing the Serbs, and two years later 9_11 happened.
As i am sure you know, the lies and deception arent unique to US democrats, Bush and the media lied about the Iraq WMD, and nowadays we see jingoistic warmongering and all sorts of false flags taking place. Which could take the world to nuclear war, and this in turn will definitely mean peak oil.
Ron,
BP suggests about 3 Gb of proved oil reserves for Yemen. Probably not the reason for the war there, natural gas reserves also not significant at about 0.3 TCM.
Yeah, I realize that. I just thought it interesting that someone else also thought Saudi’s reserves were not what they claim.
Why is Saudi Arabia at War in Yemen?
Criticism of Saudi Arabia’s role in the war against Yemen’s Houthi rebels reflects a fundamental misunderstanding about the Kingdom’s motivations. What drew Saudi Arabia into the conflict was Iran’s effort to build a military alliance with the Houthis – an alliance with only one conceivable target: Saudi Arabia.
Ron,
The 1980 reserve number may be about right for 2P reserves, if the improved technology which has been implemented since 1980 has allowed some reserve growth.
The best we can do is guess. US reserve growth has been about 2% annually from 1980 to 2005 (before tight oil became important).
If we take the 1980 “proved reserves” and assume they are 2P reserves (160 Gb), then a similar reserve growth rate minus 73 Gb of output(BP data) would give about 190 Gb of 2P reserves in 2005. If we further assume all reserve growth and new discoveries in Saudi Arabia stopped in 2005, there are another 49 Gb of output from 2006-2017 and 2P reserves would be down to 140 Gb, if we assume 1% reserve growth from 2006 to 2017, 2P reserves would be 165 Gb at the end of 2017.
All guesses as we don’t know if there has been any reserve growth, an assumption of zero reserve growth and discoveries since 1980 would give us 38 Gb of KSA 2P reserves at the end of 2017, if 2P reserves were 160 Gb in 1980.
Dennis, I am not going to argue with your figures but I must say this. You have a very wrong idea of what reserve growth really is. Reserve growth is a correction of earlier estimates of URR. The reserves of new fields, for companies listed on public exchanges, are usually underestimated for obvious reasons. There are SEC regulations and stiff penalties for overestimating reserves. But after a few years, at most a couple of decades, these estimates are revised upward. This is reserve growth.
However, there is no reason for a national oil company, that is not publically traded to underestimate their reserves. In fact, national bragging rights are what is most important here. National reserves, in this case, are far more overestimated than underestimated. At any rate, after many decades of production, there would be no reserve growth in Saudi’s very old supergiant fields. In fact, since their earlier estimates were likely greatly overestimated, there would be “reserve shrinkage” rather than reserve growth.
I would estimate that Saudi reserves today, would be less than 100 billion barrels. That’s why they are in a panic and putting out statements like the one in this link:
Aramco Ready To Invest To Meet Future Oil Demand
The message: mature oil fields are seeing an increase in declining production rates, and this must be offset by continued investments in the industry if the world is to meet what is thought to be an 1-1.5 million barrel per day annual demand growth rate in coming years.
“To respond to this situation, significant new investments are required in additional capacity and expanded and upgraded infrastructure, as well as the development of pioneering technology to make petroleum energy more sustainable and accessible,” Al-Falih said in his opening message to the 42-page report published on Friday.
What you don’t understand is that reserves don’t just keep growing and growing and growing like the Energizer Bunny just keeps going and going and going. 😉
I agree that national oil companies have no incentive to under report reserves. But, according to l’Histoire de l’Or Noir, When IOC’s controlled M.E. oil fields there was an incentive to under report reserves. That is because during most of that period the big problem was over production. The IOC’s bought the rights to M.E. oil fields, which they did not develop and under reported reserves for those fields to keep competitors from being interested. What I am saying is that under reported reserves in 1970 might have led to under reported reserves in 1980.
I have replied to this comment below where it was wide enough to post a chart.
Hi Ron,
There is the aspect of reserve growth that you give and I agree that is a big part of reserve growth in the first 5 years after a field starts to be developed.
The part you are missing is improved technology and optimization of well placement etc.
In 1980 (before the increases in reported Saudi reserves), BP reports KSA had 168 Gb of reserves.
Also note that on page 378 of Twilight in the Desert, Simmons reported KSA 2P reserves were 177.5 Gb in early 1979. These were based on audited reserves by US oil companies, so the Simmons estimate is likely to be pretty accurate.
Note that the US data is available from the EIA, US reserves grew by 63% from 1980 to 2005 and the US oil fields started development much earlier than KSA so we would expect that if anything KSA reserve growth would be higher than in the US.
Reserve growth from improved technology can be explained very simply.
Let’s assume the OOIP for KSA was about 700 Gb in 1979, cumulative output was about 35 Gb at the end of 1978 and reserves were about 177 Gb for a total URR of 212 Gb (assuming no reserve growth or discoveries after Dec 1978.) Through the end of 2017 about 149 Gb of oil had been produced by KSA which would leave 63 Gb of oil under the no reserve growth and no discovery assumption. (Note that I have switched to EIA C+C data for these estimates).
So 212 Gb 2P reserves divided by 700 Gb OOIP would be a 30% recovery factor if the OOIP estimate is accurate and this is for 1979.
Now fast forward to 2018 and assume for simplicity that there have been no new discoveries since that time for KSA, but that technology has improved over the previous 40 years. Perhaps the average recovery factor has increased to 45% which would give an estimate of 315 Gb(=700times0.45) for cumulative production plus 2P reserves. Note that a Hubbert Linearization for KSA for 1998 to 2017 gives a URR estimate of 325 Gb.
If we take the HL estimate and subtract cumulative output we get an estimate of
325-149=176Gb for 2P reserves at the end of 2017, and typically the HL estimate is very conservative, so this would be my minimum estimate. I do agree the “proved reserve” estimate of 266 Gb at the end of 2017 is too high and might be an estimate of 3P reserves plus contingent resources, and possibly 100 Gb might be a good estimate of 1P reserves.
This remains a guessing game due to the lack of information.
In 1980 (before the increases in reported Saudi reserves), BP reports KSA had 168 Gb of reserves.
NO, no, no! That was not before the increase in reported reserves. That was after Saudi increased their reserves from the 110 GB the Aramco partners had reported a few years before. And those were Saudi reported reserves, BP just reported what Saudi told them they had.
Also note that on page 378 of Twilight in the Desert, Simmons reported KSA 2P reserves were 177.5 Gb in early 1979. These were based on audited reserves by US oil companies, so the Simmons estimate is likely to be pretty accurate.
Well hell, that’s up from 110 GB as reported by the Aramco partners.
Let’s assume the OOIP for KSA was about 700 Gb in 1979,
Oh my goodness! That is some assumption. Where did you get that number?
I don’t think Saudi recovery rate was ever as low as 30%, but that is not really that important. But please tell me what Saudi has done, since 1980, to increase recovery rate that much. Gas injection was introduced at Ghawar in 1958. Water injection began in 1964 to provide additional pressure support. Other than that nothing has been done to increase the recovery rate. Well, they are trying, just recently, CO2 injections in central Ghawar, I don’t know how much success they are having however.
Please see my reply to Schinzy below and past any reply, if you have one, there.
“The part you are missing is improved technology and optimization of well placement etc.” – Mexico, Brazil, GoM, UK – all use pretty sophisticated technology, all have seen level or negative URR revisions on many mature fields and basins since 2007 (and overall for the region). I’m pretty sure Angola and Nigeria would show the same if the data was available.
George,
If we look at GOM discoveries through 1980, in 1980 the 2P reserves were 3 Gb for discoveries through 1980 and 2.6 Gb for discoveries through 1975 as revised by 1980.
In 2016 those same fields (discoveries through Dec, 1980) had produced 7.1 Gb of C+C from Dec 31, 1980 to Dec 31 2016, and for fields discovered by Dec 1975 output was 6.4 Gb from Dec 31, 1980 to Dec 31, 2016.
If we assume most of the reserve “growth” happens in the first 5 years after discovery, then the discoveries through 1975 would give a better estimate of long term reserve growth. So we would have 6.4/2.6=2.46 over 36 years (1981-2016) or an average growth rate of 2.5% per year.
Let’s also consider that maybe a decade is needed for most reserve growth to occur and look at the 1990 estimate for GOM discoveries from 1947 to 1980 (end of year).
In 1990 the 2P reserves for discoveries through 1980 was 1.88 Gb, by 2016 (end of year) those 1947-1980 discoveries had produced 4.15 Gb from 1981 to 2016 (inclusive). So we have 4.15/1.88=2.207, and the growth over the 26 years from 1991 to 2016 is the 26th root of 2.207=3.09% average “reserve growth” for 2P reserves discovered from 1947-1980 over the period from 1991 to 2016 in the Gulf of Mexico.
I used BOEM data from link below
https://www.data.boem.gov/Main/FieldReserves.aspx#ascii
I said since 2007, what you wrote is about something else. See chart below. You like strawmen so you’ll pick out the Mars Uras line – I’ll point out that it has risen becasue it includes new fields of Kaikias, South Deimos and West Boreas in the leases, not from growth of the original discovery.
Chart.
George Kaplan,
Perhaps the “no reserve increase since 2007” could also be considered a strawman. As I was looking at changes in reserve estimates for an entire basin (or nation) since 1980, so looking at how GOM reserves have changed since 1980 seems a better comparison to Saudi changes in reserves since 1980.
I looked at estimates for all fields by year of discovery, I am not choosing specific fields.
Now if certain fields we considered “not reserves” in 1990 and in 2016 for whatever reason those fields are being produced, I would say the initial estimate was revised from non-commercial to commercial and consider this to be a part of “reserve growth”.
You may classify this as a “new discovery”, I consider it a revision of the initial estimate.
George Kaplan,
Correction to comment above: “Now if certain fields we considered ‘not reserves’ ” the “we” should have been “were”.
Took a quick look at 2005 2P original cumulative reserves in both 2005 and 2016 and there was close to zero reserve growth over that period. So I agree there may have been little reserve growth since 2005 and perhaps 2P reserve estimates may continue unchanged (for previous discoveries) in the future.
High oil prices of $150/b as the peak in World C+C output is reached, may result in some possible (P3) reserves and contingent resources to be moved to the 2P category in the future, we will have to wait and see.
The fact remains that 2P remaining reserves for GOM discoveries from 1947 to 1990 were 8 Gb in 1990, and by 2016 about 13.5 Gb had been produced from those 1947 to 1990 discoveries over the 1991-2016 period.
So over the 1991 to 2005 period average annual reserve growth for remaining reserves in 1990 was about 3.56% per year (15th root of 1.69 is 1.0356), if we assume there was zero reserve growth from 2005 to 2016 (which the data shows is roughly correct).
My comment was quite specifically in response to you saying that technology is an answer for reserve growth, there’s plenty of evidence that it might not be. That is not a strawman it is a specific response. Nothing you said afterwards seems to have anything to do with showing technology always leads to reserve growth, especially in mature fields.
George Kaplan,
Can you point out where I said technology applied to mature fields will always lead to reserve growth.
I think you have refuted an argument that was not made.
My point was that just as the US saw reserve growth from 1980 to 2005 (both onshore and offshore) and we might agree that most onshore US fields were fairly mature in 1980, it is possible that the less mature fields of Saudi Arabia (relative to the US) might also have experienced reserve growth from 1980 to 2005 as better technology was applied.
I would never argue that this occurs in every field in every case (or always).
I wouldn’t think that just because there has been little growth from 2007 to 2016 in many basins that one would argue that that must “always” be true.
In addition, technology will reach limits, such that everything that is likely to be found that is commercial at current prices will have already been found. Perhaps in 2007 (the year you suggested) that limit was reached in many areas,
perhaps there was a reason reserve estimates increased from 1990 to 2005 in the Gulf of Mexico besides the application of better technology such as an increase in oil prices, no doubt any possible explanation would have multiple factors.
The proposition was no more than better technology applied to an oil basin will sometimes result in an increase in reserve estimates.
I think it was the case that the Saudis applied a great deal of improved technology from 1980 to 2005 to their oil fields, this may have led to an increase in reserve estimates.
We can only speculate.
“The part you are missing is improved technology and optimization of well placement etc.” – that is a fairly general comment, I shouldn’t have said always maybe, but then in my original comment I didn’t. I’m really not interested much in historic growth on old reservoirs, those arguments don’t apply to mature fields which have had all the net growth they are going to get or new deep water fields (and so it will turn out on LTO, I’m pretty sure), and growth (+ve or -ve) is different between every field and always has been, both in reasons and final outcome, as was pointed it in one old USGS paper and a couple of SPE (or similar organisation) ones (and I don’t have access to those now in case you ask), and despite the other, incorrect USGS paper that you will now quote at me.
George Kaplan,
I agree. Newer fields may not grow at all or they may grow much less than older fields.
Looking at GOM data it seems there was a fair bit of reserve growth (or an upward revision of older 2P reserve estimates) from 1990 to 2005 and almost none from 2005 to 2016, perhaps from 2007 there was none at all (I didn’t check).
There is the possibility that technology will continue to improve and that oil prices will continue to rise and that might result in overall reserves being revised up. For individual fields there will of course be variation in whether reserves are revised up or down and the reasons for those revisions. Also “new discoveries” are often satellites of older discoveries that were either missed by older technology, or thought not to be commercial with older technology, so in some cases what is a revision and what is a new discovery may not be very clear.
I also agree that many of the older reserve growth papers by the USGS were not very good, but it seems clear to me that there has been considerable reserve growth in the past for whatever combination of reasons and even for very mature fields (such as in the US) in well searched areas with the best available technology that there has been reserve growth (US from 1980 to 2005 2P reserves grew about 60%).
We could consider KSA 2P reserves in 1977 at 177 Gb and that they might have grown by 60% from 1978 to 2005 to 283 Gb, at the end of 1977 KSA cumulative C+C output was 32 Gb, add this to the 283 Gb that 1977 2P reserves might have grown to by 2005 and we would have 315 Gb, pretty similar to the HL URR estimate of 325 Gb.
That would require no reserve growth after 2005 and would also assume there were no new discoveries after 1977. In fact there were about 45 named fields discovered from 1978 to 2000 in KSA based on Twilight in the Desert, though not all of these discoveries are oil fields and we don’t have 2P reserve estimates for these discoveries. They may simpy fall in the contingent resource category and might never produce any oil. Potentially there could be some new technology devised that might allow further increases in reserve estimates in the future, or that might not occur.
The fact that there has been almost no reserve growth for the past 11 years in the US GOM during a period when oil prices were quite high by historical standards does not bode well for future “reserve growth”.
In addition as the World moves on to non-fossil fuel energy (after 2050 or so), oil prices may fall (along with the price of coal and natural gas) and fossil fuel reserve estimates might be revised lower.
Invading Yemen for oil seems like a facile explanation. Deep in their hearts, no matter what the numbers say, the Saudis can’t imagine a world where thy are filthy rich on oil. They are invading Yemen to play regional power politics like Saddam did.
If they seriously thought the oil might run out some day, the y would act like the Norwegians and conserve it.
The Saudi prince running the show is a bit nuts. Wants to control the peninsula, and eventually extend his realm all the way to Damascus. Yemen has shiites putting up fierce resistance as the Saudis with US help are committing atrocities and war crimes. The US tax payers are footing part of the bill in wear and tear of tankers used to refuel Saudi fighter bombers, and the US personnel used to help the Saudis find targets, which seem to include buses full of children, water plants, and other strategic sites.
Ron,
Saudi Arabia is planning, or at least looking at, building an oil port in Yemen in the SE of the country, near the border with Oman.
The article is at OilPrice, the source is Al Jazeera.
I really don’t think that is going to happen. At least not as long as they are at war with each other. They may have had those plans a few years ago. But obviously, you cannot build an oil port in a country you are bombing and blowing up their school buses and killing their kids.
U.S. Realizes Its Bombs Are Killing People in Yemen
The conflict has been described by the U.N. as the world’s worst humanitarian disaster and many outlets have reported on mounting civilian casualties incurred by the Saudi-led campaign of airstrikes. Citing local journalists and munitions experts, CNN reported Friday that the bomb used August 9 in an alleged Saudi coalition strike that killed up to 54 people—most of them children in a school bus traveling in the northern Yemeni city of Saada—was provided by the U.S.
Mexico oil production is hanging on a thread. KMZ offshore basin is all that is holding production. Once nitrogen injection can no longer hold pressure in Maloob and Zaap, then its all downhill for another drop of 500k in 5 years. If deepwater offshore auctioning isn’t working out, then Obrador needs to do the opposite of what he said during the election (about closing out foreign drillers).
Why does Mexico use nitrogen pressure rather than water flooding in their fields? Could water flooding drive out further reserves later?
NAOM
Water flooding doesn’t work on the heavy oil fields. I remember one of their reserve write downs was because they had assumed some extra recovery by using it which didn’t work out.
Im definitly not an expert but I think thats because of the density of water and heavy oil. Normal oil swims on water, but heavy might sink down.
So if u pump water in a heavy oil field the water starts to go on the top and u only get dirt water out of your well.
Idk it, im just guessing.
Am I right or wrong?
At API 10 the oil and water densities are the same, Mexico heavy oil is a bit lighter but the density difference is still very small so the settling effect is small. The efficiency of water flood also depends on the reservoir properties (porosity, permiability etc.) and other oil properties. I don’t know all the ins and outs for Mexico, I think they would have used natural gas if they’d had enough, but didn’t.
You have to account for reservoir oil properties. A. 12 API oil with say 100 ft/bsto at reservoir temperature swells and gets to say about 0.92 grams per cc density. Reservoir water tends to be saltier than sea water, so its say about 1.05 grams per cc.
Injecting water can work if the reservoir is fairly homogeneous, but some of those offshore mexico carbonates are dual porosity or really heterogeneous, so water bypasses the oil.
If the oil column is very thick its feasible to inject a gas at the top, and produce wells low in the oil column. This can be done at a really slow rate to get a gravity drainage set up. So what they are probably doing is letting the oil move down by gravity and living with a high nitrogen to oil ratio.
There is a term in petroleum engineering when dealing with displacement flooding called mobility ratio. This is a ratio of the reservoir fluid vs. the fluid used for displacement, and a big factor in this ratio is fluid viscosity. 12 API gravity oil is very heavy and has a very high viscosity. For an analogy, think of pushing molasses with water. It is not going to work very well.
The nitrogen is used to form and fill a gas cap for gravity drainage. It is a very efficient, but relatively slow drive mechanism. Air contains 78% nitrogen so it is available anywhere and I am sure they have installed air/nitrogen separation on site.
Thanks guys, that has helped me to understand it. Quiet_one, ISTR they moved some gas generation from Cantarell to KMZ some time back, not completely sure about that.
NAOM
The air separation plants are onshore (they are really big pieces of kit and large energy users), The N2 is piped to where it’s used. I would imagine all the off gas treatment and reinjection is local offshore.
That is a great explanation. Even I can follow that one.
Supplemental information: we have found that fractional flow curves using viscosity ratios and rock relative permeability properties do not account for field performance, which tends to be slightly better than predicted. This has been confirmed in large laboratory cells as heavy oil fields under waterflood. However, the effect isnt about to put water injection ahead of nitrogen cap gravity drainage. What would really help those mexican fields would be injecting a slug of CO2 and chasing it with N2.
I’m curious. How does that work?
NAOM
How does what work? Heavy oil outperforming the classic fractional flow estimates, or injecting a co2 slug in mexico?
“What would really help those mexican fields would be injecting a slug of CO2 and chasing it with N2.”
That is what caught my curiosity.
NAOM
notanoilman:
We find that supercritical CO2 can be placed in the reservoir, where it dissolves the lighter ends (it has a harder time dissolving the high molecular weight molecules). As the CO2 slug moves through the oil region it picks up a ton of oil molecules. To reduce the amount of CO2 used, since this is a top down process it helps to chase the CO2 with nitrogen.
This works better before the nitrogen has penetrated to the producing wells, but the gravity process should help. Its important to keep that CO2 as light as possible, and that could be a problem.
Ahh, thank you very much. That is a clear explanation that helps me understand the process well.
NAOM
https://oilprice.com/Energy/Energy-General/Trump-Administration-Embraces-Energy-Dominance-Agenda.html
This has to be the most confused concept, yet. We have enough oil, so we don’t need to import??? I’m lost in this thought. Or, is it really thought? Perry was right, they should have killed EIA, before it started affecting everyones’ brain. Now, we have everyone walking around like zombies, spouting “Energy Dominance”! Even Perry has been assimilated. Resistance is futile.
I’m just waiting for them to tax renewables to subsidise fossil fuels. 🙁
NAOM
That memo is so off-base that it will have no impact.
https://oilprice.com/Energy/Energy-General/PDVSA-Settles-With-ConocoPhillips-In-Desperate-Bid-to-Stop-Decline.html
See how long this lasts,
Im working hard to get Maduro dethroned by early 2019. It depends on about 10 individuals some of whom may have been turned. So cross our fingers.
I used to be able to calculate the price of gasoline by the price of WTI divided by 20. At $65, the price would have been close to $3.25. I’m not sure why I used 20 but the price was close to that at the pump 4 to 5 days hence back then. Recently, I’ve been observing the price of gasoline has been a lot less than that factor, in the $2.60 to $2.75 range. To me, it seems low. Is gasoline demand lower? What am I missing?
Maybe you moved to Texas?
Texas initial production is out. 88,859,650 oil, 10,062,524 condensate. I received the pending file early, and am estimating daily production at 4364kb for June. The second month production totals for May were at 4210k, and EIA had 4243. That is damn close. I was about 50k over EIA in my first estimate. Pending file is slowly going down. So, I am guessing a pretty good increase for June (about 120k). That makes a 400k increase from Texas since December, last month NM was up 114k since December. So, Permian less other Texas declines? would be 514k (plus NM increase for June) the end of June. Should be interesting what happens after June.
Sorry Guym, great analyzsis, but cna you maybe dumb it down a bit? I do not understand what you mean with “Permian less other Texas declines” for isntance?
On another note, JODI data is out…. I like to look at Saudis inventories there. Crude is now mainly flat for the last couple o moonths, however oil products are dropping quite a bit (and this counter seasonal)
Texas doesn’t report Permian production, only total production. There are a bunch of other production other than the Permian that in the past few years have had slowly declining production. I’m assuming most of Texas increase comes from the Permian. However, it may be higher, or lower than total Texas change due to other fields, including the Eagle Ford.
Texas reports only production with an official lease number in what they give to the public. The other amount reported to the State is included in a “pending lease” file. Compounding this problem is that operators can report their totals within about two months. Historically, over the past few years, I have found that the total of the pending lease file and the regular production reported matches up to eventual final production and EIA monthlies fairly closely. For $10 a month, Texas RRC will supply you with a text file of the most current pending lease data for years back. Just takes unzipping the file, converting it to excel, and some sorting and totalling. It’s actual Texas reported production.
Alternatively, EIA uses a combination of operator reports (914 reports) and drilling info data. Probably, drilling info reports are more accurate, as the pull their data from RRC, and do their own estimates for the current month, like me, only better, because they do it by lease. Or, the ones they have, anyway.
EIA maligns RRC by stating that they use other sources to estimate Texas production, because it takes the RRC up to nine months to report production, because of late reporting. Which is total BS. They are using RRC data that comes from drilling info. I am a royalty owner, and any of us would be pretty upset if we did not have payment within one month on existing wells, or within two months on new wells. Late reporting of production is probably the number one reason RRC would shut down an operator. It happens, but not as much as portrayed by EIA.
The increase in production from the first month reporting and the second month is now around 350k bbls a day. That’s using both the production report and the pending data file. That is not a constant number, but it is what I currently use for my estimate using the first month reporting of production and the pending data file. It was over 50k more a couple of months ago, but goes down as RRC transfers production from the pending data file, when production is decreasing, or remaining close to flat. That’s why my estimate last month was 50k higher than EIA, and 70k over the second month reporting of RRC data. My current month estimate is always going to be a little off, because of that. However, we are only looking at about one percent on the current month estimate, as of last month. In 2016, when things slowed down, the difference between the first month and second month ran closer to 100k, and one month was zero.
I am guessing that another 100k will top off the Permian until later this year, when another 200k of pipeline will be available. That’s about all, until the fourth quarter of 2019, when the first larger pipeline could be available.
The EIA estimates average US production to be 10.8 million a day for 2018, and 11.7 for 2019. I am guessing it will be closer to averaging 10.55 for 2018, and under 11 million for 2019.
They are estimating that Permian will reach 1.2 million in increase by the end of 2019, other shales increase by 600k, and GOM will increase by 200k. After averaging around 800k for most of 2019, we may see another 200k increase in the Permian toward the last quarter of 2019. Or, we may see operators not increase much when the extra 200k of pipeline is added later this year, opting to lower discount rates, rather than increasing production. Other shales may be up 300k later next year, depending on oil prices. If they stay where they are, don’t expect anything. According to George, expect a decline out of the GOM, not an increase, and Alaska is not looking so healthy, either. So, on an average per day, EIA is probably over estimating by about one million barrels a day through 2019. Their current weekly estimate of 10.9 million may be good sometime much later.
We may see a demand decrease with all the tariff BS, and oil price increase. However, I fail to see how a drop in demand can come close to the decrease in estimated production from the US at around one million, plus the probably one million from the Iran fiasco. Canada is going nowhere fast. According to Ron, who knows a hellava lot more about SA, than I, SA is not up to the task. Batman is just a figment of the imagination, not reality.
Guym,
Are you serious? Batman isn’t real? 🙂
I imagine higher oil prices will be the result of dropping inventories as consumption outpaces C+C output by 2019, this will lead to a reduction in oil consumption and possibly an increase in output (relative to a scenario where oil prices remain at current levels or lower). There could be output increases from Iraq, Kuwait, Saudi Arabia, Brazil, and Canada in response to higher oil prices. If consumption(demand) doesn’t fall enough, prices just continue to rise until the market balances. Oil that is not produced is not consumed, high oil prices will make other energy sources for transport more attractive and hybrids, plugin hybrids, and other high MPG transportation will sell better as we gradually transition to EVs and possibly natural gas vehicles. Maybe urban and suburban consumers will demand better public transit.
Iraq and Kuwait, possibly. Although, Iraq is having some pretty serious internal problems to work through, first. As to SA, Ron, and many others think that would be whipping a dead horse (there ain’t no Batman, Virginia). Brazil has been expected to produce more for quite awhile, and still not much happening. Canada? Their pipeline problems far outstrip the Permian problems, and for them, there is no end in sight. But, I do quickly agree that the public will have strong interest in public and private transportation that is not traditional ICE, because prices will be…higher.
Article regarding Brazil. Doesn’t look like the immediate future per this article. Big time in the future after 2020.
https://oilprice.com/Alternative-Energy/Solar-Energy/Brazils-Opposing-Energy-Views.html
Supposedly a lot more rail cars will become available in the second half of this year, so Canada could see some gains in output if not profit.
Guym,
Short term I agree. Over the next 5 to 7 years we could see things change for OPEC, Russia, Brazil, and Canada as oil prices rise and see a bump up in output as more investment occurs. Also by 2020 the pipeline bottleneck in the Permian will be less of a problem and there is room for more output from the Permian, in addition other tight oil plays in the US could also increase output as oil prices rise.
So there is the potential for the market to adjust, though no doubt this will hurt the poor everywhere. Unfortunately, the poor always get the short stick.
While we may or may not be seeing peakoil, depending a lot on how the demand side goes, we might well be seeing peak exports. One way that could show up is added trouble in emerging markets that are importers – GDP declines or slowing growth, currency issues, talks of austerity, increased fuel subsidies (whatever reduces oil demand), all of which have sprung up in the last couple of months.
THE NORWEGIAN CONTINENTAL SHELF: SHORT-TERM BOOM WITH LONG TERM WORRIES
https://www.rystadenergy.com/newsevents/news/press-releases/Norwegian-Continental-Shelf-Short-term-boom-with-long-term-worries/
I think this is the first article I’ve seen from one of the consultancies that hints that the decline in discoveries might be a bigger problem than just lack of investment that will get solved in the next cycle. Norway drilling has probably been affected less than most places but discoveries have dived.
https://www.zerohedge.com/news/2018-08-20/chinese-oil-imports-iran-surge-beijing-shifts-iran-tankers-bypass-sanctions
Talk in there about Iranian Insurance of their own tankers going to China, as China completely ignores US sanctions. They essentially ignored President Obama’s sanctions as well, but there has been several years of 5+% consumption growth since then. Now they can’t even pretend to comply.
As for insuring the tankers, basically they are self-insuring, and it’s sometimes like people don’t realize the significance of what they’re saying.
Kazakhstan – I don’t know what is happening here, not heard anything??? They also seem to have a refinery down (approx -100 kb/day). The chart is for illustration of outage only.
https://pbs.twimg.com/media/DlHDn2bXsAAwPqB.jpg
Saudi Arabia Domestic Demand (crude oil + products) in June
Up +140 kb/day from May 2018
Down -250 kb/day from June 2017
Down -517 kb/day from June average (2014 to 2017)
https://pbs.twimg.com/media/DlH0QvVX4AAle1u.jpg
Saudi Arabia Net Exports (Crude Oil + Net Total Products) in June
Up +442 kb/day from May 2018
KSA mostly imported
Gasoline 313 kb/day
Fuel oil 425 kb/day
https://pbs.twimg.com/media/DlH0ljHX0AAH4k_.jpg
Saudi Arabia – Closing Stocks (Crude Oil plus Total Products)
https://pbs.twimg.com/media/DlH5KWwXoAYae96.jpg
It is noticeable how Saudi domestic demand for both electricity and fuel is receding. I can think of three reasons on top of my head; subsides on gasoline (and maybe similar products, I have not checked it) was removed in january, the economy is in recession for a number of reasons and there have been some efforts to reduce reliance on oil based power plants. I don’t know if domestic natural gas supplies are sufficient and how fast the plans to increase natural gas power plants and solar power based electricity are proceding however.
Btw, the road is open for KSA to take advantage of using Saudi Amarco’s increasing downstream presence (advanced refineries) to supply sulfur free fuel for shipping, while serving summer electricity demand based on solar panels and natural gas turbines. Wonder if they execute the plan?
What I am saying is that under reported reserves in 1970 might have led to under reported reserves in 1980.
Why? That makes no sense. What Saudi did was greatly increase their “proven reserves” in 1980, from 110 billion barrels to 170 billion barrels. When Saudi took over from the Aramco partners, they immediately, with a pencil, increased their “proven reserves” by 55% to 170 billion barrels. And since then they have increased their “proven reserves” by another 100 billion barrels. And since 1980, they have produced about 130 billion barrels of oil. Are you kidding me?
Saudi Arabia’s oil reserves: how big are they really?
Since 1980, the Saudi government has been the sole owner of Aramco. From 1982, detailed field-by-field information about the company’s reserves and production has been restricted.
Saudi Arabia began reporting to OPEC that its “proved” reserves stood at around 168-170 billion barrels of crude oil.
The Saudi figure was much higher than the 110 billion barrels of proved reserves reported by the Aramco partners a few years before.
Hi Ron,
See pages 325 to 332 of Twilight in the Desert for some of the things that have been done to increase the rate of recovery. Also note that Simmons suggests a range of recovery factors of 20 to 45% for the best fields in KSA (page 267), I just took a number in the middle for average recovery factor.
There are a number of new technologies which have been applied such as MRC wells which may result in less bypassed oil and higher recovery rates, in addition more drilling over time leads to improved estimates of total 2P reserves, in theory they should decrease just as often as they increase. In practice, petroleum engineers tend to be very conservative in their estimates and 2P reserve estimates tend to increase more than they decrease.
I don’t think the Saudis are reporting “proved reserves”, they simply changed to 2P reserves in 1980 and then in 1989 to 3P reserves. The HL for 1998 to 2017 suggests 325 Gb URR with current 2P reserves of about 175 Gb, if we assume no future reserve growth or discoveries.
I was looking at BP Statistical Review for reserves, yes the 168 is higher than the 110 proved reserves reported by the US companies, I have never believed that OPEC reserves were 1P reserves (as reported by BP starting in 1980).
The “quota wars” may have simply been a matter of these countries reporting 3P rather than 2P reserves, or using very optimistic estimates for recovery factors.
Saudi HL chart below, URR=325 Gb for estimate based on 1998 to 2017 data for annual production divided by cumulative production (aP/CP) on the vertical axis and cumulative C+C output on the horizontal axis, the trendline crosses the horizontal axis at 325 Gb which is the estimate if the output curve follows a simple logistic function.
Note that if KSA followed a logistic output function with URR of 325 Gb then cumulative output would reach 50% of URR in 2020 at an output of about 10 Mb/d.
Generally this Hubbert Linearization estimate tends to be too low as the output curve generally does not match the logistic function very well.
Dennis, I am not arguing what Saudi’s recovery rate is, or was. What I will argue is that you assumed Saudi could increase its recovery rate from 30 to 45%. I am sorry but there is not one iota of evidence that they have done any such thing.
Ghawar Oil Field
Gas injection was introduced at Ghawar in 1958. Water injection began in 1964 to provide additional pressure support. The field’s current extensive injection system utilizes water pumped via pipeline from the Qurayyah Seawater Treatment Plant which processes about seven million barrels of Persian Gulf seawater per day.
So just how did Saudi manage, since 1980, to increase their recovery rate by 15%?
Also from that same link:
The field was estimated to contain about 70billion barrels of remaining oil reserves and 90trillion cubic feet of natural gas reserves at the beginning of 2013.
So 70 billion barrels of oil at the beginning of 2013, that would mean about 60 billion barrels left today. But Saudi claimed 266 billion barrels of reserves at the end of 2017. That means that Ghawar, with 60 billion barrels is producing half their oil and the other 206 billion barrels of reserves is producing the other half. That just don’t make any sense.
Ron,
Increased recovery factor is one possibility, the other is increased OOIP, only the Saudis know the specific actions they have taken, as well as what the reserves, and output are for specific fields.
I have often seen the guess that Ghawar produces 5 Mb/d, again Simmons gave output as 5.2 Mb/d in 2003 based on a Saudi publication. Perhaps output has remained 5 Mb/d from 2004 to 2013, my guess is that this figure remains a guess.
Note that we do not know what Ghawar output was in 2013, but based on the HL estimate 2P reserves would have been 194 Gb at the end of 2012 and if Ghawar has 70 Gb of 2P reserves and the estimate does not increase in the future, that would be 36% of remaining Saudi reserves at the end of 2012.
Note that page looks like it was published in 2014, so we don’t really have an estimate for more recent Ghawar output, but if we assume output has remained steady at 5 Mb/d, we’d have 61/175=35% of Saudi 2P reserves are Ghawar reserves at the end of 2017.
We agree that the 266 Gb given by BP is too high, my estimate is 175 Gb or more and yours is 100 Gb or less. Jean Laherrere estimates OPEC 2P reserves as a whole (excluding extra heavy oil in Venezuela) are about 300 Gb less than the “proven reserves” given by BP (as of 2011), but I don’t think he has broken this out by individual OPEC producer (that I have read). If we did the breakdown proportionally, Laherrere’s estimate would be about 150 Gb for KSA 2P reserves in 2011. Assuming no reserve growth or discoveries since 2011, there has been about 20 Gb produced by KSA since 2011 and 2P reserves would drop to 130 Gb at the end of 2017 for Laherrere’s estimate, closer to your 100 Gb estimate than my 175 Gb estimate (which includes any future discoveries or reserve growth).
Also note that if reserves did grow by 1.4% per year for 20 years (or a combination of discoveries plus reserve growth) then Laherrere’s 130 Gb 2P estimate would increase to 175 Gb by 2037 (the 175Gb would be 2P reserves at the end of 2037 plus cumulative output over the 2018-2037 period.)
Increased recovery factor is one possibility, …
No, increased recovery factor is not one possibility. You cannot keep making that claim unless you show some evidence. Saudi has not implimented any new recovery techniques in the last 40 years.
there has been about 20 Gb produced by KSA since 2011…
No, I added it up. From January 2012 through July of 2018, Saudi produced 23,924,627,000 barrels of oil. Let’s just call it 24 billion. And that’s crude only, and does not include condensate, not to mention other liquids.
Also note that if reserves did grow by 1.4% per year for 20 years…
Once again, reserves do not grow. Estimates are simply revised upward. But they could, and often are, revised downward. Saudi’s old supergiant fields were revised upward in 1980 by 55% and then revised upward again by in 1989-1990 by about another 70%. Those old fields did not grow their reserves by one barrel during either of those massive increases. All that massive growth was engineered with a pencil.
Laherrere’s 130 Gb 2P estimate would increase to 175 Gb by 2037…
It simply blows my mind, Dennis, that you assume reserves will simply keep growing and growing and growing. And at 1.4% per year no less. At that rate, reserves would double every 50 years. Hell, we will never run out of oil because reserves will just keep growing and growing and growing.
Engineering is magic to you huh?
I want you to 100% verify your claim that Saudi has done no engineering or science on their fields in the last 40 years. You demand everyone else back up their claims, now it’s your turn.
I’ve worked fields discovered in the 60s and left for dead. We revived them, and recovered 4 times the initial total production. The original operators misunderstood what they had and lacked the technology to do what we did.
It wasnt BS or magic, but proven reserves did increase by 300%. This happens all the time. As geologists and engineers learn more about a field we find more. Who would have thought that diligent application of the scientific method would be so fruitful?
Do you distrust all science, engineering and medicine, or just the disciplines you don’t care for?
TinyTim, you are just full of it. The American partners in Saudi, before they sold everything by 1980, had the best engineers in the field. Back then everything was open, not a deep dark secret as it is today.
But only reserves are a deep dark secret today. Recovery methods are not a secret and never have been. What has been done, and began over two decades ago, was massive infill drilling with horizontal wells, to cream the top of the reservoir because all the old vertical wells were watering out. That is because recovery projects, unlike reserves, are performed by outside contractors who have no such reasons to keep secrets about their contracts. In fact, they want to advertise them in order to get more investors.
A few years ago they did start CO2 injection in Uthmaniyah, the field in south-central Ghawar. They said “Injecting CO2 into Uthmaniyah will boost oil-recovery rates by 10 to 15 percentage points,..” That was written in July 2015 but not a peep has been heard since then. We don’t know how successful that venture was but we do know that no outside contractor has received any new contracts for any other such projects anywhere in Saudi.
All we do know is Saudi has suddenly shut down any news of the success or failure of the Uthmaniyah CO2 injection project. The project began in 2013, so five years later we should have some results.
So TinyTim, I have told you everything that is publically known about Saudi reservoir enhancement projects. So unless you know more then let it be known or shut up.
17 years ago I reviewed development well proposals for a field in Venezuela, and approved two, the second contingent on the first one. A few weeks later I get called to a meeting where they were about to confirm the selected surface spot where the location was supposed to be built, and found they had placed it about 150 meters from a house.
I dont like ruining relations with land owners, so i told them they had better move it away from the house, and i started getting protests from the construction manager, because the spot they had chosen was ideal as far as he was concerned.
I told them to arrange a meeting with the land owner at his house, that we would go over with the construction and field managers, a drilling engineer and a geologist to jointly decide where to put the darned well.
Prior to the visit i had the subsurface team get me map overlays showing the surface topography, structure and net pay so i could put them on the legal plats and aerial photos. And i noticed there was a really good spot much further from the house, located on a flat spot with excellent drainage towards a small creek. To make it even nicer, the spot was located where the fence made a right angle, so the location would be tucked in with a property fence on two sides.
I had them give me our standard pad layout, put it on the map, and picked a spot exactly 150 of my paces from the two fences.
The day we visited the farmer we asked him if he thought the current stake was to his liking, and he politely said it could be further away on account of the noise.
Then i told him, what the hell, i think we can find a spot where theres oil, and told everybody to follow me. I picked up a long stick and started walking around, got to the fence, and walked back 150 paces, turned 90 degrees and walked 150 paces to the other fence, all the time waving the stick in the air and stomping the ground with my boots.
So i had them put the stake where i had made the turn (which i knew was a good spot after reviewing the subsurface maps), and told them the oil was there, to prepare the location, and drill the well.
Imagine the hub hub in the field when they heard i was picking a location with a stick and stomping the ground with my boots. The hub hub was even louder when several months later the well came in at a bit over 2000 BOPD, about triple our average rate. I had them so faked they started questioning whether we needed geoscientists or reservoir engineers as long as i had my stick.
That is funny! My grandfather, who had his own independent drilling company, told a story of a black box years ago. Which was retold by an Uncle who had a geology degree. Some immigrant (I think I remember Dutch) would walk around with the secret box, and point where to drill. He was successful more often, than not. He was supposed to be a local legend in Texas and Okla at the time. But, you have an oil deviner stick.
Good one, Fernando.
A friend of mine with the USGS long ago would help land owners in the Great Basin locate water wells (when the property contained an alluvial fan) by a similar show, ending one third of the way up from the center of the fan margin and saying “Drill here.” That location would be along the midline of the canyon the fan built out of, in the groundwater pathway.
Ron,
I used EIA C+C data for KSA from Dec 2012 to Dec 2017 to get the 20 Gb estimate (mistyped 2011), from Dec 2011 to Dec 2012 it’s 22 Gb. US reserves grew by 2% annually on average from 1980 to 2005. Note that I didn’t say 1.4% forever, just 20 years.
If you want a lower growth rate we could make it 50 years, then the average growth rate in reserves would be 0.6% per year.
Yes reserves do not “grow” like a tree. The reserve estimates are revised to a “larger” number. We can call it something other than “growth”, but often if something increases over time, people call this “growth”.
Of course estimates get revised up and down, but just like the stock market there tend to be more ups than downs over the long term for reserve estimates.
The Saudis have implemented many technological innovations to their fields from 1980 to 2017, Matt Simmons covered many of them in Twilight in the Desert which you probably have a copy of. I have given you several page numbers as a reference, pull it off the shelf and read.
I have no evidence that recovery factor has increased, or that OOIP has increased, only the Hubbert Linearization which in many cases has tended to underestimate URR, the HL points to 325 Gb for Saudi URR for the 1998 to 2017 EIA output data.
There might be discoveries or reserve growth, but the HL suggests about 176 Gb of output after Dec 2017.
Of course estimates get revised up and down, but just like the stock market there tend to be more ups than downs over the long term for reserve estimates.
Dennis, I cannot really believe you did not think this thing over before you wrote the above sentence. No, no, oil field reserves are nothing like the stock market. The stock market can go up, and up and up. Oil in the ground cannot. If someone is pumping it out, it can only go down and down and down. It can never go up if someone is draining it down.
While it is true that new fields often have very conservative reserve estimates and are subject to upward revisions, that is just not a quality of old fields. Old fields and all but a couple of Saudi fields are well over half a century old, have had their reserves estimated, as close as possible, many years ago. Now their reserves can only go down, never up, unless they are being recharged from the center of the earth. 😉 Of course, if you are just making up reserve numbers, with a pencil, then they can always go up.
About Hubbert Linearization, shutting down all the vertical wells and replacing them with horizontal wells, right along the top of the reservoir, will, and has, dramatically decreased the decline rate in production of those old fields… until now. That will cause the HL to give a much greater estimate of reserves than actually exist. In the next few years, you will see a definite downturn in the HL slope.
Ron,
There is a concept called “original reserves” which is the sum of cumulative production and remaining reserves. Over time the estimates of original reserves sometimes increases and sometimes decreases, but I agree it will not increase forever, it will reach some limit.
All of the things that have been done to KSA fields to increase output have been done to fields in the USL48 onshore and a Hubbert curve has been followed relatively closely (if tight oil is excluded from the HL analysis).
In short, I think you are wrong about future output from Saudi Arabia, (I believe Matt Simmons also came to an incorrect conclusion).
We will just have to wait and see, it’s more likely in my view that the HL will underestimate the URR as it has in many cases in the past at the World level, with estimates like 1800 Gb (1998), 2000 Gb (2004), 2200 Gb(2011) and currently about 2500 Gb (2017) for crude plus condensate minus extra heavy oil (possibly about 500 Gb by Jean Laherrere’s estimate).
I estimate about 100 Gb for World tight oil URR (50 Gb from US) and 2800 Gb from C+C-XH-LTO where XH=extra heavy oil (500 Gb URR) and LTO=tight oil. I assume about 1% per year average reserve growth from 2018 to 2040 with no reserve growth beyond 2040. I assume oil prices start to fall due to insufficient oil demand after 2040. This may lead to the bend in the Hubbert curve that you foresee, but it will be due to a fall in oil prices as we transition to other sources of energy that have become cheaper than fossil fuel.
All of the things that have been done to KSA fields to increase output have been done to fields in the USL48 onshore and a Hubbert curve has been followed relatively closely (if tight oil is excluded from the HL analysis).
No, that is not exactly the case. Infill drilling using horizontal wells was introduced in the USA in the early 80s, well after the US had peaked. (Before shale of course.) From 1988:
Infill Drilling Using Horizontal Wells: A Field Development Strategy for Tight Fractured Formations
Infill drilling using horizontal wells is a relatively new concept as a field development strategy. A comprehensive reservoir simulation study has been conducted to compare horizontal shale wells with vertical shale wells for infill drilling and virgin reservoir development in Wayne County, West Virginia, an area where vertical well gas production has been historically high and no permeability anisotropy is thought to exist. This study compares shot vertical wells with both stimulated and unstimulated 2,000 ft (610 m) horizontal shale wells for infill drilling and virgin reservoir development.
Infill drilling has been used extensively in the US For many decades. I have seen oil wells in Long Beach California, in 1959, spaced only a few feet apart. But those were vertical wells of course.
I am going to give this subject a rest right now Dennis. But I am preparing several paragraphs for publication in my OPEC August Oil Production post next month.
I am not sure who can claim to be the expert on oil reserves in KSA, given all the unknowns. If I were to guess the Laherre estimate of 150 Gb of 2P reserves in 2011 seems reasonable. KSA has actually produced accumulated 150 Gb by now and that means we are above 50% exploitation of reserves and that seems about where I suspect they currently are. Not counting reserves that require very high oil prices. (I am sure the Saudis have some shale oil or other reserves that I do not know of to exploit at a certain price; I suspect the neutral zone is high cost oil.) This is the point where the struggle to keep production levels begins. They are struggeling to keep a plateau and all the signs are there that the major powers know this and are covering it up as we speak. I think most of the giant fields are in terminal decline by now, but production overall is still holding up. Better recovery factory is most certainly contributing to the longevity of key fields; but if I had to guess, also fast track exploitation of minor fields found in the key North East region could be an explanation why production is keeping up. A field with a couple of hundred million barrels of reserves can be exploited with a number of horizontal wells producing from multiple oil bearing zones to give 100 kbpd for a few years before a steep decline occurs for example. And there are very probably a dozen or so minor fields around Ghawar alone; that is what the Saudis have reported themselves and if knowledge of other key basins are to be of any guidance – that is the case in KSA also.
What about the other 4 countries? The exact 100 Gb for Iraq in 1988, that just happened to be above Iran’s number was a complete fabrication on Sadam Husseins orders. Every year where new reserves exactly equal production cannot be right. Where Iran and Iraq, and even UAE, have been using IOCs (a good few of whom have walked away) there’s been nothing to support claims of continuous discoveries, growth or even small field developments – really the opposite.
My impression is that the potential in Iraq was very substantial and under exploited due to Saddam Hussain’s rule there. The fact is that there are discoveries made in South Iraq even in 2017 (Rosneft).
https://oilprice.com/Energy/Energy-General/Rosneft-Discovers-Oil-Field-In-Iraq.html
There are also some fields on the border of Iraq/Iran that are cheap oil, where there has been a lot of focus the past few years. The kurdish region is underexplored and some field are complex but oil rich. Sunni areas in the north are underexplored due to distance from export ports initially and resentment to Shia rule once that got in place (2005). Much heavy oil is still not addressed. The East Baghdad field (10-15 billion barrels) and the Shaikan field in the kurdish region (at least 8 billion barrels oil in place, probably more). The question is how to get infrastructure to develop it and is the price right?; and do they really want to sacrifice east Baghdad along with the best agricultural areas to develop oil?
In Iran there is a big potential due to a couple of multi billion fields still not addressed, and some of the old giant fields needing modern technology. Or so I heard, it is far away from home – so the information can be wrong also.
When it comes to UAE, I have no idea. Same with Kuwait. I just assume they have problems due to their limited geographical size
There is no great conspiratorial secret being kept about Saudi oil reserves.
Too many people would know about it. It is a secret that could not be kept.
Very few people will know the full story. All reservoir results will be kept under the highest security – at least three levels: restricted building access, locked office, safe. There are likely to be frequent cyber attacks to get the information so it will be under the tightest computer protection and surveillance that Aramco has.
Each field will have it’s own reservoir model and each model a range of runs from which the final prognosis is assembled. Nobody will know what is happening in all the models. Only the very upper management will get all the results and the decisions and assumptions that go into them, and they are unlikely to really appreciate much of it, not from lack of ability, just because there is so much. Release of results will be tightly controlled and need the highest level of sign off.
Ron, no way Ghawar has 60 billion barrels left. We don’t know how much it produces now, but it appears to have dropped to around 4,000,000 bpd capacity by 2017 according to a 2017 report by Energy Intelligence.
At 4,000,000 bpd its 1.46 billion per year, or 41 years flat. Northern areas are already severely depleted by many accounts, production seems to be declining, even with the disciplined application of all modern technologies available. What do they do after gas injection, massive waterflood, geosteered maximum reservoir contact wells?
I know hard data, is not available to any but the KSA top dogs, but it appears they have less than half of Ghawar’s recoverable oil left. Probably a lot less than half.
Dclonghorn, you are probably correct. We will likely know soon. Saudi peaked, so far, in 2016. They will not breach that peak this year and I doubt they will do in next year.
An alternative chart for Saudi Arabia. Perhaps a plateau at 10000 kb/d +/-500 until 2023 or even 2028.
Dennis, your data is from the EIA, I think. Mine is from the OPEC MOMR, secondary sources. Yours is C+C, mine is crude only.
However, if you zero base your chart, the slope and data would look almost exactly like mine. A bit higher of course because yours includes condensate. And the peak on both charts is still 2016.
Ron,
Your chart is very different from most other charts you post which very rarely have a zero scale. Maybe you show charts with increasing output with a zero scale and those with decreasing output with a non-zero scale. 🙂 I was trying to be consistent with your typical chart, condensate output is not all that significant for KSA, the EIA data is easier to pull up for me.
Yes 2016 is the peak, just as 2012 and 2005 were previous near term annual peaks at the time, we know why 2017 was lower as OPEC was reducing output to reduce excess World crude stocks, 2018 also is likely to be less than 2016, but 2019 may be higher if oil prices rise to $80 to $85/b as I expect.
We will see.
Most of the time I show charts that are not zero-based in order to amplify change. But if you wish to show consistency over a long period of time, then a zero-based chart is better.
Concerning OPEC production, there are more things affecting OPEC production than just the price of oil.
Ron,
I think it is better to be consistent with the type of chart one uses to avoid the appearance of bias. As to oil price, ceteris paribis, higher oil prices tend to result in higher output in any given field under the same conditions, compared to a case where prices were at some lower level.
The assumption that “all else is equal” never proves correct in practice, just a simplification often made for comparison.
Oil prices are not all that matters, but they matter nonetheless.
Overseas reserves have seldom been estimated using SEC rules. We simply wiped our butts with the SEC, which had an ancient bean counter set of rules. After the Shell fiasco the SEC wanted to play hard ball so we had to explain to their consultants what real life was about, and they modernized their rules.
https://oilprice.com/Energy/Crude-Oil/Spending-Boost-Fails-To-Raise-Production-In-The-Permian.html
Permian- more cost, less production, more DUCs. Faces decorated with eggs.
Guym,
The message I get from that piece is that companies are getting ready for next year so they can hit the ground running when the pipeline bottleneck is removed. Output has not decreased, it is just rising more slowly than capital expenditures. No point in completing wells if there is not pipeline space to move the oil, so they are building pads and other facilities and drilling wells, but waiting on completion.
So far this year Permian tight oil output has increased by 478 kb/d, an annual rate of increase of about 820 kb/d. The annual rate of increase from Jan 2017 to July 2018 has been about 829 kb/d.
Output has not decreased, productivity has. There’s a lot in that article. Yeah, DUCs are increasing for next year. Late next year. Conoco is the only company that I read about, that said we do not intend to expand much in the Permian, until they get the infrastructure in place (pipelines). They started running out of pipeline capacity the beginning of the year. I don’t know about you, but if I was a CEO, I’d feel like an absolute idiot for not figuring that into the plans. So, for another year, they get to feed the DUCs.
Many a show and tell from the operators, is how they have brought down costs. Now, I have tell everyone that costs are higher than before. That will never go into an annual report, as it makes the CEO look like an idiot.
The companies are not making the production per well that was hyped. Er, maybe we should not include that in the annual report, either.
That’s what I got from the article.
You don’t want people to say you wound up with egg on your face, so you tell them you have decorated your face with egg. It was your intent to look better. Spin.
Guym,
I don’t follow the dog and pony shows given by the oil companies, I just look at the data from the EIA, OPEC, and shaleprofile. I guess everyone interprets information differently, what I see in the article is that output has not risen as high as previously projected because fewer wells are being completed than was projected. It is also probably true that the average completed well has lower EUR than the ridiculous well profiles that are typically presented to investors, but I always dismiss those as hype and smart investors do the same and look up the information at drilling info, frac focus or shaleprofile.com.
The average well productivity in the Permian basin has not decreased, also no decrease in the North Dakota Bakken, or the Eagle Ford, or the Niobrara all based on Enno Peter’s presentations at shaleprofile.com.
I also ignore the estimates by the EIA’s drilling productivity report as I think that model is poorly done.
Dennis, respectfully, you need to stop whatever you are doing and go seek help immediately. In an effort to be the eternal optimist, or the staff contrarian, you are losing all credibility with regards to analyzing anything oily in the world. I have no charts, or I would stick them…here.
Guy is basically right, there is nothing good to draw from this article whatsoever and the author is one of the best there is. All costs in the shale biz are significantly higher than EVER before. Well productivity is declining, not from takeaway restraints but from well interference, increasing GOR and depletion. Profitability has NOT improved thus far in 2018, the Permian unconventional oil industry is still outspending revenue and interest rates are on their way up, up, and up. If anybody is spending $3.5MM to drill DUC’s and not paying back debt, they too need to seek immediate help. You have become the King of Debt on POB and are discounting completely the role that debt will play in your lofty supply demand economic theories. Rune has just written something very good on that and Art has good data now regarding declining gasoline consumption in the US due to higher prices. That is all debt related, man. You have gone freaking chart bonkers.
And why argue what the KSA says about its reserves? Its their oil, they can say whatever they want to about it and no dumb ass American is going to change it. Right here in the good ‘ol US of A, reserve reporting under the ever watchful eye of the SEC, is embarrassingly awful. Shale oil EURS are exaggerated by 30% or more. We now lie in America way better than the Saudis ever did and… get this: a lot of people believe it !! Ahem.
Take two aspirin and call me in the morning.
Thanks Mike. Best comment on this Blog in the past three months.
I have to take everything with a grain of salt as a lay observer, and I respect Dennis’ comments immensely; but, yes, Mike’s comment is terrific.
I too respect Dennis’ opinions. Just not that one. America needs to be having a come-to-Heyzuz meeting about its hydrocarbon future and the fluff about shale oil, and stupid stuff like “we no longer need to conserve America’s oil resources,” needs to stop.
Hi Mike,
I agree we need to conserve oil resources and don’t believe I have ever said anything to contradict that.
I have also never said that high levels of debt is not a problem. What I have done is combined economic assumptions with well output data, USGS estimates and well completion assumptions to look at debt. Reasonable assumptions suggest the debt problem is manageable and the level of debt is likely to be reduced in the future.
I assume oil supply at current prices will not meet demand in the future and oil prices will rise.
The EUR that I use for my models is based on hyperbolic decline fit to the data from shale profile, when the hyperbolic reaches about an 8% decline rate I assume exponential decline until the well reaches 8 b/d and assume it is no longer profitable to produce at that point.
I further assume that new well EUR starts to decrease starting in Jan 2019 (a guess obviously) and the rate of decrease is consistent with USGS TRR estimates and total wells drilled of 120,000. Economic assumptions are then applied where wells that have a discounted cash flow that is positive (nominal annual discount rate of 10% assuming 3% annual inflation) will be completed based on cost and oil price assumptions. I assume average well cost (full cycle) is $9.5 million in constant 2017 $.
For the average Permian producer there is very little evidence that average well productivity has decreased.
Chart below from Enno Peter’s shaleprofile.com
https://shaleprofile.com/2018/08/07/permian-update-through-april-2018/
Then act like it old man. You never actually say anything of substance. Its all just rants and insults. Never any data. Never anything.
Religious nuts have no place in rational discussion and you are clearly driven by ideology. You should try a few years of drilling oil wells before you speak.
See, I can do it too! Its so easy to not have to ever defend my ramblings!
We could collect all of Mike’s comments into one book and sell an ebook as “The Mullet’s Guide to Not Investing in the Texas Oil Patch”.
Well profile for Permian basin used for my model (Jan 2017 to Dec 2018 only) earlier and later well profiles are lower. Earlier well profiles are matched to output data from shaleprofile, later well profiles decrease at a rate determined by number of well completions per month (higher well completion rates result in steeper rates of decrease in new well EUR relative to lower well completion rates).
Below we have the cumulative net revenue in billions of constant 2017$ (left axis) for a Permian Basin tight oil scenario with “medium oil prices” (shown on right hand axis) and 93,000 wells completed from 2010 to 2041 (no completions after that date). Economically recoverable resources(ERR) are 30 Gb (assumed TRR is 36 Gb) from 2010 to 2079. Peak output in 2023 at 4770 kb/d for Permian tight oil output (conventional oil not included). By 2043 cumulative net revenue is 500 billion 2017$, all debt is paid off by 2027, assumed annual interest rate is 10% per year. Maximum Brent oil price is $113.4/b in 2017$ and is reached in Feb 2027.
The TRR scenario has 115,000 well completions based on a TRR that is roughly 3 times larger than the North Dakota Bakken/Three Forks (about 11 GB) where many analysts assume about 40,000 wells will be completed, the number of wells completed when economic assumptions are added reduces total well completions from 115000 to 93000 for the “medium oil price scenario” considered here.
Mike,
Notice on the chart above how my model shows cumulative debt continuing to increase (cumulative net revenue becomes more negative) from 2018 to 2021, also keep in mind that the 10% interest assumption is likely to be much too high because we should use “real” interest rates (interest minus inflation), so the 10% interest rate assumption I used is really like a 12.5 % nominal interest rate (assuming an annual rate of inflation of 2.5%), that’s why my initial model uses a 5% real interest rate which would be equivalent to a 7.5% nominal interest rate. The model does all costs and prices in “real” or constant dollars so the real interest rate is the appropriate measure.
Even my low price model where oil price only rises to $80/b by July 2022 and remain at that level until 2073 (in 2017$) and has a lower ERR of 22 Gb and only 55000 total wells completed and peak output of 3650 kb/d in 2020, debt gets paid off by 2025 and cumulative net revenue rises to 130 Billion 2017$ by 2031. In this case the 5% real interest rate assumption is used (7.5% nominal annual interest rate).
Mike,
What is your basis for “productivity is declining”, based on Enno’s data I just don’t see it.
I realize that there are some that predict there will be a decline when wells reach bubble point, but so far there is little evidence that this is a widespread current problem in the tight oil plays in the US.
From Enno Peters:
Average initial well productivity in the oily basins did not change much over this period, as shown in the ‘Well quality’ tab.
https://shaleprofile.com/2018/08/20/us-update-through-april-2018/
Dennis, I have to work for a living but I don’t want you to think I criticized you and don’t have the balls to respond to all your hours of research arguing with me. I got it. And all the charts. And the models. And the criticism directed at others for guessing, which is all you EVER do. Have you ever seen the back in of a drilling rig in your life? You gotta balance about 500 oil well check books to even be allowed to analyze the oil industry, IMO.
Look, even the EIA seems to thing productivity is declining in the Permian. Goggle it. I get the full meaning of Enno’s work, all of it, including this: “all shale oil wells drilled in America before January of 2016 now only account for 27% of total LTO production.” Let that sink in a minute.
You embrace debt as thought that is an acceptable thing in the world we live in today, and especially from the shale oil industry, and though you want to be un-hinged from fossil fuels as much as any of the permanent residents you have on your blog, rational ones they are, one and all, you believe strongly in the shale oil industry’s ability to pay down its debt, improve its dismal financial performance, and deliver the goods it has promised to America. Its very confusing, actually. And hypocritical. I guess when the shale oil industry says past performance is not indicative of future results, you believe them.
I think, really, all you are doing is defending your damn models.
This fella Cunningham is a smart cookie. Listen up: https://oilprice.com/Energy/Crude-Oil/US-Oil-Data-Has-Markets-Confused.html
Mike,
I think we may be using “well productivity” differently. I am talking about the new well EUR, which looks to be relatively stable lately, you may be talking about overall output per well. This has levelled off in 2018, but only a very slight decrease so far in output per horizontal well completed (total output/total wells completed). The EIA reports new well oil production per rig which has decreased for the Permian, but that is a different measure which shows how efficiently rigs are being utilized, not quite the same as well productivity.
I agree Cunningham is good and that piece is very good, it points to potentially higher oil prices and a slow down in the Permian in the short term as profitability is not as good as other basins due to high price spreads in Midland. Other tight oil basins might see a higher completion rate as capital moves to where there are greater profits.
I appreciate the criticism as it improves the models.
Absolutely correct that the models entail assumptions (guesses) about the future.
A big assumption is the well profiles, which we have limited data on and have to make “guesses” about the future production of those wells in order to make any claim at all about whether they might be profitable in the future.
Note also that the tight oil models are based on the work of two people you respect, Rune Likvern (using his analysis of the North Dakota Bakken [both production and debt] and applying it to other tight oil plays in the US) and also based on the great resource provided by Enno Peters at shaleprofile.com (from this data I estimate the well profiles).
The analysis of cumulative debt in the Permian basin was inspired by the post linked below by Rune Likvern (see figure 1)
https://runelikvern.online/2017/10/08/a-little-on-the-profitability-of-the-bakkennd/
Note that in my model it is acknowledged that there is quite a bit of debt in the Permian basin, if oil companies continue to drill wells that are profitable (discounted net cash flow over the life of the well is greater than zero) at “assumed” future oil prices, then debt gets paid assuming nominal annual interest rates of 7.5% (assuming 2.5% annual inflation rate).
Note that the “low oil price scenario” is quite conservative and also note that I have assumed the full well cost of a new well was $9.5 million starting in 2010 when in fact the well cost has only risen to that level relatively recently.
As to an eventual transition to other sources of energy, even if one believes that climate change is not an important issue (that’s not me, but others might have different views) fossil fuels will reach a peak in output and the World will need to deal with that problem. I do not use investor presentation data at all, I base my models on well profile estimates from Enno Peters data and then use a model based on the earlier work of Rune Livern, James Mason, and Paul Pukite to estimate potential future output. The economic analysis is applying what I have learned about the oil industry from Rune Likvern, Shallow Sand, Fernando Leanme, and you. TRR estimates by USGS and David Hughes are used as a starting point, then economic assumptions are applied to reduce TRR to ERR.
I can send you the spreadsheet with the model, just email me if you are interested.
You had wondered about a Noble prize for prediction the date of the peak accurately (clearly tongue in cheek), but although a precise date is not important, knowing a rough date so we can plan ahead would be a good idea imo.
Guessing with models is preferable to hand waving in my opinion as it allows one to clearly state the underlying assumptions of the model (all guesses) and to vary the assumptions to see how the model results will change.
This is the basis for my “several scenarios” approach and I always invite others to suggest changes in the assumptions.
In fact, you have suggested a well cost for the Permian Basin of $10.5 million in the past. Using that assumption with all other assumptions unchanged and the low oil price scenario (oil price rises to $80/b in 2020 and remains at that level until 2070) we get a new scenario.
The scenario has 55670 wells completed and 19.8 Gb of output, debt is paid back in full by 2032 (7.5% nominal annual interest rate) and by 2035 cumulative net revenue in constant 2017$ is $40 billion. Debt reaches a maximum in 2020 at $142 billion (2017$), but it is paid out of cash flow by 2032.
Many have claimed the debt will never be paid back, the model suggests otherwise.
Chart below shows model vs data from Jan 2012 to July 2018, the discrepancy after Feb 2018 was possibly due to an underestimate of future wells completed made in March 2018 for Feb 2018 to July 2018. The model simply uses well profiles and wells completed to estimate output, the data model match is fairly good (this is an application Rune Likvern’s “Red Queen” model).
The estimate of 27% of tight oil output being from wells completed before Jan 2016 I am well aware of. The Permian model below has about 20% of output in June 2018 from wells completed before Jan 2016, so that is not a revelation to me, already in the model.
Note that one can be concerned about the future and also want to eventually be less dependent on fossil fuels while trying to provide rational analysis for why tight oil output is likely to peak in 3 to 9 years under widely varying assumptions about TRR and oil prices.
If we know what is coming we can try to prepare and devise rational policies to mitigate the worst effects of the coming potential crisis.
In my mind that’s what its all about.
The only drilling rig I have seen up close was to drill a 250 foot water well at my camp, probably would look like a Tonka truck (or smaller) next to the rigs you work with.
Not a lot of oil wells drilled where I live.
As I have said before the EIA’s drilling productivity report is not very good, does it look like average well productivity is decreasing based on Enno Peter’s data? All of the major tight oil basins have remained close to the high average well productivity achieved in 2017, that is just a fact based on Enno Peter’s data and he states it plainly in his US update (which I quoted before).
Yes you are correct that I accept reasonable levels of debt. Do you realize that along with too much debt being bad, that too little is bad as well? The reason for the GFC and the Great Depression was a lack of credit availability, this kills the economy.
Can there be too much debt?
Absolutely. At a societal level, it is probably when total debt to the non-financial sector (both public and private) is three times higher than GDP. Below that level is better as it gives society room to deal with recessions, though typically the private sector deleverages during a recession and this reduces debt, the government needs to take on debt in these cases to right the ship. Public debt should be paid down when the economy is doing well, rather than reducing taxes and creating greater public debt.
I am concerned about public debt, private debt is up to individual people and businesses and their lenders.
https://en.wikipedia.org/wiki/Gross_domestic_product
Note that the sale of an existing home does not increase GDP except for the services that are part of the sale (realtor fees, appraisal fees, lawyers fees, and other transaction costs), a newly built home increases GDP by its full cost (including the transactional costs of the sale).
I did not get past, what is the New well EUR? How, exactly, is that calculated? The only way I have ever guessed at it, was to wait until about the third year’s production. It’s fizzeled quite a-bit then, and a closer estimate can be made.
Guym
3 years of data is better. One can get a rough idea by comparing first 12 or 24 months of data with older wells that have 36 months of output. Typically I fit a hyperbolic using least squares.
Guym,
The trick is to use solver under data analysis, a data analysis package might need to be installed to use this.
You set up a column with model minus data. Take the sum of that column then solver is used to minimize that sum as it varies 3 Arps hyperbolic parameters, q, D, and b.
Email me if you want a sample spreadsheet.
The only problem with applying mathematical projections to rocks, is it is not all the same. Neither is the drilling, over time. There are so many variables that could be included, that are not, when you use hysterical data. The Eagle Ford and the different parts of the Permian are vastly different, but each area has its own unique properties. But, let’s take the Eagle Ford for example, as I know a little bit more about it. It covers a lot of counties in the oil window. Let’s just look at tier three areas, as it has the most areas to drill in. That’s what we are using to apply hysterical data to, mostly. Pure wag, but let’s say it represents 80% of the area left to drill on. Although, most of it has “technically recoverable” oil, it may be at a price that is not feasable. Most of it has not been drilled as much as the tier one and two from which we derive our hysterical data. It definitely is not all the same. Are we going to recover 100k EUR, or 40k EUR? Do we have enough area to drill a 5000k ft lateral, or a two mile long lateral? Or, if we drill a two mile lateral, will we pick up enough good rock to make it a tier two well. Or is it a tier three area, simply because old drilling techniques were used, and it is actually a tier two area? But, that rock is not going to give a damn about mathematical models. It is going to give up, only what it has. We an estimate 2 Billion barrels, left, or five billion barrels, but the reality is, no one knows. I think it easily has 2 billion left, and the rest will be hard to get to, and depend on oil price.
The past forty years, I have been an accountant. The majority of those years were in auditing. We applied statistics to a lot of the tested data to derive assurances. I was only assured on a very micro level. Much of mathematical applications assumed that we were considering most everything, which was never the case. Sometimes, it wasn’t even close.
Guym,
Have you read “Drilling Deeper”? I use that analysis as the basis for a realistic ERR for the Eagle Ford.
You are absolutely correct that there is variation within the play, but an analysis on 15,000 individual wells is a little too much for me.
I use the historical data (don’t usually use the funny data 🙂 ) and just consider the playwide average. As the average new well EUR starts to decline, we will see this in the data, so far looking at the data from shaleprofile.com no decrease in new well EUR is apparent.
Note that my model assumes new well EUR will begin to decrease in Jan 2019, but clearly we wont know if that guess is correct until Jan 2020 (we would need at least 12 months of data to see this).
In addition we may be pulling some of the EUR to earlier months with more proppant, and frac stages and we might see thinner tails for newer wells.
Some petroleum engineers (including Fernando and someone at shaleprofile.com) have suggested that this is fairly likely.
In any case fitting a hyperbolic well profile to the data for the first 24 to 36 months (or more months for older wells) with exponential decline at about 9% per year when the hyperbolic decline rate falls to that level is the best approximation I can make. As I often say the future is unknown, the best we can do is develop a model with assumptions clearly stated, far from perfect, but better than hand waving.
Thanks Dennis for the transparency, explanation, patience, and all the effort. It is very much appreciated.
Hickory,
You’re welcome.
Thank you.
Kazakhstan gives a daily production number on their Energy Ministry’s website. According to that production has been falling but there is still nothing in the news about it. And I’ve started to wonder if maybe something has gone wrong with the website and it’s just reporting a random number??
chart https://pbs.twimg.com/media/DlMBCOiWwAAXiuz.jpg
(The website says C+C but comparing to JODI Data I guess it’s C+C+NGLs)
Doesn’t look random (or good news for the operators). More like a planned reduction because of some outside constraint (e.g. downstream plant offline and storage filling up, or loss of compression which is handled by short term flaring but then plant shut down if the problem isn’t fixed quickly). Complete guesses though. There’s a site somewhere that tracks world flaring which might show something but I can’t find the link now.
The last time that there was an outage Bloomberg mentioned it in an article but so far not heard anything and production has been lower for longer this time.
The refinery seems to be coming back online
https://pbs.twimg.com/media/DlNDkZtWsAE_j3Z.jpg
Saudi Aramco, apparently there was an audit of their reserves in preparation for the Aramco IPO. It says Baker Hughes was involved???
2018-04-29 DUBAI/LONDON (Reuters) – An audit of Saudi Aramco’s oil reserves – an essential part of the preparatory work for its planned initial public offering – has found the state oil giant to have higher reserves than it previously reported, sources familiar with the matter told Reuters.
Two sources, speaking on condition of anonymity, said the independent external audit has found the proven oil reserves to be at least 270 billion barrels, which is slightly higher than the 260.8 billion barrels the company reported in its 2016 annual review.
Dallas-based DeGolyer and MacNaughton, and Gaffney, Cline and Associates, part of Baker Hughes, are involved in the auditing, sources have said.
Baker Hughes and DeGolyer did not respond to a request for comment.
https://in.reuters.com/article/saudi-aramco-reserves/audit-finds-aramco-oil-reserves-slightly-higher-than-reported-sources-idINKBN1I00D2
Did they pay for the audit? I’ve found that audits often show the results the customer is looking for. Its not quite a science. More like a combination of fishing and editing.
“In no way should these results be construed as a true representation of the ‘real’ ….”
au·dit
NOUN
an official inspection of an individual’s or organization’s accounts, typically by an independent body.
VERB
conduct an official financial examination of (an individual’s or organization’s accounts).
“companies must have their accounts audited”
They audited their books! I have no doubt that they found exactly what Saudi had on their books. But that is likely to bear no resemblance to what field reserves actually are. At any rate, it is entirely possible that Saudi could have doctored their books in anticipation of the audit.
How would one go about actually checking the remaining reserves in Ghawar? Or any of the other Saudi fields?
Dipstick??? Seriously, they are both oil consulting companies. Hardly an audit. Just high priced consultants. Key phrase is high priced. Nobody is going to jerk their consulting license if they accept the high price, and give SA what they want. If SA runs out of oil tomorrow, the worst that could happen is the companies say, whoops, missed that one.
Statistics Canada keep changing their website, and they have revised their inventory figures down by -5 million barrels for the last few months. If you just added the latest number to your spreadsheet you wouldn’t know that May is a new high.
https://pbs.twimg.com/media/DlMWrVMXcAA4t6-.jpg
Japan, inventories increased (crude oil + products) +3.61 million barrels week/week. Inventories seasonally rise into October as it is off-peak there.
https://pbs.twimg.com/media/DlMJectX4AE2EG_.jpg
India Crude Oil Imports, higher oil prices and fuel prices but crude oil imports are higher than 2017
July up +505 kb/day over July 2017
First 7 months 2018 up +325 kb/day over same perriod 2017
https://pbs.twimg.com/media/DlM-CewW4AEsSiJ.jpg
https://pbs.twimg.com/media/DlM-VhnW4AAjd_b.jpg
Obviously, higher prices are crushing India’s demand.?
India had a consumption problem last year derived from the government trying to stop use of cash. It was a month or two.
They’ll be back to 6+%.
Blast from the past.
http://crudeoilpeak.info/wp-content/uploads/2015/12/Total_OECD_Oil_stocks_Oct2015.jpg
Because the past five year average is so distorted, I found one before that. Now, imagine what will happen if there is not enough oil to build inventory during normal builds. From its high of 3100 summer of 2016, it’s down to below 2800, now. Over a two year period, that implies an average draw of 4 million a day. Slowed the past year due to US production increase, which is on a hiatus for another year. If the US growth is slowed by a million for a year, and Iran sanctions knock another million off, and we have any demand increase, at all, for 2019, then it looks pretty pathetic.
You haven’t heard, the Saudi’s have reserve capacity up to 12 million barrels a day.. how come you don’t believe them? hahaha Do you think oil hits $100 by summer of 2019?
AdamB,
No I don’t think in the short term KSA can go any higher than 2016 for 12 month average output and they probably will never reach 12 Mb/d, perhaps 11 Mb/d by 2025 at most imo.
Guym,
“that implies an average draw of 4 million a day”
I think you made a calculation error. -300 over 2 years is approx -0.4.
Yep, my bad. Too many decimals for my head.
EIA has confirmed API draw, but they added another 100k to production. We are back to 11 million. It just won’t go away.
2018-08-22 (Reuters) – Saudi Arabia has called off both the domestic and international stock listing of state oil giant Aramco, billed as the biggest such deal in history, four senior industry sources said on Wednesday. The financial advisors working on the proposed listing have been disbanded…
https://www.reuters.com/article/us-saudi-aramco-ipo-exclusive/exclusive-aramco-listing-plan-halted-oil-giant-disbands-advisors-sources-idUSKCN1L71TZ
Lol i wonder why?!
US ready to drive Iranian oil exports to zero, says US national security adviser
The US is prepared to use sanctions to drive Iranian oil exports down to zero, the US national security adviser, John Bolton, has said.
“Regime change in Iran is not American policy, but what we want is massive change in the regime’s behaviour,” Bolton said on a visit to Israel, as he claimed current sanctions had been more effective than predicted.
Donald Trump took the US out of Iran’s nuclear deal with the west in May and is imposing escalating sanctions, both to force Iran to renegotiate the deal and to end Tehran’s perceived interference in Yemen, Syria and Lebanon.
Complete removal of Iranian oil from world markets would cut oil supply by more than 4% probably forcing up prices in the absence of any new supplies.
SNIP
Fuller US sanctions, including actions against countries that trade in Iranian oil are due to come into force on 5 November, 180 days after the initial Trump announcement to withdraw.
The measures against Iranian oil importers, and banks that continue to trade with the Central Bank of Iran, will ratchet the pressure to a higher level.
Pompeo has set up an Iran Action group inside the US State Department to coordinate US leverage on companies and countries that cannot show that their trade, including in oil, has fallen significantly by November.
Measures may also be taken against firms that insure ships carrying Iranian crude.
It is expected some of the major Iranian oil importers, such as Russia, China and Turkey, will either ignore the threat of US sanctions, or, possibly in the case of Iraq, Japan and South Korea, seek exemptions.
China takes a quarter of all Iran’s oil exports, and with Chinese banks little exposed to the US it can avoid the impact of Trump’s sanctions.
I wonder if China could just take all of Iran’s oil? I imagine at the right price they would be happy to do so. China imports about 8 Mb/d, Iran exports about 2.5 Mb/d of oil, seems possible.
Also note that if this does occur and there is no drop in Iranian output, the impact of the Iranian sanctions on the World Oil market will be effectively zero.
https://www.reuters.com/article/us-china-iran-oil-shipping/exclusive-china-shifts-to-iranian-tankers-to-keep-oil-flowing-amid-us-sanctions-sources-idUSKCN1L50RZ
I wonder what the capacity is of the Chinese and Iranian oil tanker fleet is? If nobody else will buy it or ship it then the tanker fleet will have to be owned/insured by either Iran or China.
Previously posted.
The big issue is the insurance. A US seized cargo triggers insurance on either party, Iran or China. No way that doesn’t escalate to violence.
I’m interested in knowing if Chinese oil tankers are even capable of hauling 2.5 million barrels a day home from Iran. It seems doubtful that anybody else will be doing it for them. I can’t find much info on the size of the Chinese owned tanker fleet and it’s capabilities.
While US forces have been known to seize North Korean oil tankers hauling Libyan oil, I find it doubtful that they will seize Chinese ones, for the reason you mentioned; China punches back. Nothing spells the end of hegemony like getting your ass kicked.
One would assume its easy for the chinese to buy used oil tankers if they offer a bit over current market prices. This is a very long term conflict, and they could buy tankers, reregister them Chinese or Iranian or say Russian and start moving that oil.
The US is run by a somewhat unstable president being advised by nuts like Bolton whose main focus is following Israeli diktats, therefore i woud not expect them to be looking out for US interests.
DC,
I believe China did tell the US that they would continue to buy but not increase the amount of oil they buy from Iran.
Don’t know what the current status of that is, though.
I have read that in several articles. I also read they didn’t want to upset other suppliers by overriding it with Iran oil (except the US, of course). There might be that giant elephant in the room that nobody likes to talk about, too. Iran likes to Sabre rattle, but I wouldn’t classify that all as noise. It’s basically a SA and Iran show. It could very well escalate if things get too bad, and disrupt oil from both. For example, drones targeting pipelines would be pretty easy pickings.
China has left off oil from the tariff list, why? Because if you need it later, it’s easier than taking one item off the list. Saving face, and all. They can more easily advise their oil companies not to buy the oil, and change that decision later if they need to.
Thanks Guym and Synapsid,
I hadn’t seen that China had agreed not to raise its Iranian imports. Not sure they would to stick to that as the relationship between China and the US does not seem great at present. Also if oil prices rise, China may decide less expensive Iranian oil is difficult to pass up, if the Iranians choose to offer their oil at a discount.
The way this works, we may see the Iranians trucking oil to the Caspian and sending it by small tanker to other nations to be blended with local oil.
Gotta find the text of the Iranian nuclear agreement. There was apparently a passage in it that referred to Iranian behavior beyond its nuclear development program. Violation of that passage is the given reason for ending the agreement.
The EU does not agree, entirely. Not clear why. They’re not large Iranian importers.
The EU is hoping to do other business with the Iranian economy- export goods to them for example, get engineering contracts for example.
And so like most people [countries], they are willing to have blinders on when it comes to ‘poor behavior’ in return for money.
Kind of like in the past when the USA has supported brutal dictators in return for favorable contracts for ‘our’ multinationals.
Maybe because its bad for a country’s reputation to use weak excuses to start a commercial war, especially when its instigated by a pair of nuts like Bibi Netanyahu and the wacko Saudi prince?
What Really Happens to Nicaragua, Venezuela and Ecuador
The vids of the earthquake showed stuff (canned food) flying off shelves and the outside footage showed what looked to me to be lots of modern cars on the streets.
The people walking around didn’t look like they were starving and the roads good quality.
The media narrative is suspect. Of course since they are said to have faked a drone assassination, maybe they faked an earthquake, too.
The premature detonation of a drone mounted bomb seems odd. Perhaps a timer was used, if the ‘pilot’ wished to avoid the use of a radio controlled detonation, and the drone was behind schedule. Electronic counter measures may have caused it to detonate prematurely, if it was an RC detonator, but I have my doubts. Although good pictures from which to assess bomb damage are hard to come by, it’s worth noting that the drone bomb did not appear to have any antipersonnel material (fragments) incorporated in it’s design. That’s odd to say the least. If one is sufficiently motivated and doesn’t mind collateral damage, the route usually taken is to get an 80mm mortar within several kilometers of an outdoor target, or a 60mm mortar within a few kilometers. IRA tried a mortar a job on Thatcher, but she was indoors. A more sophisticated approach would have been a fixed wing drone with a forward facing antipersonnel blast. I believe it is purported to have been a rotary wing drone in the Maduro case. My best guess is the drone attack was a orchestrated and Maduro was briefed, as was everybody else who didn’t flinch. The military band sure cleared out in a hurry though, as they usually do.
**If anti pers frag was used the plant pots in this pic would show damage.
https://www.cp24.com/world/venezuela-s-maduro-accuses-opposition-leaders-of-role-in-drone-assassination-attempt-1.4044543
Yep—-
MSM for ones perspective is quite absurd.
I don’t have a clue—
Dude, thats like apologizing for Stalin, Hitler, and Idi Amin at one time.
To the audience: the Maduro regime, aided by the Cuban dictatorship, has activated its oropaganda network as the tragedy in Venezuela unfolds. The cut and paste above is typical of what we see. It seems written by the Telesur shop and other selected agitprop agents.
Let me give you a brief update:
The huge flow of people escaping Venezuela is either steady or increasing. I read that about 4000 per day are reaching Ecuador, but many are trying to go on to Peru and Chile. Several sources noted the flow leaving by foot and crossing the mountains is mostly males and young women who are skinny but in good physical shape, a group which can source a large number of candidates for a national liberation army. This didnt escaape the Cubans, who sent word to Maduro to make plans to close the border and keep all the young men who are likely to come back to fight inside Venezuela. Orders came last night.
Meanwhile everything is in total chaos, the regime is arresting shop owners, the security forces are out terrorizing and threatening the population, most employers are making deals with large numbers of employees to have them accept a layoff in exchange for a payment (which can be in both bolivars as well as some dollars deposited outside). And the flow of pdvsa employees out of the country continues. So i expect the current chaos to continue the current trend, which means venezuela production should be about 1.1 million bopd in December.
Once we get to January anything goes, because thats when Maduro is supoosed to assume a new term based on illegitimate elections, plus he has just bern convicted for corruption and given an 18 year sentence by the Supreme Court in exile.
Would be nice to be able to see your comments as a reliable depiction of reality, but based on your other comments about geopolitics and how the world works, I don’t put any stock in it.
That’s because you are in the Matrix, and I’m outside trying to give you a glimpse of reality.
I’m not in the US, but i watch the commie media on youtube, and notice they tend to ignore Venezuela, have bland comments about what goes on in Cuba, and occasionally roll out Amy Goodman and other reds who are on Maduro’s payroll to explain to you that Maduro is a swell democratically elected president.
New blog post by Rune Likvern on credit creation, interest rates and oil price: https://runelikvern.online/2018/08/21/the-price-of-oil/. He focuses on the demand side and believes that Brent will trade in $55 – $70/bo range over the coming year. This seems a bit low IMHO., considering the supply side of the equation.
I agree with your opinion. There will be a downward pull from multiple directions. Dollar strength, Rune’s analysis, higher price in general, Iran discounting their oil, and maybe some others. All of those will not keep price from going up if supply is too low. Just keep an eye on world inventory levels. They tell the long term story.
Guym,
Also consider that $80/b at 29.5 Gb consumption is about $2.4 trillion for a World economy of $80 trillion, that’s about 3% of World GDP, in 2013 when prices were $108/b and consumption was 27.8 Gb and World GDP was $76.5T, oil consumption (C+C) was about 3.9% of World GDP. Perhaps rising interest rates will make spending 3% of World GDP on oil a problem, but despite Rune Likvern’s excellent analysis, I think the connection between credit creation and oil prices that he reveals may be a spurious correlation.
Certainly higher credit creation will tend to increase aggregate demand (of which oil consumption is a part) and will tend to increase demand for oil. The price of oil is determined by both supply (production of oil) and demand (consumption) of oil.
Just as supply does not create its own demand (Say’s Law), demand does not create its own supply. Even if demand for oil should decrease (which I doubt will occur without a major recession such as the 80s oil shock or the GFC), eventually the supply of oil is likely to not keep up with the increase in oil consumption (likely by 2019), the lower oil prices are the more likely this is to occur because oil production will not be profitable at prices under $70/b for many shale and deepwater plays, thus their will be a lack of oil investment and oil will become scarce.
I think Euan Mearns prediction of $80/b for oil (made in early 2018) seems reasonable.
https://oilprice.com/Latest-Energy-News/World-News/Kuwait-Looks-To-Settle-Oil-Field-Disputes-With-Saudis-Iraq-Soon.html
Kuwait expects to soon sign deals on the development of the oil fields that it shares with its neighbors Saudi Arabia and Iraq, official Kuwait News Agency (KUNA) quoted Oil and Electricity Minister Bakheet Al-Rashidi as saying on Wednesday.
All the easy oil in the Middle East is going to be developed soon, including also maybe the border fields of Iraq/Kuwait. The border fields between Iraq/Iran have been developed in the last few years as well. Wonder if Kuwait has stretched their production since they are so eager to develop the last resources now?
There was a report that the neutral zone would be limited to 100 kbpd. The issue cited was that it drains from Safinaya, which is 100% Saudi whereas the NZ would mean they get only 50%. I think another issue is a lot of the fields are near end of life and need steam flood to get much more out.
Interesting. It seemed like some sort of propaganda served when the newsoutlets said the neutral zone would give 500 kbpd by year end. And almost certainly it is just that also.
https://www.middleeasteye.net/columns/collapse-saudi-arabia-inevitable-1895380679
Will SA be limited on exports in the future due to domestic demand?
Good question. Getting rid of power plants buring fuel oil and investing in solar power seems to be the plan. Wonder if they are able to execute it. In addition the removal of subsidies on gasoline ought to also reduce consumption.
Very short term exports from SA will be impacted by the annual Hajj pilgrimage now in August. 2.4 million pilgrims demand huge amounts of extra desalinated water supply and artificial cooling based on more fuel oil electricity. There are reports of much lower exports in July compared to June, and August seems to be even lower so far.
Short term I think they are looking at shale gas for power generation, though with mixed results so far.
I have some serious doubts about how much and how fast shale oil will grow over the next few years. I have accumulated no statistics, and have prepared no computations and charts to back up my doubts. However, they should be easily understood in theory, as that’s all it is, a general theory.
While I know of no industry standards to define the difference between tier one, tier two, and tier three oil, I have made my own guesses based on operators statements. Tier one has EUR of 600k barrels, or more. It will produce over 200k in the first year. Tier two has EUR closer to 300k, and will produce 100k to 200k the first year, or an off the wall estimate of 150k. Tier three is probably closer to 150k EUR, and it’s long term profitability is dependent on a very high oil price. It will be drilled, but only when price is high, and tier two is gone.
If you look at tier one, it can be drilled at today’s prices, and income from the first year will fund one or more wells the next year with cash flow, hypothetically.
You would need about twice the number of tier two wells to equal a tier one. At present prices you would have to borrow money to fund the equivalent number next year.
We have a limited amount of tier one wells left in the Eagle Ford and Bakken. There is beginning to be some question as to the number of tier one spots in the Permian. Plus increasing GOR is raising questions.
As more wells are drilled, of course the price of the well increases. Simple micro supply/demand.
Interest rates will increase, causing borrowing costs to increase.
Even at $100 oil price, I can’t see over a two million barrel a day increase in a short period of time (three to five years).
I could put numbers to this, but I could never reach what it actually would be, anyway. Do your own figures and see what you come up with. I just can’t get to over 2 million barrels, and that would be tough.
I’m not saying that the estimates for recovery are wrong. I’m saying using past data to estimate the future does not take into consideration that all rock is not the same, and that costs and borrowing ability will put their own limits on how much, and how fast growth occurs.
Guym,
All very much guess work. There are factors such as improved well layout, better well design and so forth that tend to drive well cost for some “optimized” well design (a given lateral length, number of frac stages and pounds of proppant and other materials) lower that may offset the microeconomic tendency for costs to go up as constraints are reached (not enough workers, equipment, or infrastructure). That’s the reason I assume for simplicity that long term well cost in constant dollars remained fixed.
I also have no idea on the numbers of tier one to three wells that potentially can be drilled. All I have used is average well output for ND Bakken, Eagle Ford, and Permian from shale profile. That is simply a mix of all wells producing. I assume oil companies attempt to drill the most prospective areas first (not an exact science) so that as the play is understood average new well EUR will gradually rise to some maximum (as oil companies figure out both the best areas to drill and the best well design) and then after some period (probably 2 to 3 years) the best areas will become saturated with wells so that less prospective areas will be drilled and new well EUR will gradually decrease. That is my model in a nutshell and the result for the US is that tight oil output may be able to rise from 6000 kb/d in July 2018 to about 8000 kb/d by July 2023 (about 5 years). This scenario assumes high oil prices and is optimistic, a “medium” oil price scenario would result in maybe a 1.5 Mb/d increase in tight oil output over 5 years and a “low oil price scenario” ($80/b in 2017$ maximum by 2025) might see only a 500 kb/d increase in tight oil output from 2018 to 2023.
Note that US tight oil output has risen by about 700 kb/d over the first 7 months of 2018. I do not believe this rate of increase will continue for much longer and will gradually decrease as we approach 2021.
Guym,
For the Permian basin specifically the peak is about 1 Mb/d lower for my “low oil price” scenario relative to the medium price scenario ($80/b vs $113/b max price). Other basins would also be affected, but I haven’t run the scenarios on all tight oil basins so I am not sure how much the entire US tight oil peak would be affected, probably 1.5 Mb/d lower than the medium price scenario. For Rune Likvern’s near term oil price scenario tight oil output would be fairly flat from current output levels in my opinion and that would tend to put upward pressure on oil prices.
We have not had any difference of opinion on future shale output, in the last 6 months, according to my recollection. Any minor differences that may have been discussed fit into the “who knows” classification. My comment was for those “other” projections coming out, that basically are surreal. They have caused, in my opinion, an excess of pipelines being built, and massive expenditures to be able to export another 3 to four million barrels of oil a day that will probably never show up.
700k a day out of the Permian, is actually what I am projecting for 2018. Even 800k is within probability. 200k of extra pipeline is due sometime before year end. Not much more than that until late 2019 when bigger pipelines may be available. But the amount you could crank it up to would be limited by the number of months left in 2019.
Guym,
Agree 100%. Note that 700 kb/d is roughly my estimate for Permian increase in 2018 as well, for the US tight oil as a whole possibly 1000 to 1200 Kb/d increase in 2018. Many of the estimates are too high on that point we are definitely on the same page.
What tight oil are you adding to the 700 to get 1000 to 1200????
I mean, there are only four months left. I know the Eagle Ford can’t do hardly anything in that time fraim, Bakken is stuck at a high of about a 100k increase, so what fields will add that much?
Guym,
From Bakken, Eagle Ford, Niobrara, and STACK/SCOOP.
So far non-Permian US tight oil has increased about 215 kb/d through the first 7 months of 2018, I would expect this to accelerate if anything as capital moves to other tight oil basins due to the low oil prices at Midland. So a 400 kb/d increase from other tight oil basins (exit rate for 2018), plus 700 kb/d from Permian basin would give us 1100 kb/d.
So far in 2018 we have increases of 92 kb/d in Bakken, 61 kb/d from Eagle Ford, 38 kb/d from Niobrara, 479 kb/d from Permian, and 24 kb/d from all other US tight oil plays.
If all output stopped increasing in other tight oil plays besides the Permian after July 2018 we would have a 915 kb/d increase in US tight oil output in 2018, if my guess of a 700 kb/d increase for the Permian basin tight oil output in 2018 is correct. My best guess remains 1100+/-100 kb/d for the US tight oil increase in output from Dec 2017 to Dec 2018.
I only have data through July 2018, so 5 months left for increases, if we extrapolate the rate of increase for the first 7 months of 2018 we get 1190 kb/d for the 2018 increase in tight oil output. I scale it back a bit because I expect Permian output increase will slow down. Other plays might also speed up.
Ok, your looking at EIAs production estimate per play, again. I’m only going to go by monthlies. There will be other field declines, besides tight oil. GOM, Alaska, and non tight oil Texas.
Guym,
Yes I was only talking about tight oil. I am not sure hoe much decline there will be elsewhere, haven’t guessed.
Dennis.
Looking at rig count, drilling capital is not going to other US shale basins from PB.
Maybe you are seeing an increase in frac spreads in the basins to speed up completion of DUC wells?
Shallow sand,
Haven’t looked at rig counts lately so it’s a guess. Just figure the capial may move to higher profit areas such as Bakken or Niobrara. Yes there are DUCs that could be completed. There may be more available frac crews in other plays as everyone has flocked to Permian.
Look at YOY rig counts in the the post by Energy News.
Cana Woodford, EFS, DJ Niobrara and Bakken are down a combined 5 rigs from one year ago, while Permian is over 100 rigs above last year.
Shallow sand,
Using pivot table from Baker Hughes to look at horizontal rigs drilling for oil the rig count in the US for horizontal oil rigs was 647 for week ending 8/25/2017 and for week ending 8/24/2018 the horizontal oil rig count was 766 for the US as a whole, the recent maximum was 771 for week ending July 6, 2018, on January 5, 2018 the horizontal oil rig count was 650.
For the Permian the horizontal oil rig count was 350 on Jan 5, 2018 and increased to 428 on July 6, 2018 and had increased to 435 for week ending August 24, 2018, the count was 332 on Aug 25, 2017.
Most of the rig count increase for horizontal rigs drilling for oil in the past year has been in the Permian basin with an increase of 103 rigs out of 119 rigs for all of the US YOY. Only a YOY increase of 16 horizontal oil rigs for non-Permian tight oil plays in the US. As I suggested, this may change going forward as the Permian has become less profitable of late compared with other basins (due to low oil prices in Midland caused primarily by pipeline constraints.)
In My Mind: https://www.youtube.com/watch?v=W9P_qUnMaFg
Europe imports it’s oil, but produces best club music! And cars 😉 Like Audi, https://tinyurl.com/y7cuxm6u https://tinyurl.com/y9jmfjg7
2018-08-23 (Reuters) Production at Kazakhstan’s Kashagan oilfield has dropped since mid-August, hit by a 35-day maintenance outage, the Kazakh Energy Ministry said in response to a Reuters query.
https://af.reuters.com/article/commoditiesNews/idAFL8N1VE5HM
chart to the 22nd https://pbs.twimg.com/media/DlTiSCLWwAAvObc.jpg
The Kashagan oilfield is proving to be a real nightmare for operators and partners. No wonder a decision was made to expand capacity for the land based Tengiz field. No similar call was made for Kashagan even if stated reserves are a bit higher than for Tengiz.
Nickname is Cash All Gone
Cash All Gone is the only thing it is reliable at. I’m not sure if I’d call it a disappointment since it was daunting on paper but it has proven even more “interesting” than anticipated.
https://oilprice.com/Energy/Crude-Oil/This-Super-Basin-Is-About-To-Make-An-Epic-Comeback.amp.html
North Slope fracing? Conoco’s decisions continue to impress me. Right or wrong, they are not in group think.
It is a bit like offshore deepwater. If the size of a new prospect warrants it, the cost can be kept down reasonably. And the North Slope is probably one of the places it is possible to find another or even several gigant oil fields (above 500 million barrels). Just shows that some majors are betting on higher oil prices.
Yeah, in the middle of nowhere with no infrastructure. Take a while. Purely exploratory at these prices.
Baker Hughes US rig count, down -13 to 1,044 (-9 oil: -4 gas: 0 misc)
Permian -1
Williston -4
Table https://pbs.twimg.com/media/DlYXQ5kW0AMN0y-.jpg
EIA Weekly U.S. Ending Stocks to Friday 17th August
Crude oil down -5.8 million barrels
Oil products up +1.5
Overall total, down -4.3 (shown on chart)
Natural Gas: Propane & NGPLs up +1.5 (not included in the chart)
https://pbs.twimg.com/media/DlZH1X2X0AIPDLR.jpg
A weekly measure of inventories
https://pbs.twimg.com/media/DlZIRTmXoAARLxp.jpg
just the products https://pbs.twimg.com/media/DlZJyLOXsAElWDv.jpg
https://www.spglobal.com/platts/en/market-insights/latest-news/oil/082218-analysis-irans-oil-exports-down-sharply-in-first-half-august
Big drop in Iranian exports the first of August, and not close to Nov. yet. One million looks more likely, eventually. And for those that may have missed it, Sinopec has started buying US oil, again. To me, that indicates China is attempting to remain somewhat neutral.
International Energy Agency – Oil Market Report: 10 August 2018
now available to non-subscribers
download from here: https://www.iea.org/oilmarketreport/omrpublic/currentreport/
OECD Industry Stocks
Crude & products: https://pbs.twimg.com/media/DldYmV6XcAYtF6B.jpg
Gasoline & Middle: https://pbs.twimg.com/media/DldZdQmX4AEtM3P.jpg
IEA Oil Market Report: Global oil supply rose by 300 kb/d in July to 99.4 mb/d, 1.1 mb/d above a year-ago.
A list of the largest increases
Russia +150
Norway +80 (NDP say C+C up +38 m/m and C+C+NGLs +64 m/m)
Brazil +70
Biofuels +60
UK +60
OPEC NGLs +50
USA +50
A look at July’s crude oil production numbers. The official numbers released so far.
https://pbs.twimg.com/media/Dldt7PUW0AQ-2OF.jpg
Petroleos Mexicanos crude oil & condensates production (without NGLs)
July 2018 1,840 kb/day
2017 avergage 1,949 kb/day
https://pbs.twimg.com/media/Dldu7wFXsAA6_eP.jpg
India crude oil & condensates production
July 2018 695 kb/day
2017 avergage 732 kb/day
Seasonal https://pbs.twimg.com/media/Dld6devW0AADBXA.jpg
Onshore & offshore
https://pbs.twimg.com/media/Dld63cWWsAAn4SY.jpg
The Smith Bay oil discovery in Alaska claiming 10 billion barrels is starting to get old. 2016ish and still nothing about drilling.
http://www.rcinet.ca/eye-on-the-arctic/2017/06/14/caelus-delays-drilling-at-smith-bay-leaving-a-big-alaska-energy-prospect-unconfirmed/
Note date.
It’s pretty clever. They want money from the state before they do any work developing their own lease. The money would fund . . . haha . . . management salaries, among other things.
And if it proves out as no oil, well, then they got the state to fund exploration. If there is oil, they get the money from selling the oil. It’s no lose.
Alaska shale is a bust so far.
https://uk.webfg.com/news/aim-bulletin/88-energy-suspends-operations-at-icewine2-well–3375567.html
“Alaska shale” is an oxymoron. Labor? Infrastructure? Frac sand? Even if it had huge reserves it would be impractical just because of the overhead costs being vastly more than they are in the Lower 48.
Iran shipping. According to the article, Iran’s shipping capacity is 127 million barrels. 98 million of that may soon have to represent floating storage for condensate. Doesn’t leave much left. So, as what can’t be shipped increases, the amount of Iranian tankers that are available to bypass US sanctions decreases.
http://cpifinancial.net/news/post/46390/irans-tanker-fleet-gives-oil-export-lifeline-as-sanctions-loom
The above was an extract from this. Condensate will not fill tankers for about two years, but other oil not shipped could fill them up pretty quick.
https://www.bloomberg.com/amp/news/articles/2018-08-24/iran-s-tanker-fleet-gives-oil-export-lifeline-as-sanctions-loom
Loss from Iranian exports in August would probably not affect inventory balances until late Sept or Oct. No increase in US production, and losses from Iranian exports won’t cause a real panic until the second quarter of 2019, my guess. Until then, the press will be more vocal about impeachment than what oil prices are. Inventories will not be dangerously low by then, but still dropping.
https://oilprice.com/Energy/Crude-Oil/Mexicos-New-President-To-Deal-Blow-To-Oil-Industry.htm
Mexico president not interested in oil.
There’s an article elsewhere about this that presents it all a little bit differently. He is chasing corruption and he believes Pemex is where he’ll find it.
What I read said he’s going to pour billions into Pemex exploration and several billion to upgrade the downstream refineries that serve Mexico. Additionally any contracts with foreign companies will have to guarantee use of a certain percentage of equipment and manpower that is sourced strictly local. If that requires training then that will have to be in the contract.
This does not mean he is anti oil. On the contrary, the exploration focus makes clear he seeks an oil revenue center for the country. What he does not want is foreign companies to make money that he thinks should remain in Mexico.
I suspect it’s going to work. Scarcity creates all sorts of desperation.
There’s an article elsewhere about this that presents it all a little bit differently. He is chasing corruption and he believes Pemex is where he’ll find it.
He should probably take a long hard look at what happened in Brazil with Petrobras! Plenty of corruption found there but it continues with the new regime, probably worse than it was before! Betting on oil revenues to solve your social problems at this juncture no longer works.
If you make promises based on oil, that you can’t keep, you end up with Venezuela! And it doesn’t make a damn bit of difference whether you have communists or capitalists running things! Just wait until the shit really hits the fan in Saudi Arabia!
The double whammy of Peak oil and Climate Change are going to need some very innovative outside the box thinking to deal with. I have yet to see any government anywhere on the planet that has any serious plans to deal with these issues!
It won’t work.
If they could find the oil, they would have. They lack the ability. As for sourcing equipment locally, if Mexico had any manufacturing capacity to speak of, that might be a worthwhile endeavor.
Its all just a game for him to enrich himself.
An updated chart for the Midland $discount. In the futures market, the discount is decreasing.
https://pbs.twimg.com/media/DlrOb5wXoAAxp2O.jpg
November 2018 https://pbs.twimg.com/media/DlrSbaOXcAAiiOj.jpg
source: WTI Midland (Argus) vs. WTI Financial Futures Settlements
CME -> http://www.cmegroup.com/trading/energy/crude-oil/wts-argus-vs-wti-calendar-spread-swap-futures_quotes_settlements_futures.html
$Brent (October) – $WTI (October) spread on August 27: $7.34
OPEC $ORB – $WTI (October) spread on August 27: $5.22
Chart $Brent-$WTI: https://pbs.twimg.com/media/DlrYntzW0AA_cnm.jpg
Interesting, regarding the WTI Midland discount. Have they somehow managed to transport more by rail and truck, or have they cut back production, lessening the strain? My bet is on the latter, but I have been known to be wrong, frequently.
https://www.houstonchronicle.com/business/columnists/tomlinson/article/Don-t-believe-the-hype-about-the-looming-crude-13126608.php
The contrarian view. Pretty mindless read, but probably this approximates majority view, now. He discounts much of the Iranian reduction (though it is already over 600k), and continues the Pollyanna report of 2 million increase in 2018, and 1.8 million increase in 2019. The EIA weeklies, even overstated as they are, do not support a 2 million increase in 2018. There are only four months left in this year. Duh, that should give a little clue.
Are the June numbers coming out Friday? What’s your best estimate 10.50 mbd? I noticed Bakken’s June number declined despite an addition of 42 wells. I wonder if that play will be stuck for the next 6 months..
I think that GOM may be finished with down time (George would know better), and Texas production will be up over 100k (my estimate) for June. So, I think 10.8 would be closer. Won’t go up much more than that through year end, my guess. There is a 200k Permian pipeline expansion due to come online sometime before the end of the year. But, based on what has happened, I think it will mostly alleviate the discount, rather than filling up with new oil, immediately.
Yeah, I think all shale plays are stuck until 2019, except maybe Wyoming, but it won’t add much. Permian may still go up another 100k, or more when pipeline expansion of 200k is due sometime before year end. Oil price is still too low to generate immediate interest from the other basins. If EIA is lucky, they may get that 11 million they have been projecting for awhile, but it won’t happen until much later this year. But, it will be stuck there until late 2019. Prices will have to be at a stable high for months, and appear to be going up more, before you will see a lot of new production from fields other than the Permian. Oil companies, as a whole, have not generated much of a profit at $65 to 70 WTI. They have been very effective in raising flocks of DUCs. And it is not just in the Permian due to lack of pipelines, I see XTO raising a flock of DUCs in the Eagle Ford. Price is just not high enough yet. They know it will be higher. Of course, there is never a sure thing. We could always experience a life changing event, e.g. World War III.
Guym,
Not sure I agree on non-Permian tight oil, since 2017 the trend has been an annual increase of 459 kb/d for US tight oil excluding Permian basin tight oil output. My guess is that that trend will continue or even increase slightly due to higher oil prices, especially as capital is attracted to these other plays due to the poor oil price spreads in the Permian basin. Data on the chart is through July 2018 (most recent data from EIA’s tight oil estimate). Note that this is not data from the Drilling Productivity Report (which is not very accurate after May 2018), the data can be found at the link below.
https://www.eia.gov/energyexplained/data/U.S.%20tight%20oil%20production.xlsx
Dennis, I’m talking about to the end of the year. Not the full year. They have all come up some to this point. There is just not enough carrot hanging out there for any more substantial increase. If companies start spending more in other areas, there just is not enough time to plan, permit, drill, and complete by the end of the year. They don’t just turn a damn spigot on. And you have to ask yourself, why would a company spend huge capex this year for a well that would not produce a whole lot by year end? The past five years I have been looking at activity, it looks to be mostly planned out the first of the year, not ad hoc.
On another note, I have done a brief review of monthly production reports by district per the RRC. I do not see any decrease per district, with an uptick in district one and two (Eagle Ford). We know the State recorded production is close to the projected Permian shale increase. I would think the state”s total would be higher, unless there is a hidden drop, like conventional in the Permian. But, that’s a wag, for sure.
Guym,
There are lots of DUCs with the permits in place just waiting for the capital to hire the frac crews, infrastructure already in place, probably just 2 to 3 months from decision to frac and output. I expect about a 200+/-50 kb/d increase in tight oil output from non-Permian US tight oil from August through December of 2018.
This is based on the assumption that WTI will be $65 to $75/b for the rest of the year.
It will get expensive if everyone tries to hire frack crews and equip the same time.
I personal think fracking / transportation (of sand and oil) is the real bottleneck, not the widely watched drilling. It’s even more expensive than the drilling job.
So pump horsepowers in a specific oilfield would say much more about activity than drilling rigs. Dry holes do not pump oil, only the pumps make this possible.
So frack horsepower / utilization will be a much better benchmark.
In conventional fields it was drilling.
They are still adding DUCs at 65 to 70, why would it increase? I don’t see it. On the other hand, 200k is a pretty insignificant amount to argue about, when you look at the rest of the supply problems. Demand growth is looking healthy. US production growth is not there. Iran looks to loose one million a day in exports. Venezuela is circling the drain. Libya’s fights are still not over. Canada has not recovered yet from pipeline woes. EIA says: “What, me worry?” Those are probably not going to be the only negatives, so 200k is peanuts.
George
Saw this today.
http://shipsandports.com.ng/egina-fpso-sails-offshore-field/
“The Permian isn’t a basin. It’s a phenomenon “.
From today’s RBN energy site, some numbers …
5 new oil pipelines increasing takeaway from 3.3 to 8 mmbld
7 new gas lines – takeaway increasing by 14 Bcfd (total 25 Bcfd bigger than most countries)
27 new gas processing plants
1.6 mmbld Y grade takeaway providing cheapest petchem feedstock in the world
Even by Texas standards, these figures are breathtaking.
New world is upon us, folks.
Carpe Diem.
Coffeeguyzz,
Those pipeline companies will take a bath on that capacity. The Permian basin might reach 5 Mb/d in 2023, after that decline will be steep and there will be significant over capacity. This is based on a medium oil price scenario ($113/b in 2017 $ by 2027) and a medium TRR (38 Gb for Permian basin tight oil only from 2010 to 2080). Note the scenario below does not include Permian conventional oil (about 500 kb/d) so if we assume conventional output does not decrease from now through Jun 2023, maximum Permian region output would be about 5300 kb/d in 2023 for the medium scenario presented in the chart below (tight oil only in kb/d).
On reading that article, the 8 MMb/d capacity is for all pipelines to the Gulf coast, the 8 MMb/d is approximately the US maximum LTO output in 2023. This will still be a problem as the peak output of 7.5 to 8.5 MMb/d is likely to last for only 3 to 5 years and then there will simply be excess pipeline capacity, perhaps the pipelines can be converted to move NGL in the future as C+C output from tight oil plays declines after 2025. The long plateau in the EIA’s AEO reference scenario is highly unlikely, smart pipeline companies should be highly skeptical of that scenario and investors should be aware.
Dennis
There are now 4 proposed high capacity ports to export LTO (in addition to LOOP).
The above mentioned infrastructure – pipelines, gas treatment plants – not to mention the $200 billion in US petchem build out, tens of billions for LNG handling and transportation facilities, ALL involve armies of professionals minutely studying, analyzing production data, resource potential, finance guys evaluating where (or whether) to place their money for anticipated returns for decades to come.
With all due respect, I am continuously dumbfounded how amateurs, regardless of innate capabilities and genuine interest can REMOTELY presume to forecast the future at such variance to an entire industry that continues to plunge ahead with a demonstrated history of productive success.
This site NEVER expected the Bakken to exceed 1 million barrels oil per day, let alone maintain that level.
This site continues to downplay the Permian’s potential in the face of overwhelming data showing it to be an unparalleled juggernaut.
This site gives scant attention to emerging plays such as the Powder River Basin that is just starting to reveal its potential.
Dennis, you or anyone can do a simple 20 minute search from, say, 2012, 2013, and see the wildly incorrect LTO projections from that time.
Again, today, you are postulating the most peculiar future scenarios in the face of a contrarian onslaught backed by an array of industries who, collectively, are investing hundreds of billions of dollars based upon the premise of tens of billions of barrels of oil coming from west Texas/South East New Mexico over the coming decades.
While I admire your steadfastness, I think your continued innacuracies should prompt some type of re-evaluation … or, maybe not.
Coffeeguyzz,
Here is a comment from Jan 15, 2014 by me. At the time I did not expect the oil price crash of late 2014, so the guess for future output did not match reality, but the prediction was for a peak of 1240 kb/d in 2015.
Note that the anticipated decrease of new well EUR in Jan 2015 was clearly wrong, currently my guess is Jan 2019.
http://peakoilbarrel.com/update-north-dakota-bakken-data/#comment-5975
You are correct that earlier estimates were too low. The increase in new well EUR and especially the peak production rate in the first few months I did not expect would continue to increase as much as has been the case. Currently I expect the scenario in the chart below for my “medium oil price scenario” which rises to $113/b in 2017$ by Feb 2027. Peak is 1750 kb/d in 2022 at a maximum well completion rate of 220 new wells per month in 2022.
On the inaccurate LTO projections, that is correct, my estimates were guided by the EIA analysis at the time. In many cases the incorrect forecasts were based on the profitability of the new wells and assumption that unprofitable wells would not be completed.
Generally proper business practices were not really followed, which was unanticipated.
Generally forecasts will be proven false by time.
Impossible to predict the future accurately, EIA, IEA forecasts have also mostly missed.
Dennis
Your last sentence is both correct and yet should not, IMHO, diminish all the work you and others do on this site in efforts to understand what is – and will be – going on.
Main point of mine being, again, the dizzying pace of change occurring throughout the entire unconventional world affects future projections in rapid, widespread fashion.
Disparate items such as the frac outfit that uses a GE turbine to provide an all electric frac fleet (huge drop in costs), this Vorteq gizmo – if/when it works – could revolutionize both completion processes and mud pump applications across the board if the technology proves effective, local sand mines for frac sand are springing up everywhere reducing costs, the 20 or so LNGo units – micro LNG plants – are planned for the Permian in the coming months … opening up a HUGE arena for gas capture, the snubbing company facilitating the 20,000 foot laterals in Appalachia expanding down Texas way to smooth the path for extended laterals down there, the 70 stage completions that are now the Continental Bakken norm and are producing 50/70 k barrels the first month, the re-fracs starting to consistently prove very successful, … on and on.
Dennis, virtually NONE of the aforementioned is reflected in any projections by established bodies.
But most (all?) will be in the field in a few years’ time, only to be supplemented by still more whiz bang stuff that is presently only a gleam in a dreamers eye.
That’s the way it works.
Coffeeguyzz,
At some point the law of diminishing returns will apply and the incremental increase in output from more frac stages, proppant,and longer laterals will not be large enough to justify the increased cost. My guess is that the Bakken is pretty close to that point. As far as refracs, these may not be able to be justified for most wells and is not likely to add much to overall URR (maybe half a billion barrels). Also not that judging by the average well profiles it looks like the newer wells fall to the output level of older wells after 24 months or so.
The average Bakken well from 2017 produced about 18,000 barrels in the best month (month 2 after start of production). Just because there is one well that might have produced at a maximum rate of 2300 b/d in a 24 hour period, does not mean it did so for an entire month.
Continental had 7 wells which started producing in Feb 2018 that had an average output of 37,000 barrels per month. There were 16 wells by continental from 1Q2018 with average output of 29,500 b per month for highest month of output.
One has to be careful to not tout the best well ever as typical, that is reserved for investor presentations 🙂
So it seems the 2300 b/d figure may have been a single well or just the highest 24 hours of output.
If you believe that Iranian production will collapse (and Venezuela continues to collapse) then that certainly leaves a lot of demand looking for supply, assuming the cost is reasonable, and some of it at whatever the cost. might even be coordinated with government. if so, certainly the financing will be there. gotta put that afghanistan CIA poppy money to good use.
EIA – Monthly Energy Review
https://www.eia.gov/totalenergy/data/monthly/
Without the USA or Canada, just to see where the growth is coming from
2018-08-28 (WSJ) Iran’s Oil Exports Dropping Faster Than Expected Before U.S. Sanctions
Officials at the at the state-run National Iranian Oil Co. provisionally expect crude shipments to drop to about 1.5 million barrels a day next month down from about 2.3 million barrels a day in June
Shipping is emerging as Iran’s main Achille’s Heel.
Paywall: https://www.wsj.com/articles/irans-oil-exports-dropping-faster-than-expected-before-u-s-sanctions-1535483145?redirect=amp
Just as I get used to liking him, he writes something like this:
https://oilprice.com/Energy/Oil-Prices/Rising-Supply-Will-Keep-Oil-Prices-Rangebound.html
Yeah, maybe 33 companies will, in total, increase capex. The smaller companies, who they don’t poll, represent half of Permian drilling. Will they complete wells, or create DUCs? Malarkey. And, they will get all that 750k more of oil this year to market by…MAGIC!