MEXICO Oil Reserves and Production

This is a Guest Post by George Kaplan

In dollar terms, since mid 2015 Mexico has been a net importer of hydrocarbons (oil, natural gas, petroleum products and petrochemicals combined). To date it has been a relatively small and fairly constant amount, but with their oil production declining, and oil prices apparently continuing to fall while natural gas prices may be on the rise, the net cost could now start to increase.

chart/

Read More

EIA’s Electric Power Monthly – June 2017 Edition with data for April

This is a Guest Post by Islandboy

Non-Petroleum comments should be in this thread.

chart/

chart/

The EIA released the latest edition of their Electric Power Monthly on June 23rd, with data for April 2017. April data extends the milestones reached in March as follows:

  • The contribution from solar reached 2.35%, up from 2%
  • The contribution from All Renewables extended its lead over Nuclear by more than 2%
  • The combined contribution from Wind and Solar reached 11%, up from 10%
  • The contribution from Non-Hydro Renewables exceeded 13%, up from 12.24%

Read More

World Energy 2017-2050: Annual Report

A Guest post by:

Dr. Minqi Li, Professor
Department of Economics, University of Utah
E-mail: minqi.li@economics.utah.edu

This Annual Report evaluates the future development of world energy supply and its impact on the global economy as well as climate change. The report projects the world energy supply and gross world product (global economic output) from 2017 to 2050. It also projects carbon dioxide emissions from fossil fuels burning and the implied global average surface temperature from 2017 to 2100.

chart/

Figure 18
Sources: World historical oil, natural gas, and coal consumption from 1950 to 1964 is estimated from carbon dioxide emissions (Boden, Marland, and Andres 2017); world primary energy consumption and its composition from 1965 to 2016 is from BP (2017); world primary energy consumption and its composition from 2017 to 2050 is based on this report’s projections. Read More

OPEC May Production Data

All data below is based on the latest OPEC Monthly Oil Market Report.

All data is through May 2017 and is in thousand barrels per day.

OPEC crude only production was up 336,000 barrels per day in May. The two countries that are not subject to OPEC quotas, Nigeria and Libya, were up a combined 352,000 barrels per day. That means the rest of OPEC was down 16,000 bpd. And all this was after OPEC April production was revised upward by 72,000 barrels per day.

Read More

Open Thread Non-Petroleum, June 14, 2017

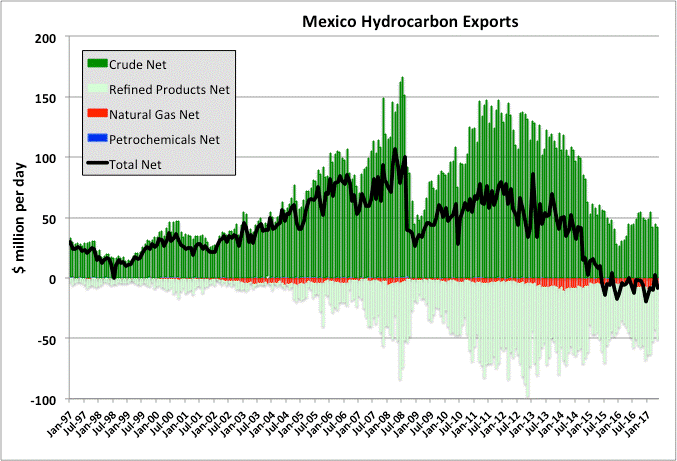
Comments not directly related to oil and natural gas in this thread please.

This eye-popping chart on inequality is a slap in the face of America’s middle class

Why does the US economy still feel iffy to most Americans despite an eight-year economic expansion and historically low unemployment?

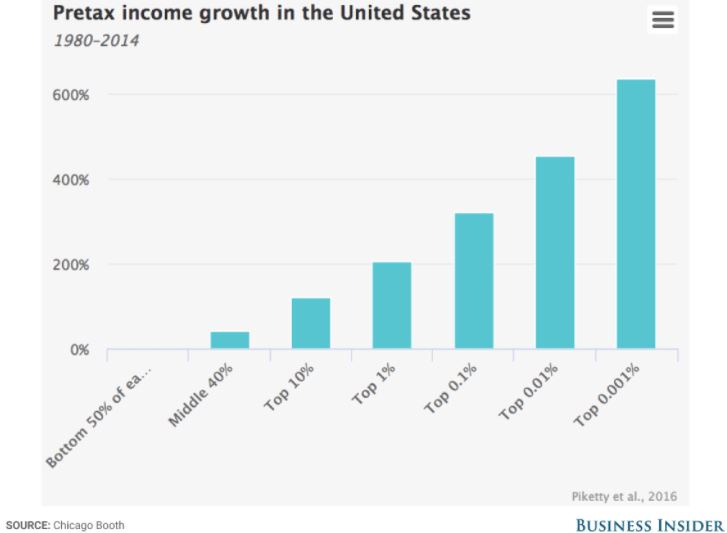
Look no further than this eye-popping chart of income growth between 1980 and 2014 courtesy of Berkeley’s elite-squad of inequality research, including Thomas Piketty, Emmanuel Saez, and Gabriel Zucman.

Featured in a recent blog from the University of Chicago’s Booth School of Business, the graphic highlights just how stratospheric income growth has been for the very wealthiest Americans — and how stagnant, in contrast, wages have been for the rest.

That’s not a typo on the right. Incomes for the top 0.001% richest Americans surged 636% during the 34-year period. Wow.

There’s more. “The average pretax income of the bottom 50% of US adults has stagnated since 1980, while the share of income of US adults in the bottom half of the distribution collapsed from 20% in 1980 to 12% in 2014,” writes Howard Gold, founder and editor of GoldenEgg Investing, in the Chicago Booth blog.

“In a mirror-image move, the top 1% commanded 12% of income in 1980 but 20% in 2014. The top 1% of US adults now earns on average 81 times more than the bottom 50% of adults; in 1981, they earned 27 times what the lower half earned.”

Here’s a link to the full paper for the academically inclined.  Read »