Bakken, What Is The Data Telling Us?

North Dakota publishes, every month, a Monthly Statistical Update from which we can gather a wealth of data if we dig deep enough. They publish the number of spuds, that in new wells started, each month, along with the average number of rigs that month. From this we can glean the average number of days each rigs spends on each well.

Spuds per Rig

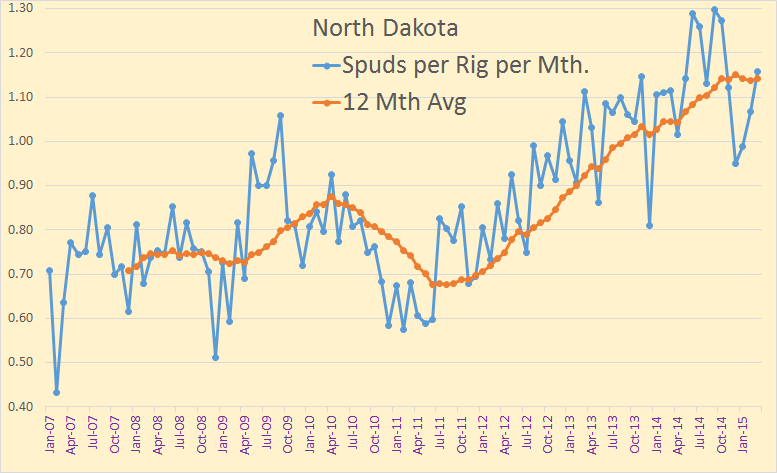
The last data point is March, 2015. Through 2011 a rig could drill about .75 wells per month, or about 40 days spud to spud. Today that figure is about 1.14 wells per month or about 26.3 days spud to spud.

Permits & Spuds

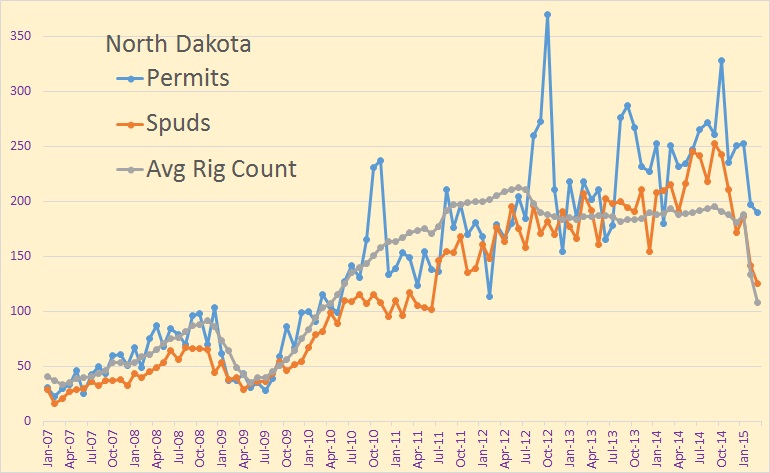
Again, the data is through March. We can see the falloff of spuds, rigs and permits in February and March. April and May should show a further decline in all three.

Read More

Eagle Ford, Permian Basin, and Bakken and Eagle Ford Scenarios

This is a guest post by Dennis Coyne

Increased oil output in the US has kept World oil output from declining over the past few years and a major question is how long this can continue. Poor estimates by both the US Energy Information Administration (EIA) and the Railroad Commission of Texas (RRC) for Texas state wide crude plus condensate (C+C) output make it difficult to predict when a sustained decline in US output will begin.

 About 80 to 85% of Texas (TX) C+C output is from the Permian basin and the Eagle Ford play, so estimating output from these two formations is crucial. I have used data from the production data query (PDQ) at the RRC to find the percentage of TX C+C output from the Permian (about 44% in Feb 2015) and Eagle Ford plays (40% in Feb 2015).

Dean’s estimates of Texas C+C output are excellent in my opinion and are close to EIA estimates through August 2014. I used EIA data for TX C+C output through August 2014 and Dean’s best estimate from Sept 2014 to Feb 2015. By multiplying the % of C+C output from the RRC data with the combined EIA and Dean estimate, I was able to estimate Eagle Ford and Permian output. The chart below shows this output in kb/d.

  
blog150427/

Read More

Texas RRC February Production

The Texas Railroad Commission has released its  incomplete production data for February.  The RRC also estimates final production but that data has not been posted yet.

All Texas RRC data is through February. The EIA data is through January.

Texas C+C

It looks like, after the final Texas data comes in, that February crude oil will be above January production but still below December production. It is my best guess that Texas production will be down about 80,000 barrels per day in January and up about 50,000 bpd in February or about 30,000 bpd below December production.

Texas Crude Only

I always post the last six months data just so we can get some idea of the general trend. You can see the general trend is up until January when it took a huge hit and only partially recovered in February.

Read More

AEO 2015, The EIA’s Crude Production Expectations

The EIA came out with its final update of Annual Energy Outlook 2015. It seems that the EIA is extremely optimistic concerning future US crude oil production.

AEO 2015

Here is a comparison with AEO 2014. The EIA still expects US crude production to peak in 2019 but at 10,472,000 bpd or 824,000 barrels per day higher than the expected last year. But the biggest difference is in the EIA’s change in decline expectations. They now expect the US to be producing 9,329,000 bpd in 2040 or 1,812 higher than they had 2040 production last year. This is the EIA’s reference, or most likely case.

AEO 2015 1

Production from tight formations leads the growth in U.S. crude oil production across all AEO2015 cases. The path of projected crude oil production varies significantly across the cases, with total U.S. crude oil production reaching high points of 10.6 million barrels per day (bbl/d) in the Reference case (in 2020), 13.0 million bbl/d in the High Oil Price case (in 2026), 16.6 million bbl/d in the High Oil and Gas Resource case (in 2039), and 10.0 million bbl/d in the Low Oil Price case (in 2020).

Read More