US Production and Imports and an Essay

Even before the shale revolution got underway, US net imports were falling. The data below is from the Weekly Petroleum Status Report and is in thousand barrels per day.

Net Imports

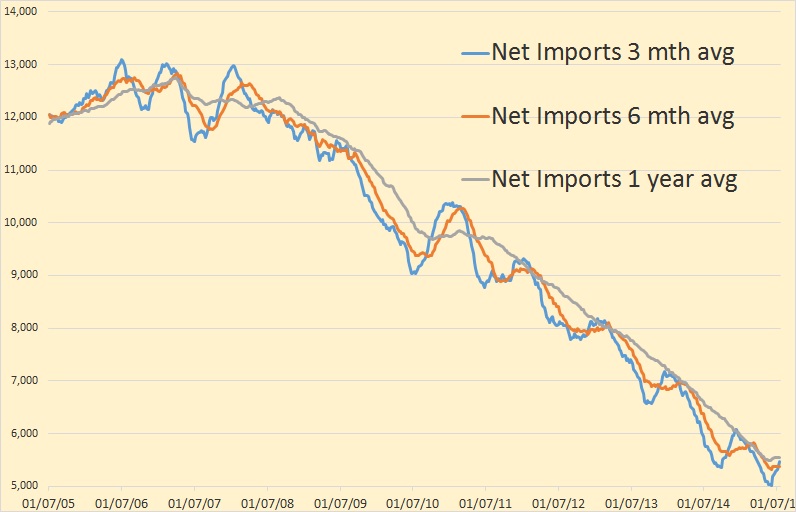
This chart shows net crude oil and petroleum products imports. Net imports peaked in 2006 and started to fall in earnest in 2008. They continued to fall until 2010 when the three month average increased sharply and the annual average leveled out for about a year. Then as the Light Tight Oil revolution got underway in 2011, net imports started to fall again.

The chart above shows net imports bottom out in late spring, March and April and heads back down again in June. Below is the last year of that chart amplified.

Weekly Net Imports

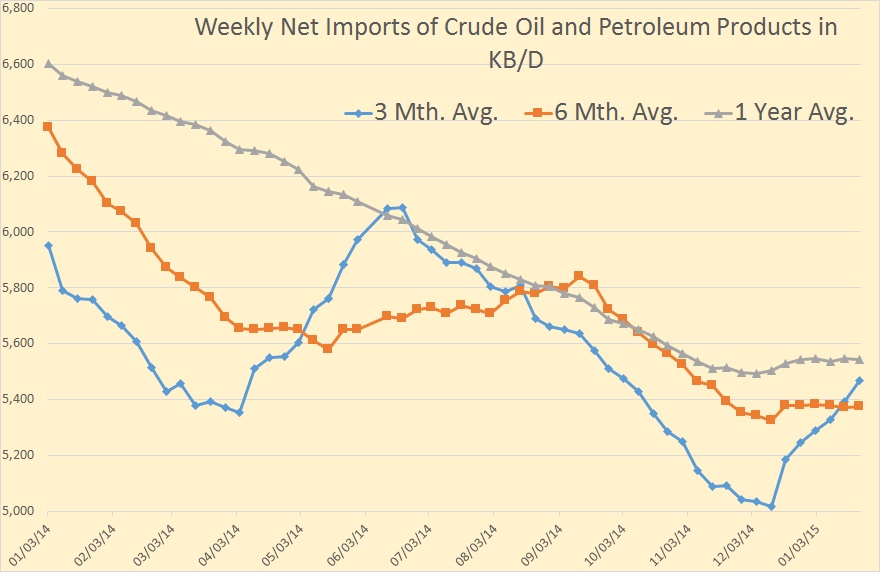
But in December of 2014 net imports broke their trend and headed sharply up, about four months earlier than normal. Much of this increase in imports had to be caused by declining US production though part of it could be caused by increased consumption because of low prices.
Read More

Worldwide Drilling Productivity Report

The EIA publishes what they call a Drilling Productivity Report in which they claim that each rig is getting more productive, that is each rig produces just a little more oil each month than it did the previous month. But over the long haul, I find that the exact opposite is true. In every place in the world, each rig produces a little less oil every year.

Baker Hughes publishes monthly their International Rig Count where we can find the world rig count back to 1975. However I only looked at the last 15 years and found some surprising results.

The last “Rig Count” data point on all charts below is December 2014. Also, very important, the rig count includes rigs drilling for gas as well as oil since Baker Hughes does not break down international rigs down to either gas or oil. They just give us the total rig count.World Rig Count

The last price collapse we had, in late 2008, the rig count dropped by over 1,570 between September 2008 and May 2009.US Rig Count

1,114 of that 1,570 rig count decline in 2008 and 2009 came from the US alone. That was the number of rigs dropped by the us between September 2008 and June 2009. Read More

OPEC Crude Oil Production, What’s Next?

The latest OPEC Monthly Oil Market Report is out with OPEC production data for. The data is “Crude Only” and does not reflect condensate production.

Also the charts, except for Libya, are not zero based. I chose to amplify the change rather than the total.

All Data is in thousand barrels per day with the last data point December 2014.

OPEC 12

OPEC 12 production has averaged slightly above or below 30 million barrels per day for about two years now and there is little chance it will go anywhere very fast. But what is obvious from the above chart is there has been no surge in OPEC oil production. OPEC’s December production f 30,204,000 barrels per day is still more than 1.4 million barrels per day below the peaks of 2008 and 2012.

Algeria

 Algeria is struggling to keep production relatively flat. 

Angola

Angola is holding its own… so far.

Read More

Texas RRC oil and Gas Production Data

The Texas Railroad Comission has released their oil and gas production data for November. As most of you know, the Texas RRC data is always incomplete. Some data is updated immediately but the rest trickles in slowly, sometimes taking many months to years to complete. Nevertheless we can glean some indication of what is happening from what data is reported. That is, if production is increasing, then the incomplete month to month data should be increasing. And it is, but very slowly.

The last data point in all charts below is November 2014 and the oil is in barrels per day.

Texas RRC Crude Only

Texas crude only is still increasing but the increase rate seems to be slowing down.

Texas RRC Condensate

It is rather hard to tell what condensate is doing but the rate if increase, if any, seems to be slowing.

Read More

Are Mountrail’s Sweet Spots Past Their Prime?

This is a Guest Post by Rune Likvern   Fractional Flow

This post is an update on total Light Tight Oil (LTO) extraction from Bakken in North Dakota based upon actual data as of October 2014 from North Dakota Industrial Commission (NDIC). It further presents a statistical analysis on developments of well productivity with a detailed look at developments in Parshall, Reunion Bay and Sanish.

  • There were general improvements in LTO well productivity in Bakken during 2013.
  • Present trends in LTO well productivity for Mountrail’s sweet spots (Alger, Parshall, Reunion Bay, Sanish and Van Hook) suggests these are past their prime.
  • Figure 29 in this post show development in well productivity for Alger and Van Hook and figures 06, 08 and 10 for Parshall, Reunion Bay and Sanish. A common feature for Parshall, Reunion Bay, Sanish, and Van Hook is that these reached new highs in well productivity for wells started in 2013.
    Alger has been in general decline since 2011.
  • LTO extraction in recent years may be viewed as a source for global swing production for oil.

Rune 1NOTE: Actual data used for this analysis are all from North Dakota Industrial Commission (NDIC). Data are incomplete for around 2% of the wells.

For wells on confidential list, data on runs were used as proxies for extraction.

Production data for Bakken, North Dakota: Monthly Production Report Index

Formation data from: Bakken Horizontal Wells By Producing Zone

The important messages from this analysis are the trends in well productivity.

This post is an update and expansion of my post “Will the Bakken “Red Queen” Have to Run Faster?” from the summer of 2013 and may be read as a continuation of my post “Will the Bakken Red Queen Outrun Growth in Water Cut?”.

Rune 2a Read More