Peak Oil and The Blibbit Principle

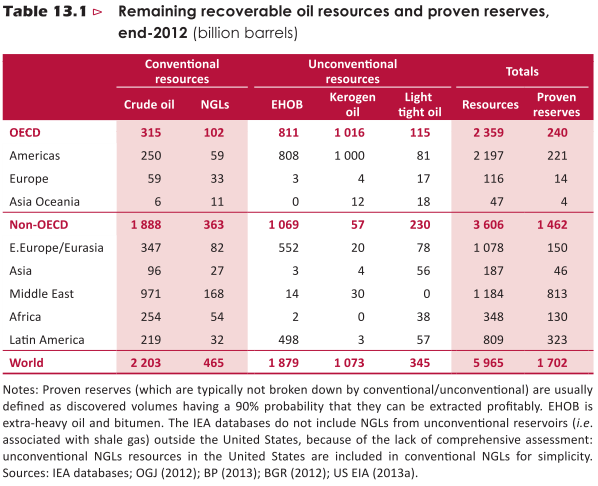
Podunk was a small town Arkansas. Back about a hundred years ago Podunk had no sewage plant, everyone just used outdoor toilets. But a problem soon developed, Podunk’s water supply became contaminated. That’s when they decided to build a blibbit* in which they would store their crap. This blibbit was built out of wood and placed on a hill in a convenient location, right in the middle of town.

The blibbit was almost circular, about 100 feet in diameter. Poles, similar to utility poles, were placed in the ground about 10 feet apart and boards were nailed to them to form the sides up to about 10 feet high. Then every few days everyone in town would haul their crap to the blibbit and dump it in. After a few years the blibbit was full so they added a few more boards to raise the sides higher.

But then someone noticed that the bottom boards were bulging out and appeared about to rupture. “She’s gonna burst” the person shouted to everyone in town. “Nah, maybe it will hold a bit more” was what most people said.

Then a few years later the blibbit was full again so they nailed a few more boards a little higher up on the poles and continued to dump in their crap. The bottom boards became even more strained and looked like they would pop this time for sure. “She’s gonna burst” a couple of more people started yelling. Naw, that’s what you said five years ago you were wrong. So we should not listen to you.

Then about five years later the blibbit became full again. More boards were added and more crap was dumped in. “She’s gonna blow this time for sure. The blibbit has reached peak crap for sure.” “Listen stupid”, was the reply, “that’s what you said 10 years ago, then again 5 years ago, and you were dead wrong. “And because you were wrong in the past means you have to be wrong now.”

Now here is my question: Because the peak blibbit crap people were wrong in the past, does that mean it is more likely they are wrong now? Or, is it even more likely they are right now because the situation has deteriorated even more since the early days of peak blippit crap predictions?

We are all asked, from time to time, what do we think is going to happen to this or that down the road. No one gets asked that question more than peak oilers. And every peak oiler seems to have a slightly different opinion. I have, in the past, reframed from making predictions as to when crude oil extraction will peak. I did so out of fear that I would be wrong and cornucopians would throw it up to me later. But I have now gone out on a limb and now predict that Crude Oil, or rather C+C will peak no later than 2017. I strongly believe the peak will be in 2016 but it could be a year or two earlier but no later than 2017.

World

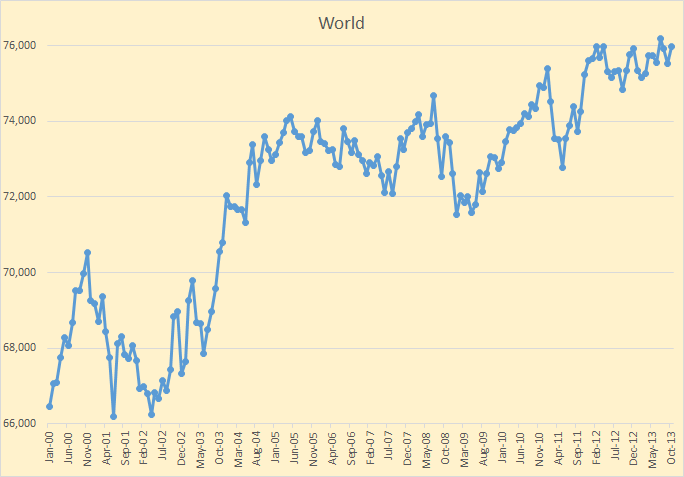
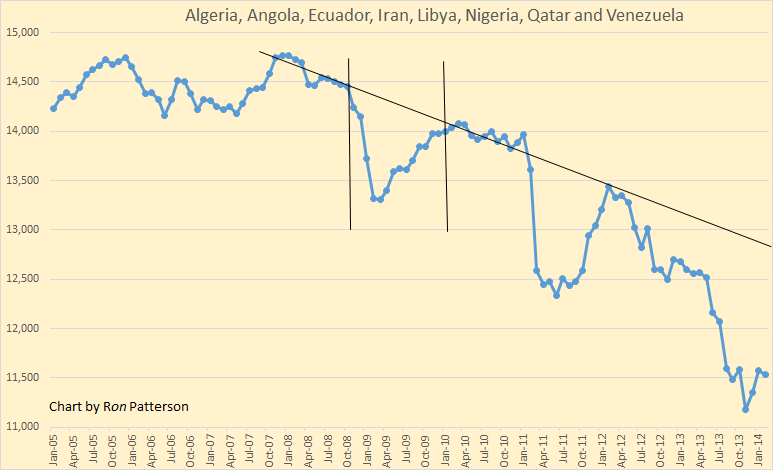
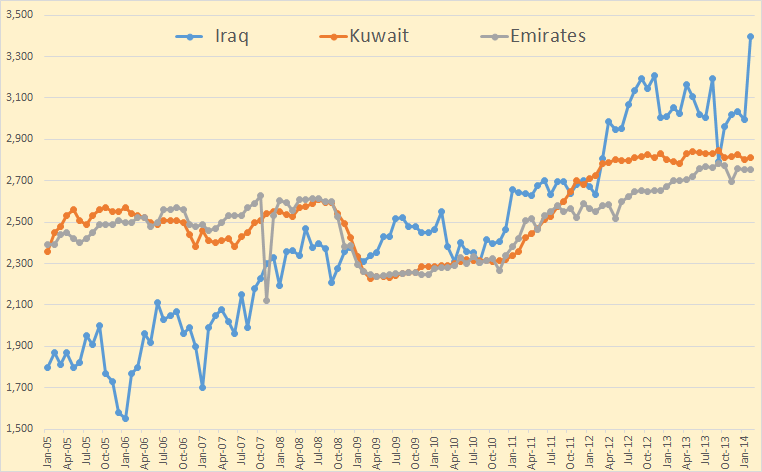
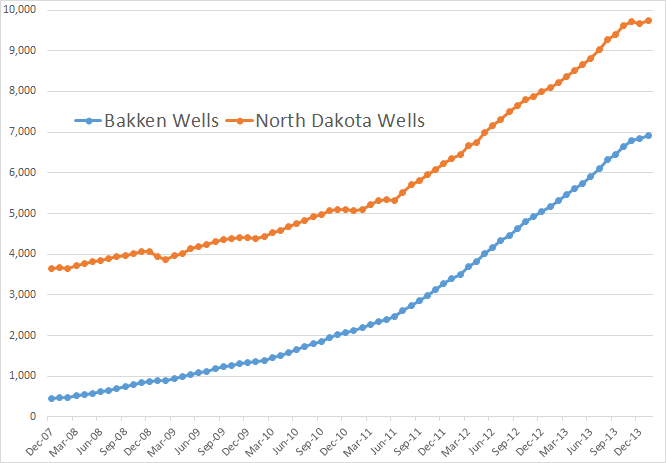
In spite of all the hoopla about the US shale boom world C+C has been relatively flat for two years.

Read More

A Look At OPEC Plus US States January Production Numbers

News Bulletin: Caught this on The Motley Fool:

Is Chesapeake’s Reduced Oil Production Growth Forecast Really That Bad?
But the company recently said that its crude oil production growth will slow dramatically this year — an announcement that clearly disappointed investors, judging by the immediate negative impact on Chesapeake’s share price. But is the guidance really that big of a deal?

I couldn’t find anything else about this story. Chesapeake doesn’t have anything in the Bakken but they are big in Eagle Ford. They drilled eight Bakken wells and they were all duds so they pulled out. But is this something that is happening to other Eagle Ford producers? 

The notion persist that OPEC has millions of barrels per day of spare capacity and could increase production if only they desired to do so. Many, in fact most people, really believe that all 12 OPEC nations are operating as a cartel and that perhaps all OPEC nations could increase production if they got the word. I think that idea is absurd and only the truly naive and those who know virtually nothing about the history and ability of OPEC could possibly believe such nonsense. And OPEC has done nothing to squash that idea.

OPEC Upstream Spare Capacity
Spare OPEC crude oil capacity is set to stabilize at around 8 mb/d over the medium-term, rising from an average level of around 4 mb/d in 2011. 

2011 was the year of the Libyan Revolution. At the beginning of that year three countries, Saudi Arabia, Kuwait and the UAE, combined, did have about 1.6 mb/d of spare capacity. The other eight OPEC countries had none. And by January 2012 all 12 OPEC were producing flat out, in my opinion anyway.
However not everyone believe that OPEC has that much spare capacity.

US oil boom may cushion any Venezuelan supply shock CNBC
“A geo-political risk premium in crude oil prices related to Venezuela is likely non-existent at present,” said UBS commodity strategists Giovanni Staunovo and Dominic Schnider in an email to CNBC on Saturday. “This could change at any time considering OPEC’s spare capacity is between 2.5 and 3.0 million barrels a day and Venezuela produced 2.5 million barrels a day in January. A loss of a large share of this capacity would not pass crude oil prices unnoticed.”

Commodities Now
Using IEA figures for 2013, OECD Europe imported 3.05 Mb/d of crude oil from Russia, or 36% of their net crude oil imports. When refined products, NGLs, and other feedstocks are included, total net oil imports rose to 4.33 Mb/d, or 44%, of OECD Europe’s net oil imports. These volumes far exceed Saudi/OPEC spare capacity of less than 2 Mb/d.

I found many statements on the web talking about how the markets get jittery when spare capacity gets too low and when it gets high they settle down. My question is: <b>How do they know?</b> So let me show you some production charts and see what you think.

EDIT: To those who believe Saudi has spare capacity I would just like to point out that Sadad Al Husseini, a former executive at Saudi Aramco, disagrees with you.
“This is strictly, totally business,” said Sadad Al Husseini, a former executive at Saudi Aramco, the state oil company.
Saudi production is flat out. Where you send it is a matter of where you make the best profit.”

OPEC 8X

The above eight OPEC countries are clearly in decline. the two vertical lines mark the actual cut in production by OPEC responding to the price collapse in late 2008. One year later all eight nations were producing flat out again. The slanted line shows the actual decline in production for these eight OPEC countries. The end of the line marks the “approximate” spot where their production would be except for the Iran sanctions and the Libyan political problems.

One of those eight, Shell Vice President says that Nigeria, is is steep decline.
Nigeria’s Crude Oil Production Decline Rates Pegged at 20 Per Cent

The Vice President of Shell Upstream International, Mr. Markus Droll has said that decline rates in crude oil production within Nigeria’s hydrocarbon industry can be as high as 15 to 20 per cent.

Droll also said that replacing such natural production decline rates in the industry requires more funds than is currently available and that the peculiar high cost operational environment of Nigeria has further compounded the situation.

Iraq, Kuwait, UAE

Here are the other OPEC countries with the exception of Saudi Arabia. Iraq has advertised the fact that they want to produce 12 mb/d but they are a long way from that number. But there is no question that they are producing every barrel possible.

Kuwait and the UAW did cut production after the collapse of 2008. And unlike the other eight, they both, along with Saudi Arabia kept those cuts through 2010. Then when the Libyan revolution hit in 2011 they all began to ramp up production as much and as fast as they could. And by 2012 every OPEC nation was again producing flat out.

Read More

Revisiting the IEA’s World Energy Outlook 2013

I was going over the IEA’s World Energy Outlook 2013 and noticed a few things you might find interesting. Exactly what is their opinion on Peak Oil? Here, cut and pasted from the report.

IEA 2

 Got that? The URR is great enough to delay any peak until after 2035. Here is one of their graphs that indicate how much they think is left, coal, gas and oil.

IEA 1

Okay 54 years of proven reserves. That puts the peak out to well past mid century. Likely well past 2100 if you count those remaining recoverable resources. And just who has all this oil?

IEA 10

2.2 trillion barrels of conventional crude oil resources. However only 1.7 trillion barrels of that has a 90% probability of being recoverable. Of this the Middle East has the lions share, 971 billion barrels of resources with a 90% probability of recovering 813 billion barrels of that.

Read More

Texas RRC Crude and Condensate Data, Is Eagle Ford Peaking?

This page Texas Oil and Gas Production was last updated on February 18. However the data on this page has been updated. And the January production has been updated also: Oil and Gas Production Data Query then check “Lease”, “Both”, Statewide and then punch in the appropriate dates. Then when the next page comes up click on “Monthly Totals”. This brings up the updated monthly totals for Crude, Casinghead Gas, Gas Well Gas and Condensate.

There were revisions going back to July 2010 but only 2013 had any major revisions though there were some 2012 revisions also as the chart below shows.

Texas Revisions

The earlier revisions were smaller and there were some of them that were negative. That is the figures were revised downward.

This chart compares Texas with North Dakota. This is all Texas not just Eagle Ford. The last data point for all is January 2014.

Texas + North Dakota

Though there is a lot of conventional production in Texas, the increase is nevertheless about all tight oil. And these two states produce perhaps 95% of all tight oil produced in the United States. And that is about 2  million barrels so far if the Texas RRC is close.

Read More

Bakken Update with January Production Numbers

Second Update: I am still waiting for the Texas Railroad Commission monthly update. I had hoped it would be out today. However I will have a new post out tomorrow evening, March 21, whether they update tomorrow, or not. I have some good graphs from Jean Laherrere and one from Roger Blanchard that I will post.

Okay Another Update: Dennis Coyne has just posted me the numbers and link for Texas Condensate production. Now we can finally figure out what is going on in Texas.

More tomorrow

The North Dakota January production data is out for The Bakken and All North Dakota. Bakken production was up by 6,031 bp/d to 871,672 bp/d. But that was after December production was revised up by 2,744 bp/d. All North Dakota production was up by 6,446 to 933,133 bp/d. But that was after December production was revised up by 3,460 bp/d.

Bakken Barrels Per Day

From the Director’s Cut

The drilling rig count was down from Dec to Jan and the number of well completions
dropped from 119 to 60. Days from spud to initial production decreased 10 days to 122.

Investor confidence appears to be growing. There are over 100 wells shut in for the Tioga gas plant conversion in an attempt to minimize flaring, but the biggest production impact story continues to be the weather. January temperatures were only 6 degrees below normal with only 3 days too cold for fracturing work, and there were no major snow events, but 12 days had sustained wind speeds too high for well completion work.

At the end of Jan there were about 660 wells waiting on completion services, an increase of 25.

North Dakota wells increased by 59 to 9,734 while Bakken wells increased by 92 to 6,926.

Bakken Wells

Perhaps it is just bad weather but there is definitely a slowdown in number of wells.

Read More