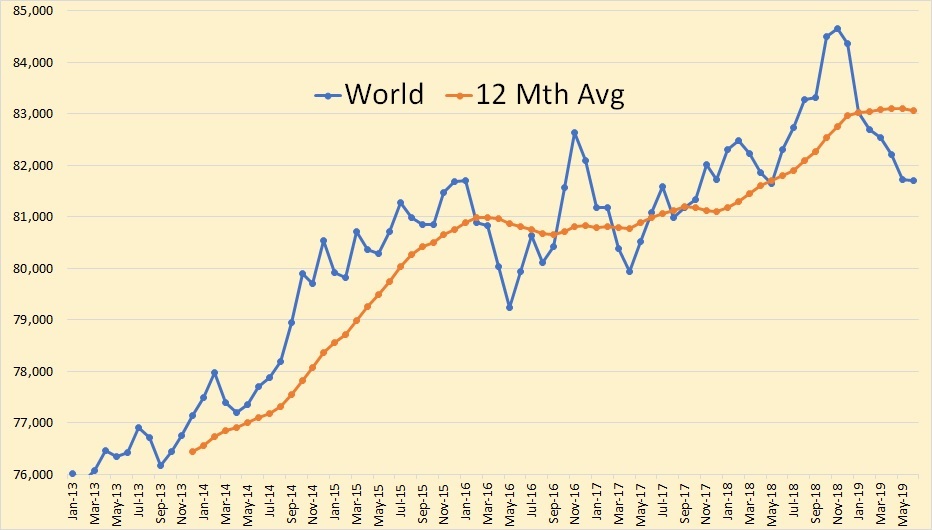
All data for this post is from the EIA’s
Petroleum Supply MonthlyAll USA data is through July and the World data is through June 2019. All data is in thousand barrels per day.

All data for this post is from the EIA’s
Petroleum Supply MonthlyAll USA data is through July and the World data is through June 2019. All data is in thousand barrels per day.

All data below is from various sources. All US data is from the EIA. Unless otherwise noted is in thousand barrels per day.

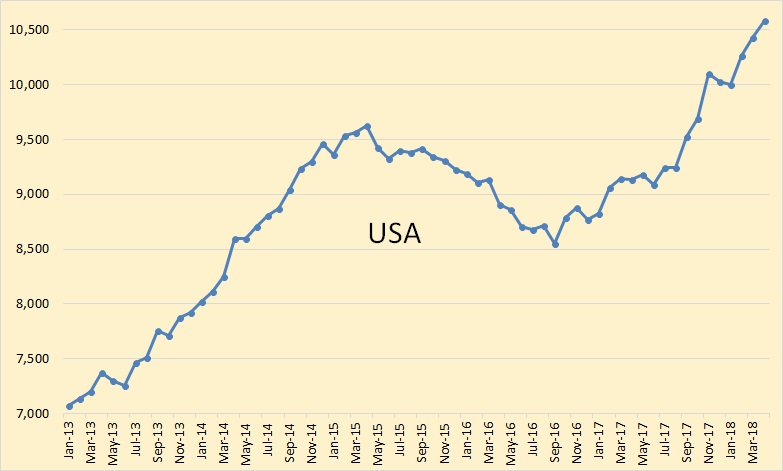
US C+C production through April, 2018. For the last 8 months, the average increase in US production has been 168,000 bpd. Most of this has come from the Permian.