World Oil Output Last 3 Years

The EIA publishes every possible energy stat for the USA and hardly anything for the rest of the world. Well, anything current for the rest of the world anyway. Their International Energy Statistics is already five full months behind and working on six. December 2014 is the last international oil production data we have.

Anyway during this lull in other data I decided to look at the last three years of international data, from December 2011 to December 2014. All data is in thousand barrels per day.Post 1
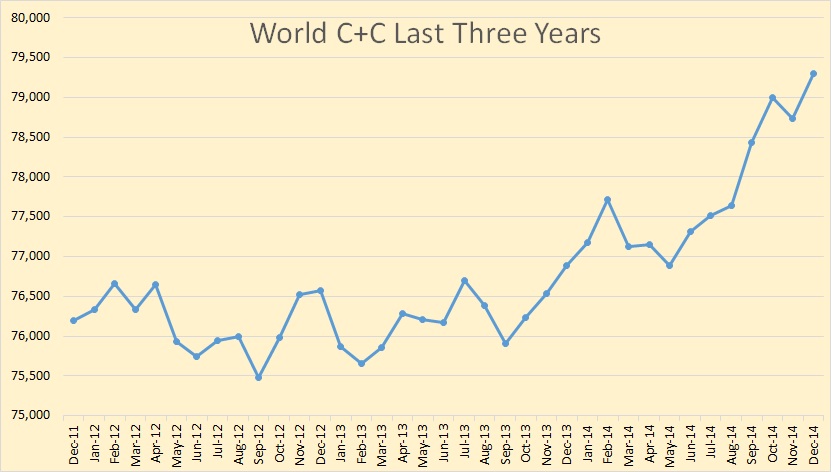
World C+C production was flat for most of 2012 and 2013 but in late 2013 production took off and has increased by about 3 million barrels per day above the average for 2012 and 2013. December C+C production was 79,300,000 BPD.
Read More

World Exports versus Consumption, The ELM

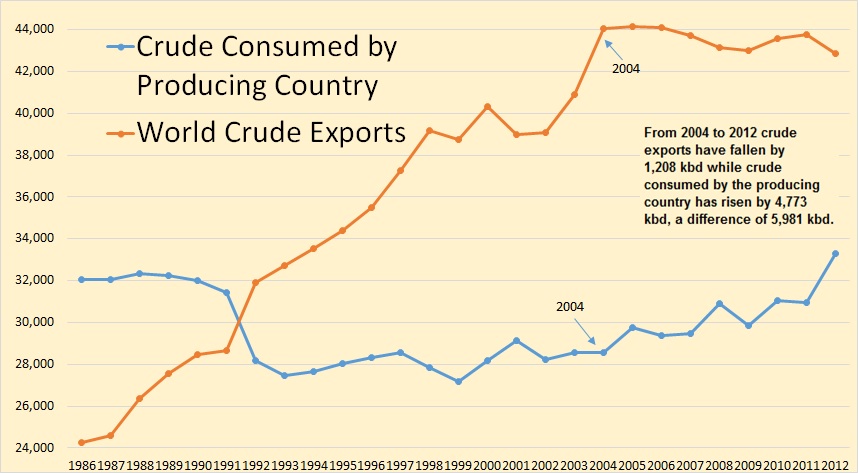
The EIA has updated their International Energy Statistics with annual production numbers through 2014 and export data through 2012. Sometimes these stats can be confusing as they include several types of production and exports. But for production I use only “Crude plus Condensate” and for exports I used “Crude Oil Exports” which I assume includes condensate as well.

Also the export data is not exact, just close, because some importers are also exporters. For instance in 2001 the US exported 59,000 barrels per day. In 2012 the US exported 629,000 barrels per day. The exporting of condensate is allowed in the US and since the Shale boom condensate exports have increased quite dramatically because Light Tight Oil is rather top heavy with condensate.

To get exports versus consumption for exporting nations I simply subtracted their exports from their production. The difference was what they consumed. Similar data can be found on the Energy Export Databrowser.

I think the data clearly endorses Jeffrey Brown’s Export Land Model.

World E v C

In 2012 76,160,000 barrels of C+C were produced per day. Of that 76 million barrels 42,845,000 barrels were exported while the other 33,315,000 barrels was consumed by the producing nations. That is this is oil that was never exported.

Read More

Texas RRC March Production Data

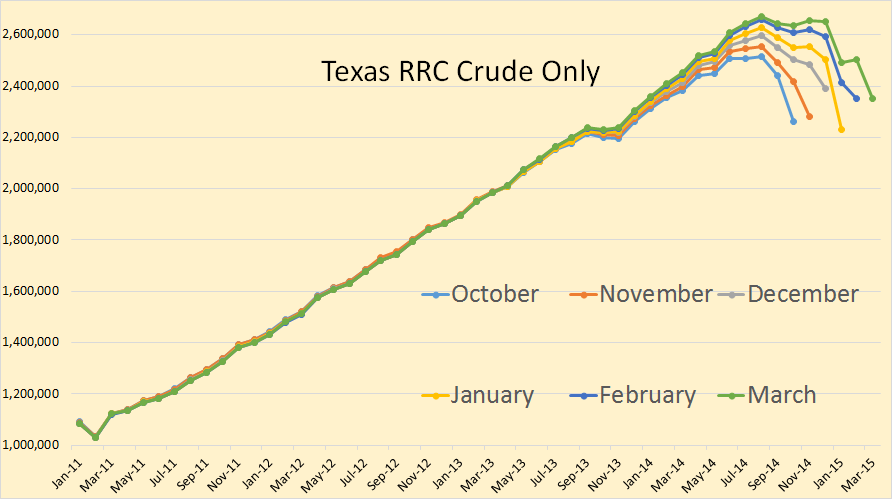
The Texas RRC is out with their latest Oil and Gas Production Data. Looks like oil production has leveled out with March production pretty much level with February. All RRC data is trough March 015.

Texas Crude Only

I always show the last 6 months or the RRC data in order to get a pretty good indication of which way data production is moving. From the data you can see that December was a very good month but January was just awful. February was a lot better and March was about the same as February.

Dean 1

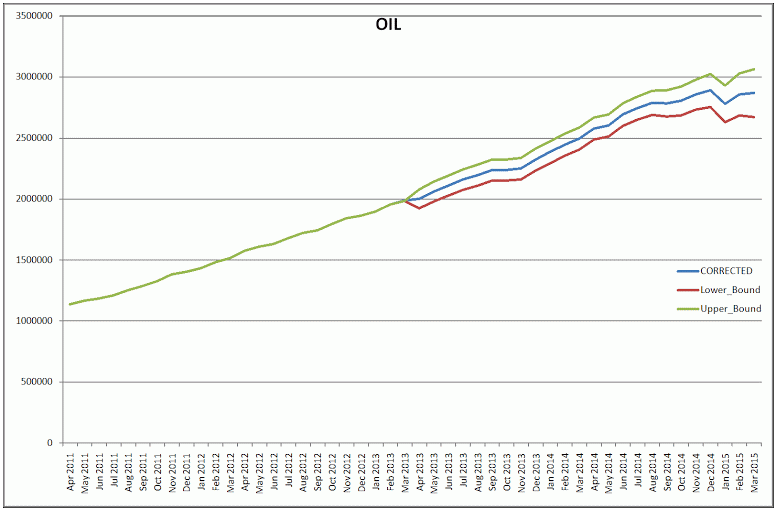
The chart above was created by Dean Fantazzini, PhD, of the Moscow School of Economics. He has developed an algorithm which predicts what the data will reflect after the final data has come in. His data suggests that Texas crude has plateaued.

Read More

Eagle Ford, Permian Basin, and Bakken and Eagle Ford Scenarios

This is a guest post by Dennis Coyne

Increased oil output in the US has kept World oil output from declining over the past few years and a major question is how long this can continue. Poor estimates by both the US Energy Information Administration (EIA) and the Railroad Commission of Texas (RRC) for Texas state wide crude plus condensate (C+C) output make it difficult to predict when a sustained decline in US output will begin.

 About 80 to 85% of Texas (TX) C+C output is from the Permian basin and the Eagle Ford play, so estimating output from these two formations is crucial. I have used data from the production data query (PDQ) at the RRC to find the percentage of TX C+C output from the Permian (about 44% in Feb 2015) and Eagle Ford plays (40% in Feb 2015).

Dean’s estimates of Texas C+C output are excellent in my opinion and are close to EIA estimates through August 2014. I used EIA data for TX C+C output through August 2014 and Dean’s best estimate from Sept 2014 to Feb 2015. By multiplying the % of C+C output from the RRC data with the combined EIA and Dean estimate, I was able to estimate Eagle Ford and Permian output. The chart below shows this output in kb/d.

  
blog150427/

Read More

Texas RRC February Production

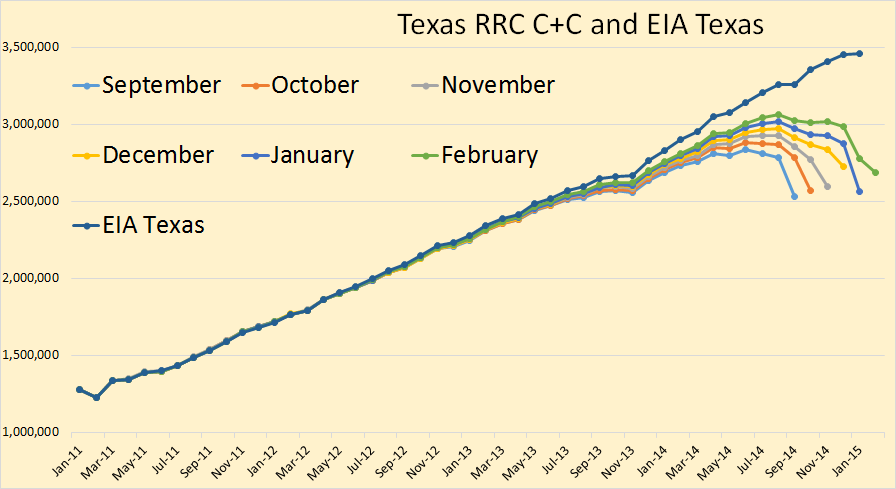
The Texas Railroad Commission has released its  incomplete production data for February.  The RRC also estimates final production but that data has not been posted yet.

All Texas RRC data is through February. The EIA data is through January.

Texas C+C

It looks like, after the final Texas data comes in, that February crude oil will be above January production but still below December production. It is my best guess that Texas production will be down about 80,000 barrels per day in January and up about 50,000 bpd in February or about 30,000 bpd below December production.

Texas Crude Only

I always post the last six months data just so we can get some idea of the general trend. You can see the general trend is up until January when it took a huge hit and only partially recovered in February.

Read More