Non-OPEC Oil Production Starts to Rebound

A post by Ovi at peakoilbarrel

Below are a number of oil (C + C ) production charts for Non-OPEC countries created from data provided by the EIA’s International Energy Statistics and updated to June 2020.  Information from other sources such as OPEC, the STEO and country specific sites is used to provide a short term outlook for future output and direction for a few countries.
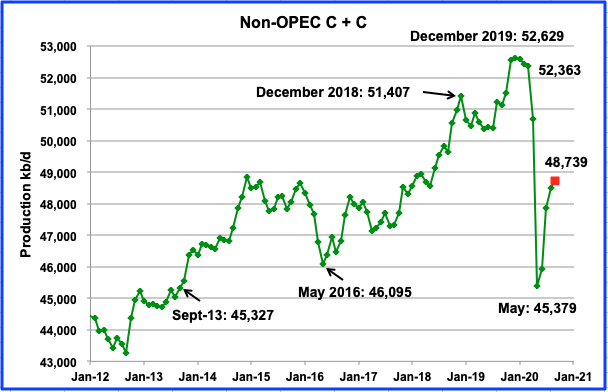
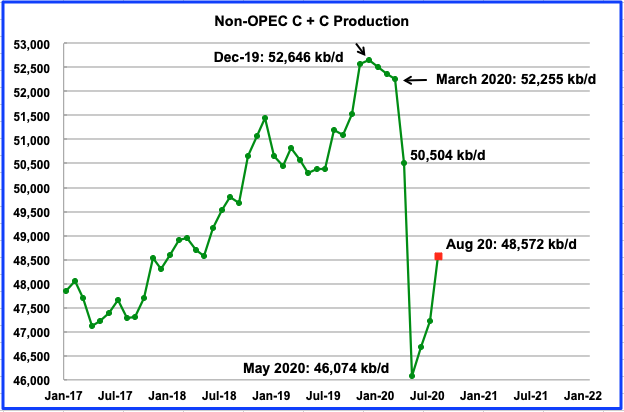
Non-OPEC production has started to rebound from the May low of 45,379 kb/d. According to the EIA, June’s output added 564 kb/d to May’s to end up 45,943 kb/d. Using data from the STEO, a projection for Non-OPEC output was made to September. September output is expected to rise to 48,739 kb/d, with the biggest increment occurring in July, close to 1,000 kb/d. Of the 1,000 kb/d, 500 kb/d will be provided by the US.

Read More
Are Non-OPEC’s Best Days in the Rear-view Mirror

A post by Ovi at peakoilbarrel.

While this post updates Non-OPEC production to January 2020, we are now in late May and the direction for future production for the next few years is clear, LOWER than where it was in March 2020. OPEC, in response to the reduced worldwide demand, arranged for a production reduction through a Declaration of Cooperation (DoC) with OPEC and Non-OPEC countries. Also Canada and Norway have indicated they will be cutting production in response to world wide reduced demand. The OPEC + DoC reduction schedule and chart are shown and discussed at the end of this post.

Read More

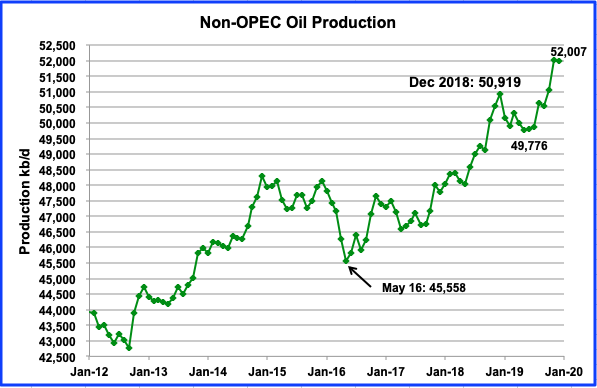
Non-OPEC Oil Production Punches New High

A post by Ovi at peakoilbarrel

As I wrote in my previous post, preparing these last two has been a surrealistic exercise. The oil market environment for this post has been even more surrealistic than the previous one and the associated futures contract prices have been extremely volatile this week. The May WTI front month contract went negative on April 20 for the first time ever and closed at negative $37.63/bbl while the June contract closed at $20.43. Today’s settled price, April 24, for the June contract is $16.94.

On April 7th, OPEC + finalized a record oil production cut of 9.7 Mb/d after days of discussion. The 9.7 million bpd cut will begin on May 1 and will extend through the end of June.  The cuts will then taper to 7.7 million bpd from July through the end of 2020, and 5.8 million bpd from January 2021 through April 2022. The 23-nation group will meet again on June 10 to determine if further action is needed.

The lone hold out to the deal was Mexico which was expected to cut 400 kb/d but would only agree to 100 kb/d. This was a real Mexican standoff and Mexico won because they had hedged their oil output and the more the price dropped, the more they made on their hedges. According to this report, they hedged their oil at $49/bbl in January. It was unclear how many barrels were hedged or how much was spent.

Read More

Texas RRC Report + More About Russia

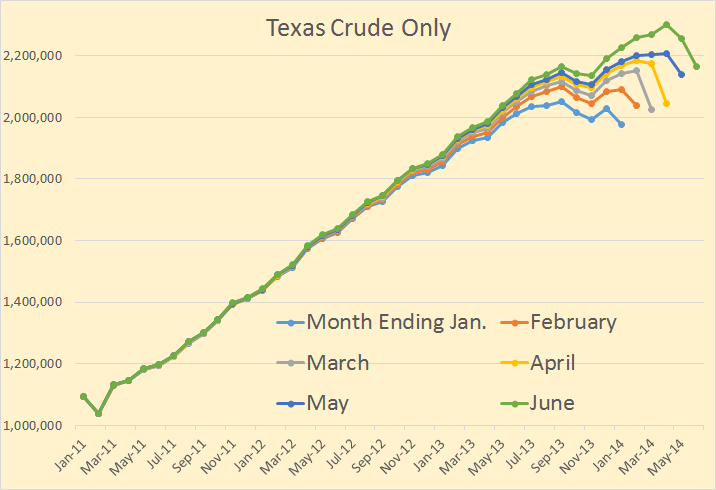
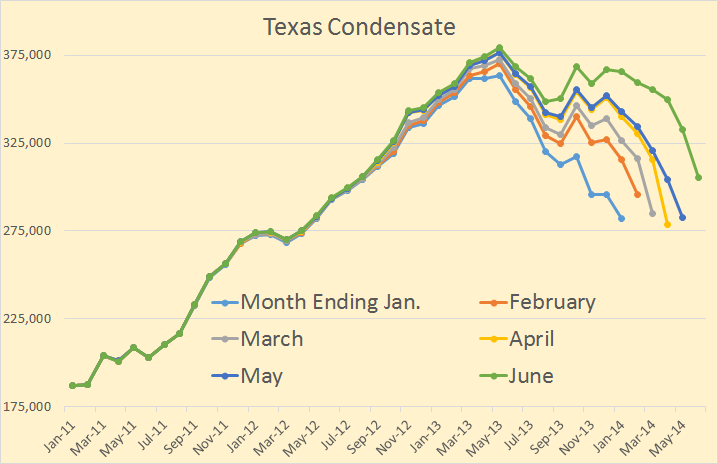
The Texas RRC Oil and Gas Production Data is out with the June production numbers. I must repeat, as I do every month, that this data is much delayed and is and will be subject to updates every month, for about two years. Of course the latest months will be the ones which will be subject to the greatest revisions.

All oil data is in barrels per day. The last data point on all charts is June 2014.

Texas Crude Only

I have six months of data here to give you some idea of the revisions that can be expected in the coming months. Texas crude only is still increasing. My guess is that it is increasing by about 40 thousand barrels per month.

Texas Condensate

Texas condensate declined for three months in June, July and August of 2013 but has now started to increase again. I estimate that Texas condensate is currently increasing but only some months. It looks like Texas condensate production in some months is declining but in other months is still increasing by as much as 4 to 6 thousand barrels per month.
Read More