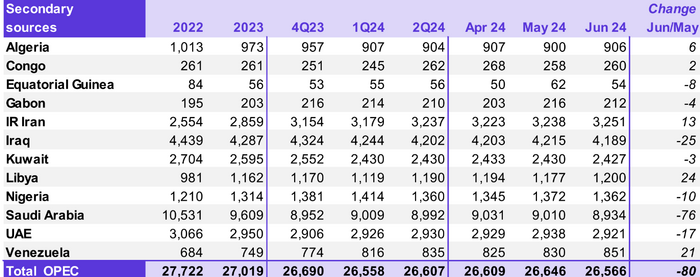
The OPEC Monthly Oil Market Report (MOMR) for July 2024 was published recently. The last month reported in most of the OPEC charts that follow is June 2024 and output reported for OPEC nations is crude oil output in thousands of barrels per day (kb/d). In the OPEC charts below the blue line with markers is monthly output and the thin red line is the centered twelve month average (CTMA) output.
Tag: Permian
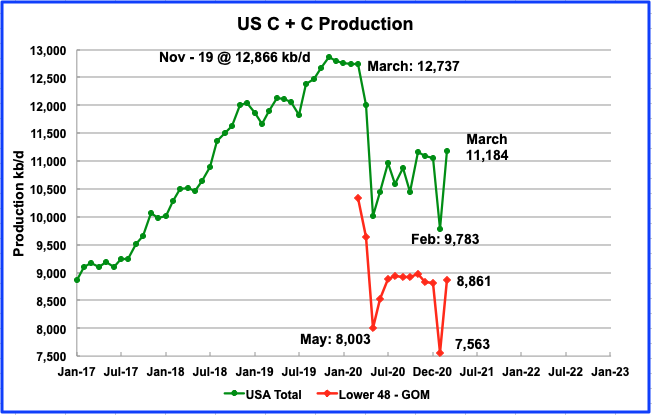
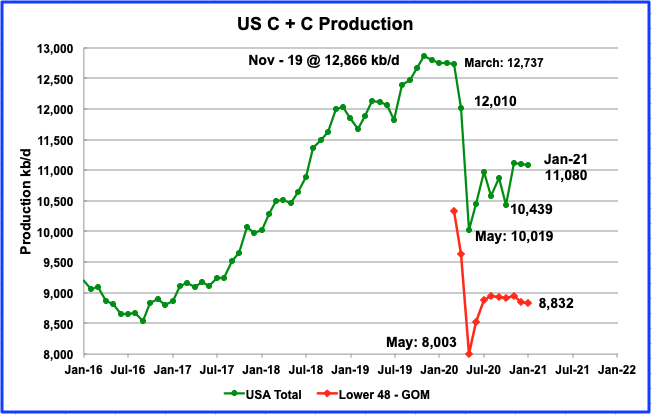
US January Oil Production Continues Slow Slide
A post by Ovi at peakoilbarrel.
All of the oil (C + C) production data for the US state charts comes from the EIAʼs Petroleum Supply monthly PSM. After the production charts, an analysis of three EIA monthly reports that project future US production is provided. The charts below are updated to January 2020 for the 10 largest US oil producing states.
Note: This post is not an April Fool’s joke. I really am publishing the latest official EIA information available, January production in April.
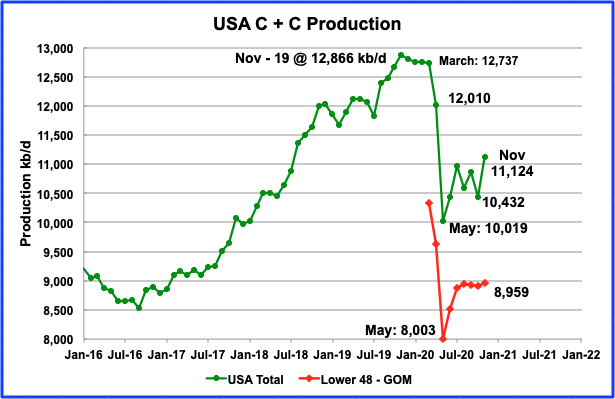
Read MoreUS November Production Rebounds After Hurricane
A post by Ovi at Peakoilbarrel
All of the oil (C + C) production data for the US state charts comes from the EIAʼs Petroleum Supply monthly PSM. After the production charts, an analysis of three EIA monthly reports that project future US production is provided. The charts below are updated to November 2020 for the 10 largest US oil producing states.
Read MorePermian Basin- The Death of Tight Oil Has Been Greatly Exaggerated
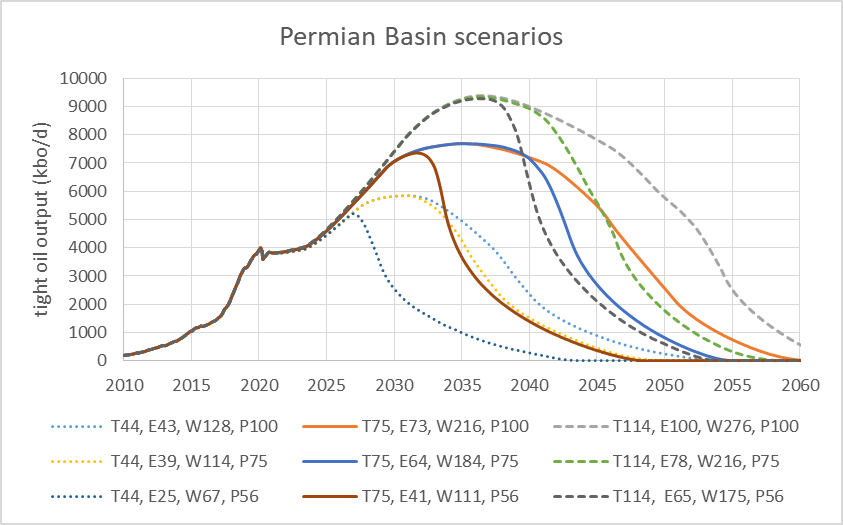
The future of tight oil output in the US will depend in large part on future development of Permian Basin resources in Texas and New Mexico. I have developed nine scenarios for future Permian basin tight oil output based on 3 levels of technically recoverable resources (TRR) and 3 different future oil price scenarios. These are summarized in the chart below.
Read More