GoM Summary Part IV: Company Details

A Guest Post by George Kaplan

Production is dominated by major international companies particularly, and maybe surprisingly, European ones. Principally Shell and BP, but with Equinor, Eni, Total and Repsol also active and many are (or were) seemingly wanting to expand in the area. Maybe this is an example of reciprocal technology transfer: the North Sea was initially developed with a lot of American offshore know how and there it may now be the reverse is happening as deeper water fields using floating and subsea systems are developed.

Read More

OPEC August 2020 Oil Production

All OPEC data below is from the September OPEC Monthly Oil Market Report. The data is through August 2020 and is in thousand barrels per day.

NOTE: This new theme is screwing up the size of my charts. It seems it has a size threshold where they have to be slightly larger than my input charts to show up larger. I will have it fixed by next my next post where all the charts show up larger.

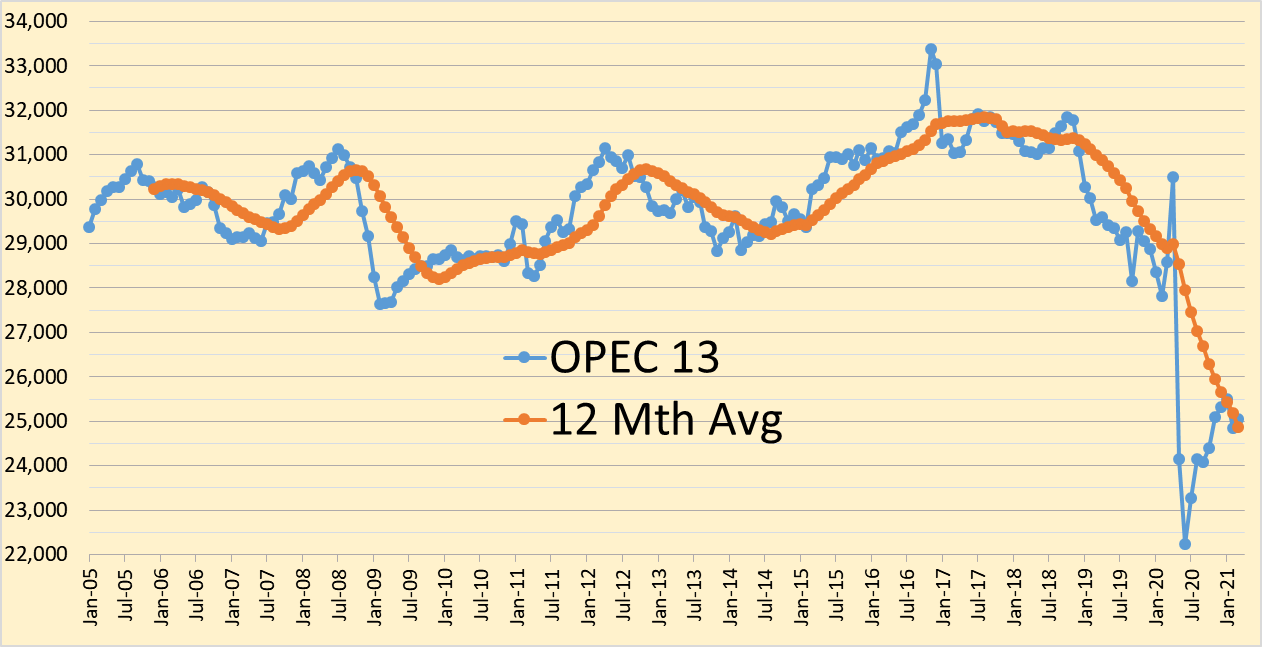
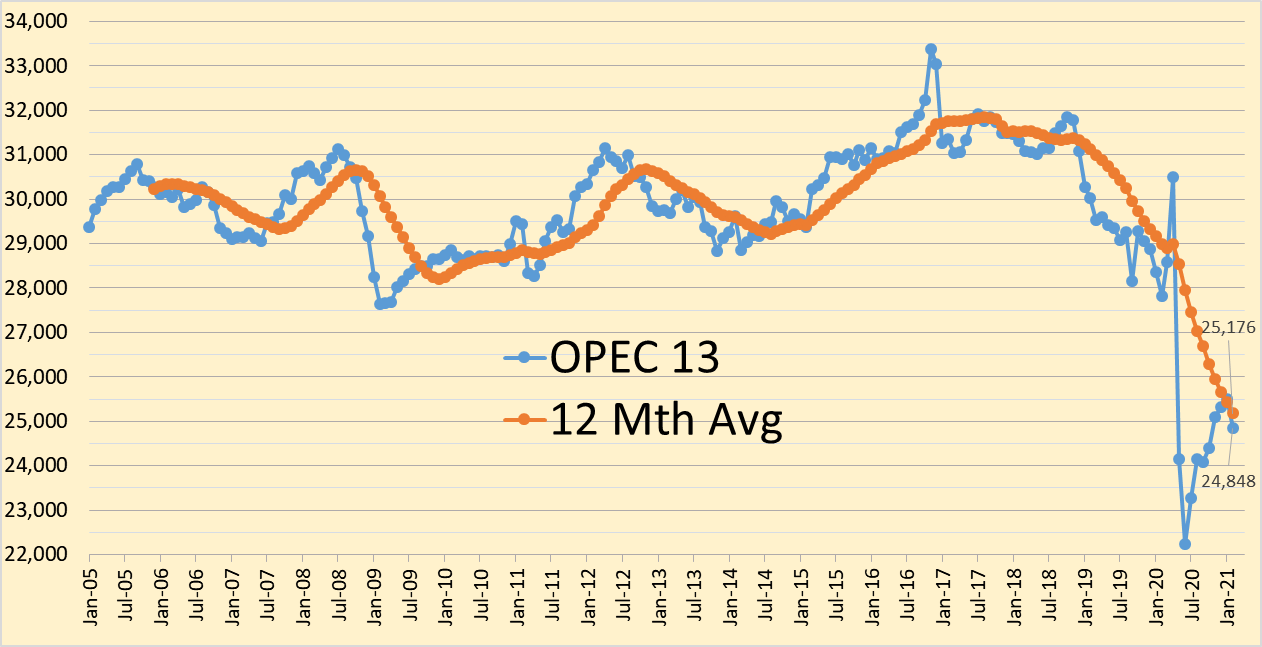
OPEC 13 crude only production was up 763,000 barrels per day in August. However, that was after June production was revised upward by 50,000 barrels per day and July production was revised upward by 110,000 barrels per day.

This is the data used in the charts below. It is basically a composite of reports by several production tracking agencies.

Read More

US May Production Plunges 2Mb/d

A post by Ovi at peakoilbarrel

All of the oil (C + C) production data for the US states comes from the EIAʼs Petroleum Supply monthly PSM. At the end of the production charts, an analysis of three different EIA monthly reports projecting future production is provided. The charts below are updated to May 2020 for the 10 largest US oil producing states.

May’s production drop is just short of 2 Mb/d by 11 kb/d. Awesome. US oil fields began a slow and steady decline from November 2019 to March 2020. March brought the combination of CV-19 and oil price drop that led to the sharp production plunges in April and May. Since the current EIA data is two months delayed, May is the second month that shows the combined effects of the pandemic and low oil prices. Will June drop below 10,000 kb/d?

Read More

US GoM 2019 Summary: Part III – Production

A Guest Post by George Kaplan

Overall Annual Production

US Gulf of Mexico C&C production has had a series of peaks; firstly two from shallow oil, the middle acceleration probably caused by the mid seventies oil shock; followed by deep oil development and finally by ultra deep oil, with a dip in the middle from the Deep Horizon drilling hiatus. Most production has come from eastern and central (i.e. mainly Louisiana) with some, and falling, from the western section (Texas).

Read More