Dennis Coyne, an editor and frequent contributor to this blog, has suggested that we are not at peak oil. He argues that there is likely to be a dip in production starting next year but higher prices will cause things to turn around and we will surpass the 2015 peak by 2019. He commented a few days ago:
If we take some of the larger producers that have been increasing output and compare with the rest of the world(ROW) using EIA data from Jan 2004 to June 2015 (using the trailing 12 month average to focus on the trend) we see ROW decline has been relatively modest (1.4% based on the trailing 12 month output in June 2015). The eight increasing producing countries I have chosen are Brazil, Canada, China, Iran, Iraq, Russia, Saudi Arabia, and US and ROW=World minus the 8 countries just listed.
One possible scenario is that output is flat for the Big 8 in 2016 so that World C+C output falls by 485 kb/d in 2016 (average output for the year compared to the 2015 average). Over the 2009 to Jun 2015 period the Big 8 increased output at about 1300 kb/d per year, if we assume this rate slows to half the previous rate to a 650 kb/d per year increase (1.4%/year), then the peak is surpassed in 4 years in 2019. On a per country basis this would be a little more than a 80 kb/d increase in average annual output for each of these countries, though I doubt it would be divided equally.
So I have taken close look Dennis’s “Big 8” countries as well as “The Rest of the World”, and looked at their JODI data charts. The last data point is October 2015.
First, the rest of the world.
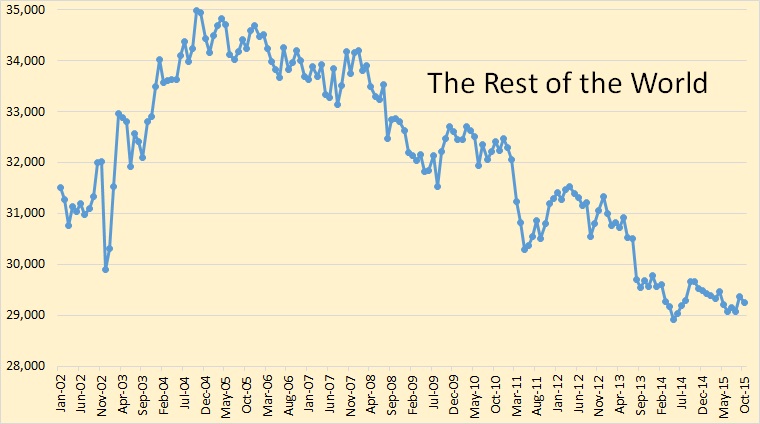
This is the world less Brazil, Canada, China, Iraq, Iran, Russia, Saudi Arabia and the USA. As a group they peaked in October 2004 and have been in decline ever since. They have declined in times of low oil prices and high oil prices. And barring a miracle they will continue to decline.
Read More
