EIA begins monthly survey-based reporting of U.S. crude oil production
With the release of today’s Petroleum Supply Monthly, EIA is incorporating the first survey-based reporting of monthly U.S. crude oil production statistics. Today’s Petroleum Supply Monthly includes estimates for June 2015 crude oil production using new survey data for 13 states and the federal Gulf of Mexico, and revises figures previously reported for January through May 2015.
From the EIA’s Monthly Crude Oil and Natural Gas Production webpage.
Beginning with the June 2015 data, EIA is providing estimates for crude oil production (including lease condensate) based on data from the EIA-914 survey. Survey-based monthly production estimates starting with January 2015 are provided for Arkansas, California, Colorado, Kansas, Louisiana, Montana, New Mexico, North Dakota, Ohio, Pennsylvania, Texas, Utah, Wyoming, and the Federal Gulf of Mexico. For two states covered by the EIA-914—Oklahoma and West Virginia—and all remaining oil-producing states and areas not individually covered by the EIA-914, production estimates are based on the previous methodology (using lagged state data). When EIA completes its validation of Oklahoma and West Virginia data, estimates for these states will also be based on EIA-914 data. For all states and areas, production data prior to 2015 are estimates published in the Petroleum Supply Monthly. Later in 2015, EIA will report monthly crude oil production by API gravity category for the individually-surveyed EIA-914 states.
This is great news for those of us who have been complaining for years about the EIA’s poor and misleading data collection methods.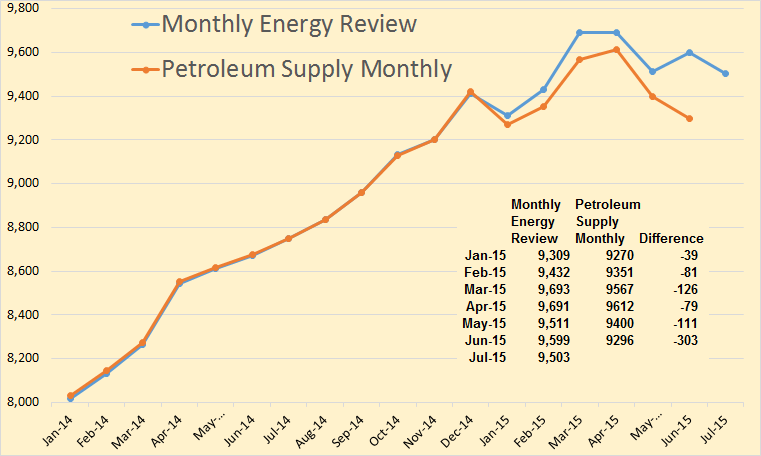
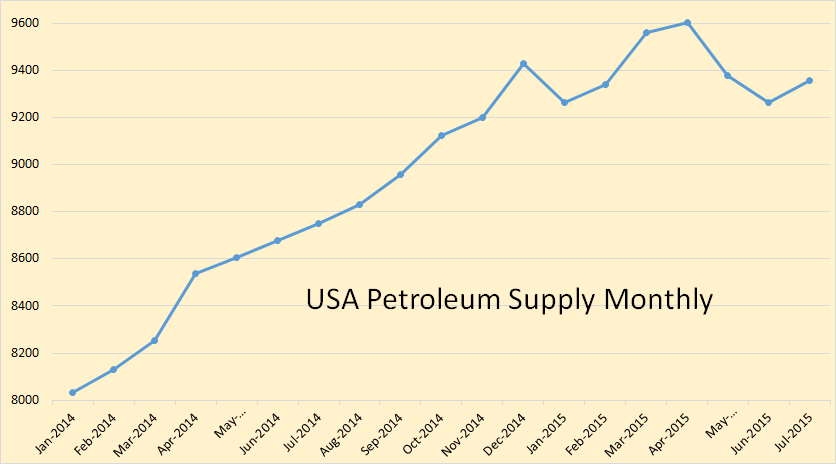
June C+C production, according to the Monthly Energy Review, was almost 9.6 million barrels per day. But the Petroleum Supply Monthly cuts that by 303,000 bpd. And they have production dropping by 316,000 barrels per day in the last two months, May and June.
Read More
