The EIA’s International Energy Statistics

The EIA, a few days ago posted their International Energy Statistics. They publish lots of statistics here but on monthly basis I only follow their  production of world Crude Oil including Lease Condensate.

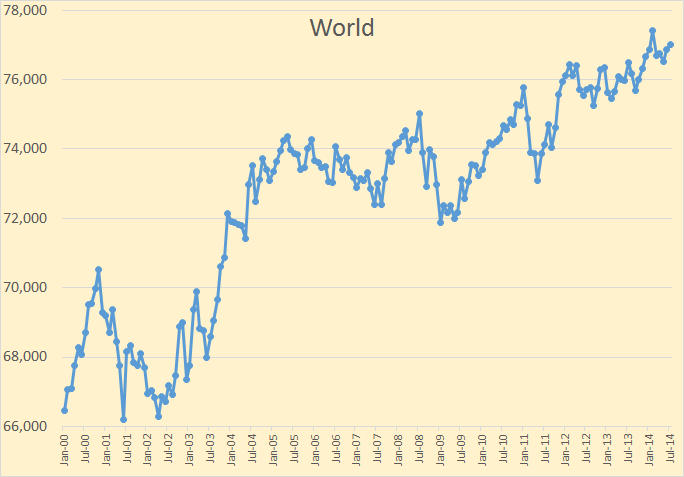
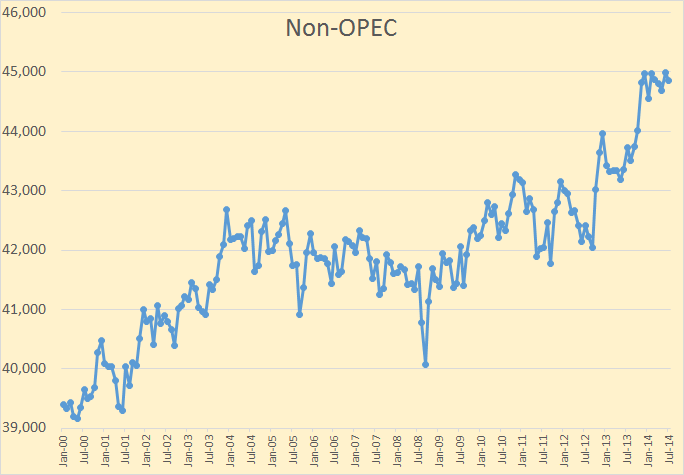
The data on all charts below is Crude + Condensate production through July 2014 and is in thousand barrels per day.

World

World C+C production was up 168,000 bpd to 77,023,000 bpd. The high, so far, was in February at 77,409,000 bpd.

Non-OPEC

Non-OPEC C+C was down 135,000 bpd from it high so far. It has been on a 9 month plateau high.

Read More

World Crude Oil Exports

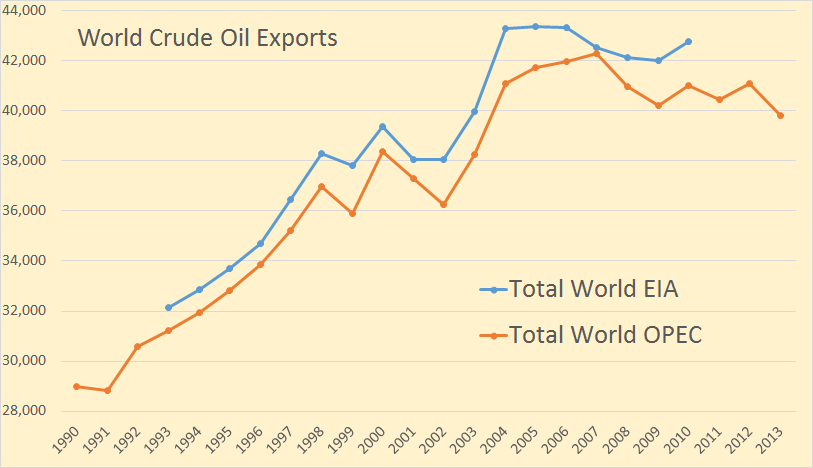
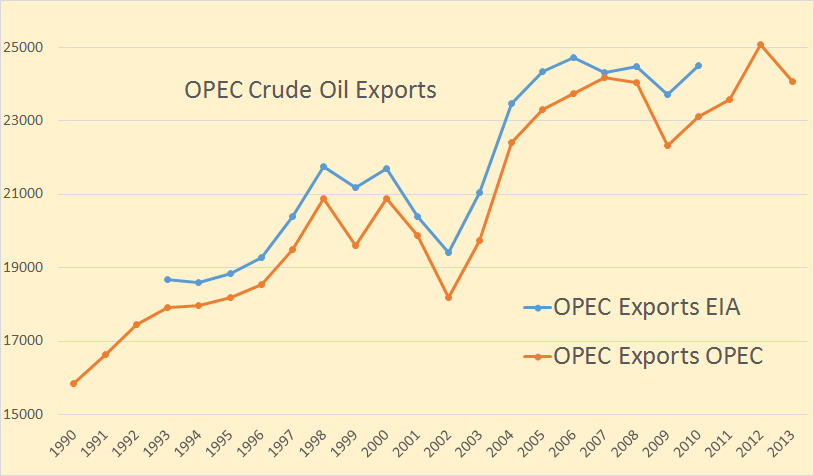
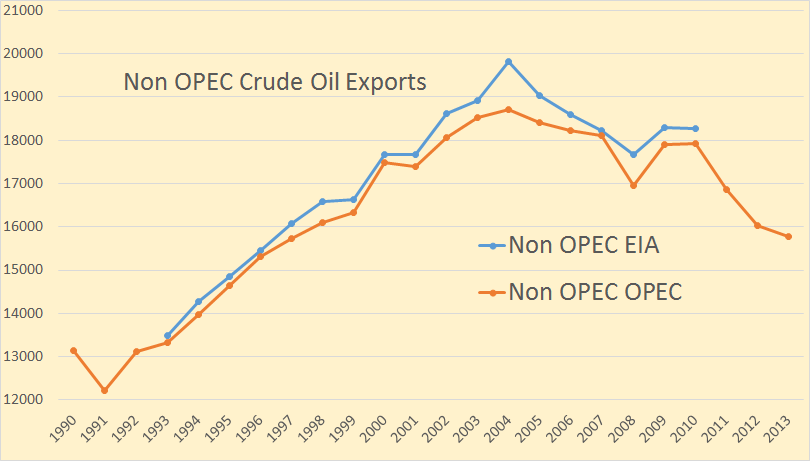
OPEC has released their Annual Statistial Bulletin 2014. Under the heading of “Oil and Gas Data” there are several tables you can download. I was excited to find one labeled “Table 3.21: World Exports of Crude Oil and Petroleum Products by Country”. It turned out to be useless however as it includes a lot of exports of imported products. And they have no table of “Net Imports”. However their their table labeled Table 3.18: World Crude Oil Exports by Country” turned out to be very useful as it seems to measure the same thing as the EIA does in their International Energy Statistics, Crude Oil Exports which also includes lease condensate.

The OPEC export data goes back to 1960 but I have only plotted it from 1990. The EIA data only goes back to 1993. The OPEC data is through 2013 while the EIA data only goes through 2010 except for Canada, Mexico and Norway which goes through 2012. All data is in thousand barrels per day.

World Exports

World crude oil exports peaked in 2007 and now stand 42,297,000 bp/d and in 2013 stood 2,467,000 bp/d below that point. World crude oil exports in 2013 were 2,467,000 barrels per day below peak and at the lowest point in 10 years.

OPEC Exports

OPEC exports peaked, so far, in 2012 at 25,068,000 barrels per day. Their exports fell by just over 1,000,000 barrels per day last year and I am betting they will fall further this year.

Non OPEC Exports

Non-OPEC exports have taken a hit in the last few years, peaking in 2004 and are down just under three million barrels per day since then.

Read More

How Soon Will the World Oil Production Peak?: A Hubbert Linearization Analysis

This is a Guest Post By “Political Economist”

In this informal paper, I conduct Hubbert Linearization exercises on the world’s 11 topoil producers as well as the rest of the world. The results are used to project the world oilproduction in the future. The evidence presented in this exercise suggests that the world oil production may peakin 2018 or a few years later.

Hubbert Linearization

Hubbert Linearization (first developed by M. King Hubbert) is a statistical techniqueoften used in the peak oil literature. Hubbert Linearization assumes that oil production rises and falls following a pattern thatcan be described by a logistic function:

Q(t) = URR / [1 + EXP (a(Tpeak-t))]

Q(t) is the cumulative oil production up to year t, URR is the ultimately recoverable oil resources, EXP represents the natural exponential function with the Euler’s number “e” being the base, “a” indicates the intrinsic growth rate of the logistic function, Tpeak is the year of peak oil production, and “t” is the current year.

If one takes the derivative of the above equation with respect to “t”, the above equation can be reduced to: dQ/dt = aQ(1-Q/URR) Replace dQ/dt with P (current annual production) and divide both sides by Q:

P/Q = a – (a/URR) Q

If one uses historical data to conduct a linear regression of P/Q over Q, one can solve the two parameters: “a” and “a/URR”. URR (the ultimately recoverable resources) would be solved accordingly. The peak year could in turn be solved.

If one has historical data, Hubbert Linearization is relatively simple and straightforward. But the method has important limitations. Most importantly, it cannot predict future technical changes that will change the amount of recoverable resources. In many cases, the results of Hubbert Linearization are sensitive to the time period used for regressions. The selection of time period often depends on subjective interpretation of available data.

Nevertheless, Hubbert Linearization does reflect the outcomes of historical interactions of geological, economic, geopolitical, and technical factors as well as their evolving trends. When used carefully in combination with other available information, it can provide useful insights into the future trajectory of world oil production.

The World’s Largest Oil Producers

This paper uses BP’s definition of oil production, which defines “oil” as the sum of crude oil and natural gas liquids. The data are mostly from BP Statistical Review of World Energy, extended to 2013 using EIA’s International Energy Statistics.

By this measure, the world’s eleven largest oil producers in 2013 (ranked by their oil production) were Saudi Arabia, Russia, United States, China, Canada, Iran, Iraq, United Arab Emirates, Kuwait, Mexico, and Venezuela.

In this paper, all oil production statistics are stated in million tons. For a rough conversion, 50 million tons of annual oil production roughly equals 1 million barrels of daily production.

Figure 1
pefig/

Figure 1 shows the oil production of the eleven top producers as well as the rest of the world. From 2005 to 2013, the world’s total oil production increased by 192 million tons. Saudi Arabia’s oil production increased by 19 million tons, the Russian oil production increased by 57 million tons, the US oil production increased by 139 million tons, China’s oil production increased by 28 million tons, Canada’s oil production increased by 52 million tons, Iran’s oil production fell by 40 million tons, Iraq’s oil production increased by 66 million tons, the UAE oil production increased by 19 million tons, Kuwait’s oil production increased by 23 million tons, the Mexican oil production fell by 44 million tons, Venezuela’s oil production fell by 30 million tons, and the entire rest of the world’s oil production fell by 97 million tons.
Read More
EIA’s International Energy Statistics Updated

The EIA has finally updated their International Energy Statistics. They were a month behind so they caught up by updating two months of data. The last update had data through October. This update has the data through December 2013. They also updated their annual data page.

If you click on the link, then mouse over “Petroleum, Production” and click, you will get “Total Oil Supply”. That data is everything including ethanol, biodiesel, NGLs and even refinery process gain. I never use that data. After that page comes I go to the box labeled “Total Oil Supply” then click on the down arrow, then click on “Crude Oil including Lease Condensate” That is the data I use, that is all I use.

World Yearly

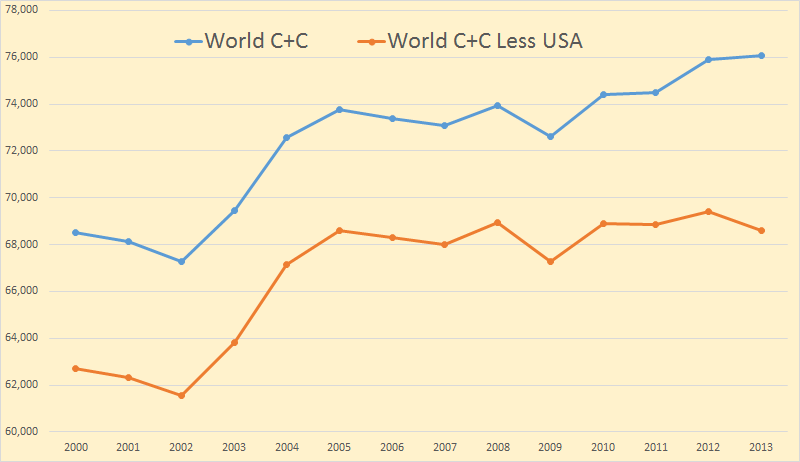
From the annual data I found total World C+C was up a mere 167 kb/d. US production was up 967 kb/d. That means that the World less USA was down 800 kb/d.

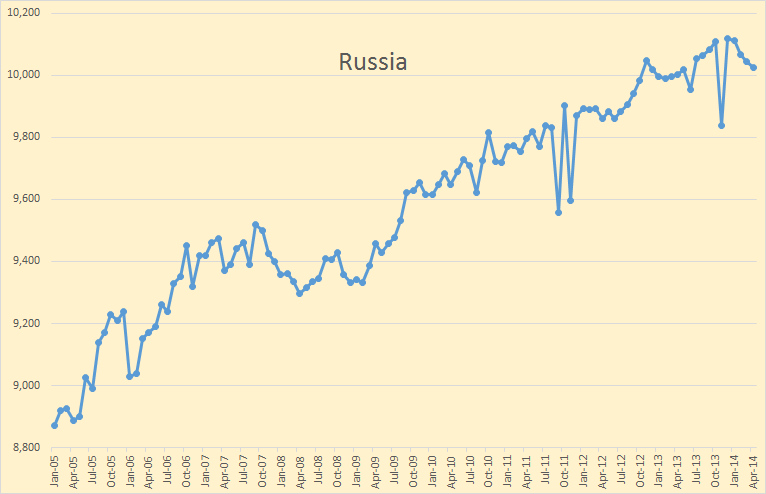
I have been following Russia pretty close on their website CDU TEK.

Russia CDU TEK

The data through December is from the EIA. The last four months, through April, I gleaned from the Russian website. Their data is daily in tons per day. I had to convert it and average it into monthly data but it is pretty close. Also, because the data on the above chart is non-zero based the increase appears greater than it really is. The increase averages out to be about one hundred thousand barrels per year.

I don’t know what the anomaly was in November. The JODI data does not show that but actually shows a peak in November 2013 above December.

Everyone has been expecting Russia to peak for several years. But their production has just kept inching up a little each year. This report is from five years ago: Alex Burgansky: Russian Oil and Gas Industry Surprises Analysts. Requires registration.

There are plenty of projects in Russia, both, new projects and existing brownfield projects. Russia is a very mature producer. If you exclude all the drilling activity taking place every year, then Russian organic decline in production is close to 19%. To compensate for that organic decline, Russia drills somewhere between 5,000 and 6,000 wells every year.

 This year, as I said before, some people expected production to collapse. We certainly never thought it would collapse, but we did think it would decline. Instead it’s actually growing as a result of benefits from past investments in the new fields coming on stream this year. But we’re simply running out of the pipeline of these new fields. Therefore, next year there will be a lot fewer fields coming on stream; in the absence of new incentives to put more money to work to grow Russian oil production, it will naturally start declining, with organic decline rates of around 19% and growing.

Read More