The EIA’s International Energy Outlook 2014

Last year I posted a lot of data published in the EIA’s Annual Energy Outlook 2014 published in May of last year, and the next one is due out Tuesday April 14. We are looking forward to that. But the EIA’s International Energy Outlook 2014, published last September, completely slipped by me. How did I miss that? But I looked at their predictions for world Crude plus Condensate production I found it very interesting.

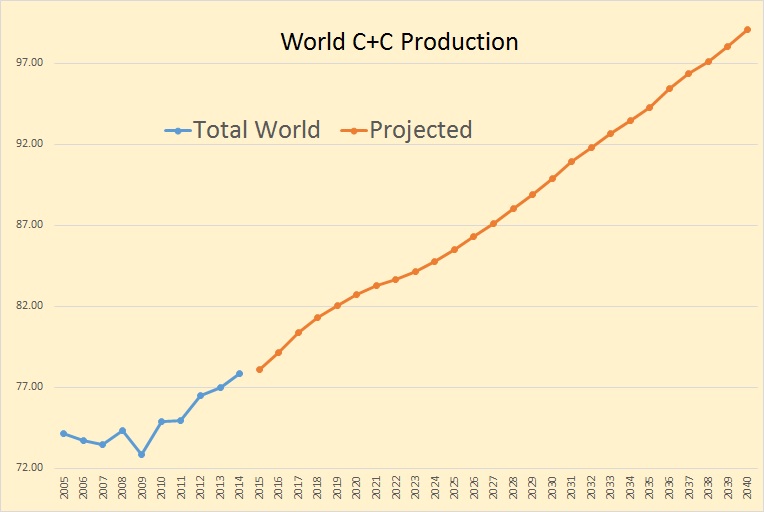
In the below, though the data was posted in September, I have assumed the 2014 data was complete. Though it may be a little off it is close enough for, as the saying goes, “government work”‘. The data is in million barrels per day with the last data point 2040.

IEO World

The EIA is expecting World C+C to reach just over 99 million barrels per day in 2040. That will be up 21.25 million bpd from 2014.

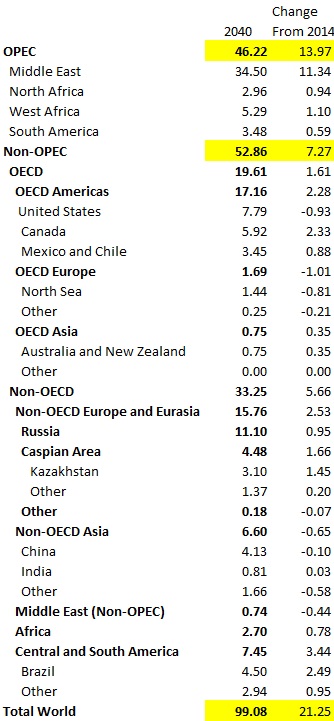
IEO Table

This chart shows just which countries, they believe, will be responsible for that 21.25 million bpd increase. That is except for OPEC. They do not break out OPEC production by country.

Read More

World Proved Oil Reserves, Fact or Fiction

The EIA publishes Annually a list of World Proved Reserves of Crude Oil. Though all charts in this post use the EIA data, BP, the IEA and virtually every other reporting agency in the world uses basically the same data. It is my contention that this data is misleading and totally meaningless. This is especially true of OPEC Middle East Reserves. However because this data is taken as gospel by the media and perhaps 90% of energy analysts in the world, this misinformation becomes a serious problem.

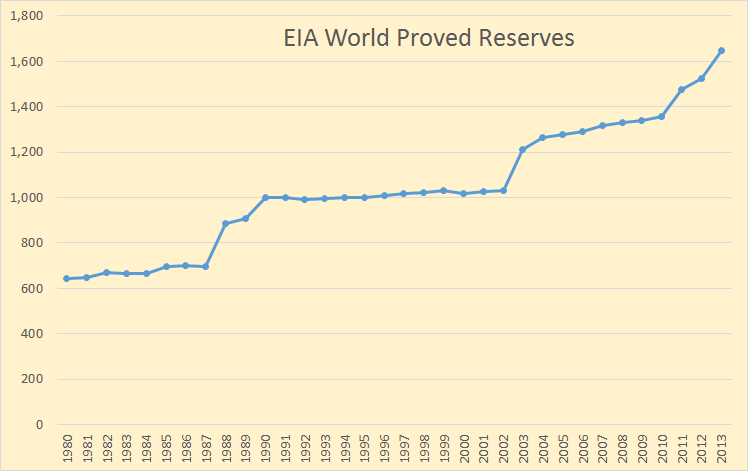
But first let’s look at the data. It dates to 2014 in most cases but some data only goes to 2013. All data is billion barrels of reserves.

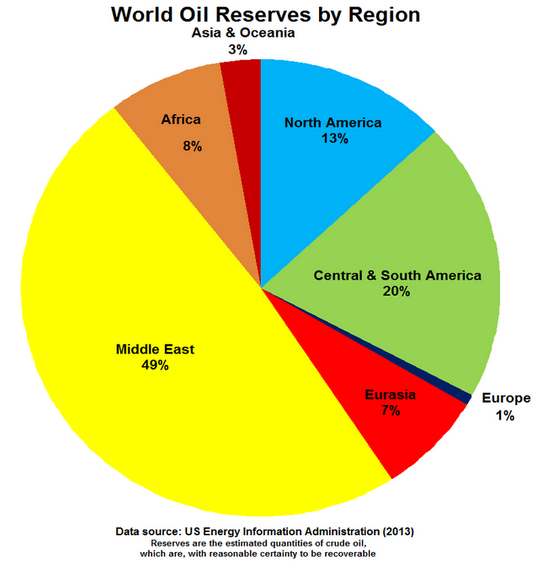
EIA World Proved Reserves The EIA said we had 1,646 billion barrels of proved reserves in 2013. Other agencies put that figure a bit higher but we will go with this. And just where are these reserves located?

World Oil Reserves by Reigon

Almost half of the world’s proved reserves are supposed to be located in the Middle East. Actually it would be well over 60% if it were not for the recent additions to world reserves by the Venezuela Bitumen and the Canadian Tar sands.

Read More

Did Peak Oil Arrive in 2014?

The recent price crash in crude oil, if it lasts for any length of time, will certainly affect oil production. The question is, just how great an effect will it have an how soon? But in this post I want to concentrate on what is, or was, happening to world oil production even before the price crash.

Russia, the largest producer of crude oil in the world, will peak in 2014. There are various estimates of how fast their production will decline but best case, for Russia, puts their decline at about 2% per year. They say they are depending on the Bazhenov Shale and Arctic offshore just to keep production flat in 2015. Well that is not going to happen, not in the next few years anyway. And if prices stay in the current range it is unlikely to ever happen.

OPEC is a wild card but there is little doubt that they are producing flat out right now. Only Iran has any real any real chance of increasing production very much and that only if sanctions are lifted. Libya has already increased production significantly and could increase more but very little. With the violence still going on in Libya, there is a greater chance that their production will decline.

But before we go any further let’s look at what the EIA is predicting for 2015 for both the USA and the rest of non-OPEC? The below charts are from the EIA’s Short-Term Energy Outlook. Current data is through October 2014 and the projected data is through December 2015. All data is in million barrels per day. Also, very important, the data is Total Liquids which includes NGLs, bio fuels and refinery process gain. The EIA, for US production even counts refinery process gain on imported oil.
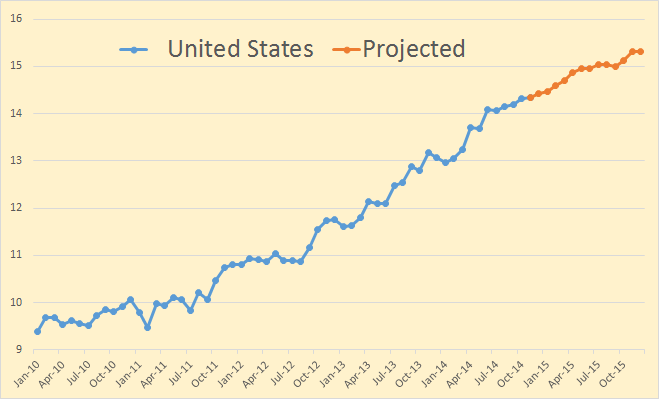
STOE USA

The EIA is predicting US average production total liquids will be up 1.49 million barrels per day in 2014 and up another 1.1 mbd in 2015. (I always use m for million and k for thousand.)
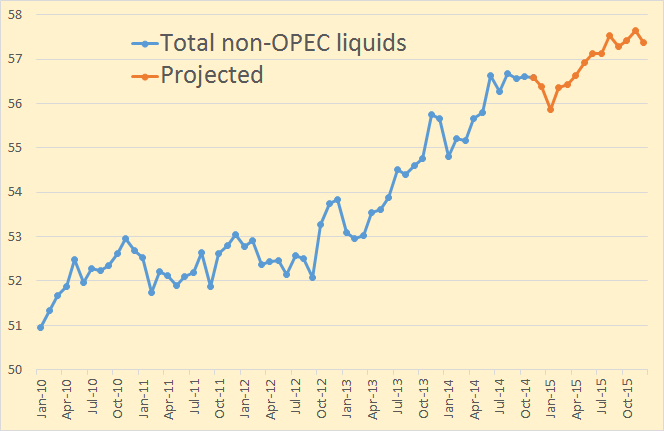
STOE non-OPEC

The EIA is predicting non-OPEC average total liquids will be up will be up 1.88 mbd in 2014 but only about half that, up .95 mbd, in 2015.

Read More
The EIA’s International Energy Statistics 2

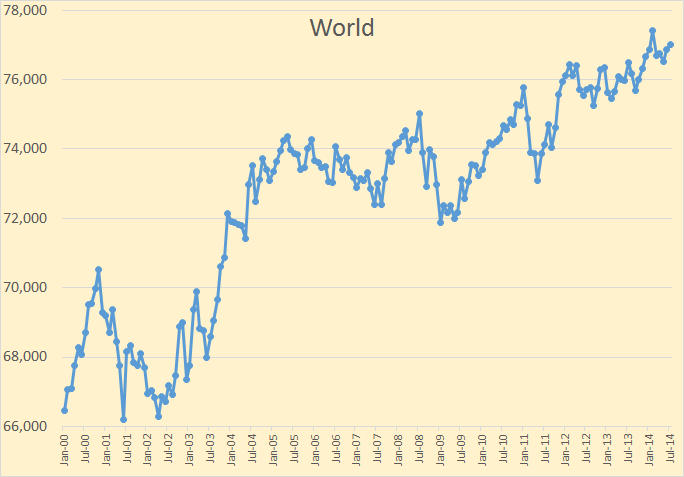
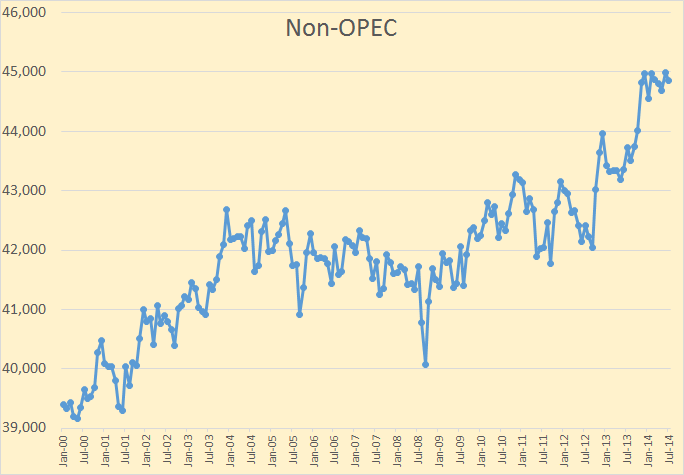
The EIA, a few days ago posted their International Energy Statistics. They publish lots of statistics here but on monthly basis I only follow their  production of world Crude Oil including Lease Condensate.

The data on all charts below is Crude + Condensate production through July 2014 and is in thousand barrels per day.

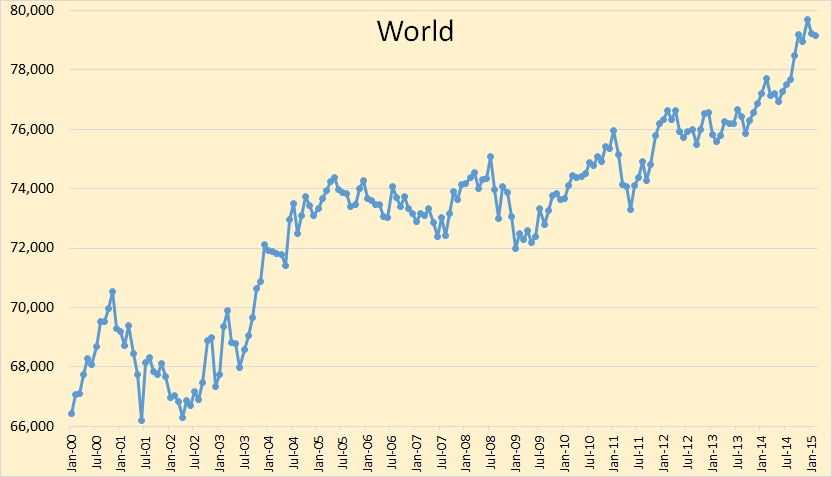
World

World C+C production was up 168,000 bpd to 77,023,000 bpd. The high, so far, was in February at 77,409,000 bpd.

Non-OPEC

Non-OPEC C+C was down 135,000 bpd from it high so far. It has been on a 9 month plateau high.

Read More