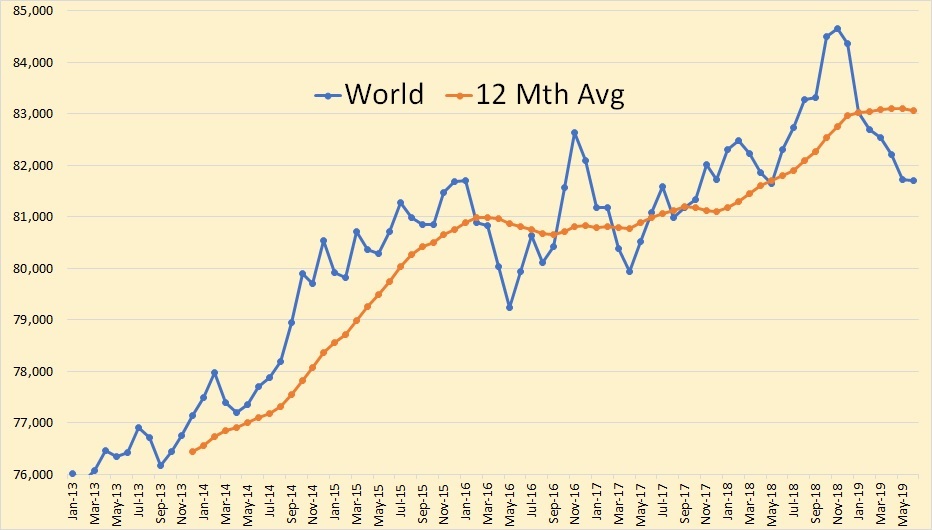
All data for this post is from the EIA’s
Petroleum Supply MonthlyAll USA data is through July and the World data is through June 2019. All data is in thousand barrels per day.

All data for this post is from the EIA’s
Petroleum Supply MonthlyAll USA data is through July and the World data is through June 2019. All data is in thousand barrels per day.

The Baker Hughes International Rig Count is out. I have decided to try something new with the charts. That is to compare the current year’s rig count with the previous two years count and to insert, within the charts, the percent change for this year as compared to last year. Also, this is the total rig count, Oil and Gas. Also the charts are not zero based. I do this in order to better emphasize the monthly change.
July usually sees a big jump in rig counts. This year there was a very tiny July increase, only a fraction of the increase we usually see for July.
*The Total International rig counts does not include the USA, Canada or the FSU. The Total International rig count was down 28 in July to 1118. Last July it was up3 to 1344.
All rig count data is provided by Baker Hughes. All monthly charts are oil rigs only. Gas rigs are not included in the count. The last data point for all monthly charts is April 2015.
When I talk about “peaks” in this post I am only speaking of the peak since 2011 and am not suggesting that there were not higher peaks in previous years.
The International Rig Count has fallen by 150 rigs, from 1,080 in July 2014 to 930 in April 2015. This count does not include the USA, Canada or any of the FSU countries.
The European Oil Rig Count dropped from 96 in October and November to 65 in April.
Waiting for Godot was a two act play by Samuel Beckett where two men kept waiting for Godot and they just kept waiting and waiting and waiting… And no, I don’t think we will be kept waiting and waiting like the characters in that play. Peak oil is about to arrive, in my opinion anyway.
Way back in 2005 we thought it likely that crude oil production had peaked at just under 74 million barrels per day. During the preceding three years C+C production had risen by 6,481,000 barrels per day or 2,160,333 barrels per day per year. The reason for that dramatic increase was a doubling in the price of oil from $25 per barrel in 2002 to $54.43 in 2005.
So oil production depends, to a great extent, the price of oil. The more money the more oil. However… The C+C data in all charts below are in thousand barrels per day.
You can see that another doubling of Brent oil price in the next 8 years brought only 2,283,000 bp/d of new oil on line, or an average of 285,375 bp/d per year.
So where did the increase in C+C come from between 2002 and 2005, and where has it come from since.
You can see the major addition to World C+C between 2002 and 2005 was from Eurasia, (FSU) the Middle East and Africa. The only major decline was from Europe, primarily the North Sea. Since 2005 the major gainers were North America followed by the Middle East and Eurasia, which we used to refer to as FSU. But 8 years is a long time, what has happened during those 8 years.
Read More