Permian Basin, Bakken/Three Forks and Eagle Ford Net Volume

In the discussion here I use the term net volume to refer to the volume of prospective rock that might be developed to produce tight oil.  For each bench of a prospective tight oil play (Wolfcamp A would be one example of a bench) there is an area estimate (5733 thousand acres for Wolfcamp A of Delaware) and a success ratio (%) = 94.7, in the case of Wolfcamp A.  Net acres are the total acres times the success ratio, for Wolfcamp A, 5429 thousand net acres.  On average the Wolfcamp A of the Delaware basin is about 400 feet thick, so the net volume would be net acres times thickness or 2172 million acre-feet.  An acre-foot is a volume that is one acre (44,000 square feet) by one foot thick or 44,000 cubic feet (or a box that is 1000 ft long by 44 feet wide by 1 foot high.)

Read More

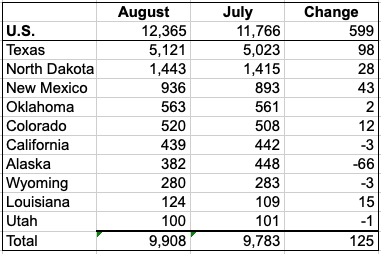
USA Oil Production by State Updated to August 2019

All data for this post is from the EIA’s Petroleum Supply Monthly

The charts below are primarily for the largest US oil producing states (>100 kb/d) and are updated to August 2019.  If you are interested in additional states, let it be known.

Ron has asked if I would take over the monthly posts for USA oil production.  I have tentatively agreed to do that.  Let us all thank Ron for his work at tracking US production and for his insights.  Ron will continue to monitor what’s happening with US production and provide his comments. He is not going away.

This is my first post on US production by state. If you spot any errors, please let me know and I will try to fix them.

Read More

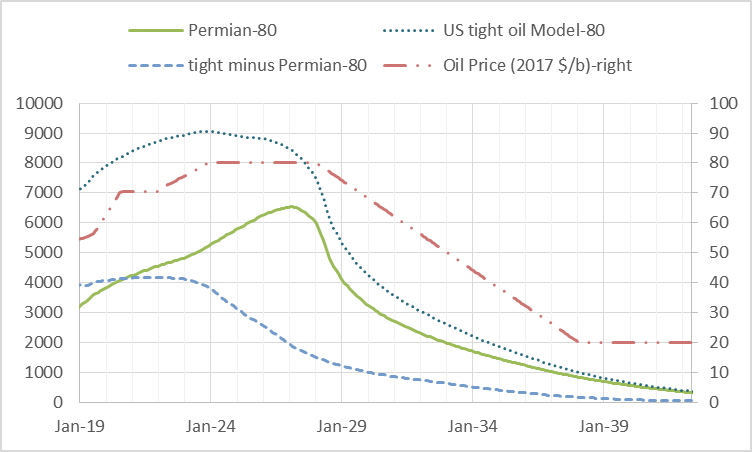
US Tight Oil Scenario based on BNP Paribas Study

An interesting analysis was recently published by BNP Paribas (one of the top 10 banks in the World by assets) entitled Wells, Wires, and Wheels… . In that analysis they argue that long term oil prices will fall to $20/b or less in order for oil used for personal land transport to compete with EVs powered by wind and solar at current cost levels.
I reworked my oil price assumptions, first with a simple scenario that follows the EIA’s AEO 2018 reference oil price scenario up to $70/b in 2017$ and then remains at that level long term. Second I noticed that a scenario with such an oil price assumption sees tight oil output fall in 2022 so the scenario was revised with oil prices rising from 70 to 80 per barrel from 2022 to 2024 and then remaining at that level until 2028. The BNP Paribus analysis suggests that EVs will have cut significantly into oil demand by 2022 to 2025 so I assume oil prices fall to $20/b over the next 10 years.
Scenarios below.

chart/ Read More

US Tight Oil Estimate and Projection to Dec 2019

New tight oil estimates were recently released by the EIA. The chart below compares estimates from Dec 2018 to May 2019, where the Dec 2018 estimate is that estimate with the most recent month estimated being Dec 2018 and likewise the May 2019 estimate has May 2019 as the most recent month estimated. The May 2019 estimate is fairly close to the April 2019 estimate with a slight downward revision of the April 2019 estimate from 7399 kb/d to 7368 kb/d, March 2019 was also revised lower by 10 kb/d from 7292 kb/d to 7282 kb/d. For May 2019 the most recent estimate is 7462 kb/d and if past history repeats this estimate may be revised lower next month.

chart/

Read More