August Non-OPEC Oil Production Increases

A guest post by Ovi

Below are a number of Crude plus Condensate (C + C) production charts, usually shortened to “oil”, for Non-OPEC countries. The charts are created from data provided by the EIA’s International Energy Statistics and are updated to August 2022. This is the latest and most detailed world oil production information available. Information from other sources such as OPEC, the STEO and country specific sites such as Russia, Brazil, Norway and China is used to provide a short term outlook for future output and direction for a few countries and the world. The US report has an expanded view beyond production by adding rig and frac charts.
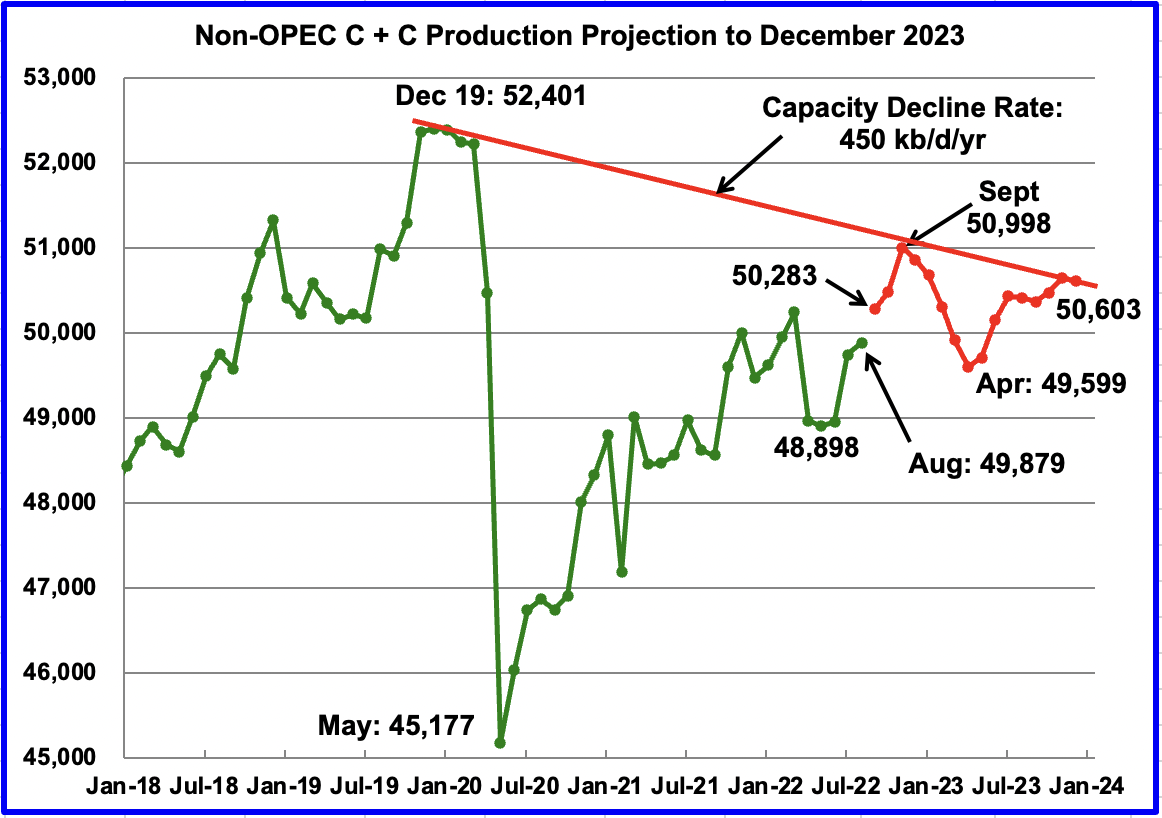
August Non-OPEC oil production increased by 138 kb/d to 49,879 kb/d. The largest increases came from Norway 147 kb/d and Brazil 124 kb/d. The largest offsetting decrease came from Kazakhstan 179 kb/d. 

Read More
The EIA’s International Energy Statistics 2

The EIA, a few days ago posted their International Energy Statistics. They publish lots of statistics here but on monthly basis I only follow their  production of world Crude Oil including Lease Condensate.

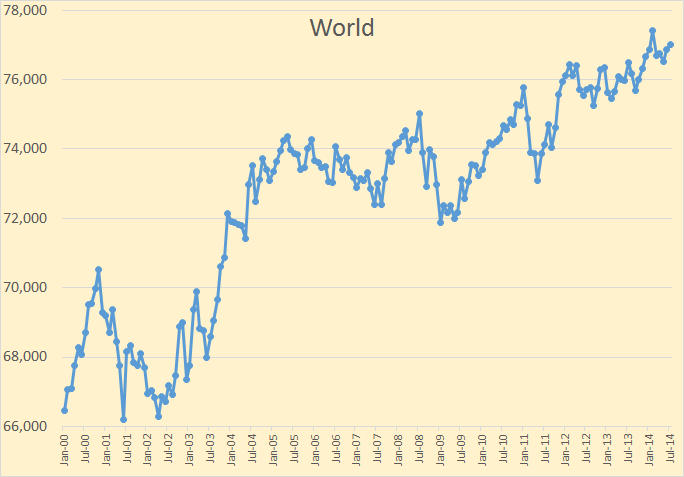
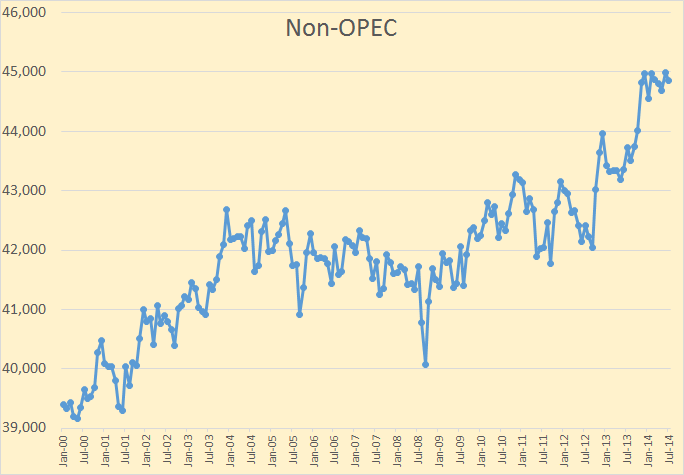
The data on all charts below is Crude + Condensate production through July 2014 and is in thousand barrels per day.

World

World C+C production was up 168,000 bpd to 77,023,000 bpd. The high, so far, was in February at 77,409,000 bpd.

Non-OPEC

Non-OPEC C+C was down 135,000 bpd from it high so far. It has been on a 9 month plateau high.

Read More

The EIA’s International Energy Statistics

The EIA, a few days ago posted their International Energy Statistics. They publish lots of statistics here but on monthly basis I only follow their  production of world Crude Oil including Lease Condensate.

The data on all charts below is Crude + Condensate production through July 2014 and is in thousand barrels per day.

World

World C+C production was up 168,000 bpd to 77,023,000 bpd. The high, so far, was in February at 77,409,000 bpd.

Non-OPEC

Non-OPEC C+C was down 135,000 bpd from it high so far. It has been on a 9 month plateau high.

Read More

Problems and Politics Keeping Crude Oil Production Well Below Expectations

OPEC December Crude Output Falls to 2-Year Low: Survey

Venezuelan Policies

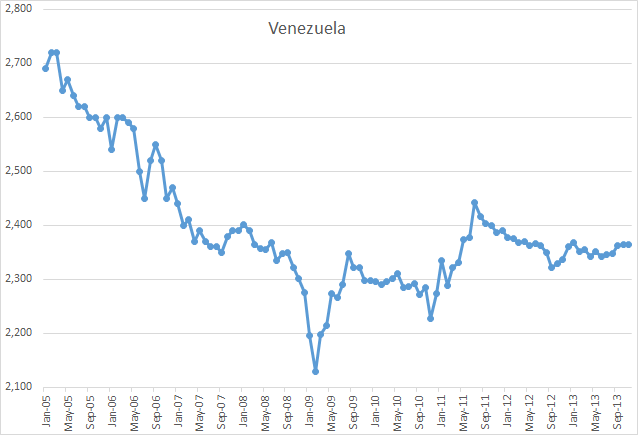
Venezuelan production dropped 235,000 barrels a day to 2.45 million this month, the survey showed. The South American country pumped the least crude since October 2011. Resources have been diverted from energy sector into social welfare programs, sending production lower.

Petroleos de Venezuela SA, the state oil company, was purged after a two-month oil strike intended to oust President Hugo Chavez from power in 2003. Nicolas Maduro, who became president in March when Chavez died, has continued his predecessor’s policies.

“It’s hard to see how the situation in Venezuela gets any better,” said Bill O’Grady, chief market strategist at Confluence Investment Management in St. Louis, which oversees $1.4 billion. “Funds have been used to prop up the government instead of maintaining the oil industry since the PDVSA strike in 2003. It’s clear the country is on an unsustainable path.”

Venezuela

Data for the above graph is from the latest OPEC MOMR published last month and includes data through November 2012. It has Venezuela crude only production at 2,364,000 bp/d in November so it differs considerably from the Bloomberg report above. That report may be using production reported by Venezuela themselves which they reported as 2,854,000 bp/d for November or 490,000 kb/d above what the OPEC MOMR’s “secondary sources” said they produced.

Read More