David Archibald has recently revised his peak date for shale oil. The below was contained in a recent post I received from him:
Ron,
For what it is worth, just to let you know that I have recanted on my estimate of US LTO production.
This is from reading the presentations put out in September by the US independents. I started with the EOG presentation and then worked through the others that EOG referred to. If Hubbert-type analysis works for LTO, it may be too early to apply it.
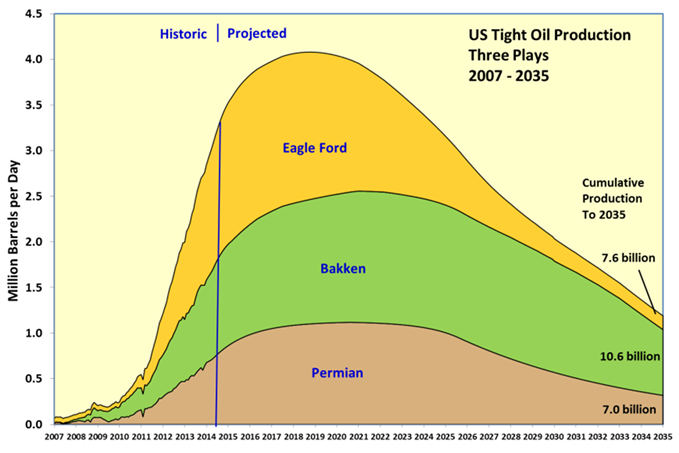
The rig count for the Bakken etc may be down to flat but the fraccing units are pumping a lot more sand and the economics of fraccing have improved a lot over the last two years. That in turn means that the resource is larger at a given IRR cutoff. This is currently my best guess of the three major plays:
Others are appearing such as SCOOP in Oklahoma.
I tried to make the graph useful by putting in the cumulative production to 2035 so that people can mentally adjust it for what they think EUR might be. The Permian has a lot of NGLs and natural gas which means that the energy produced is about twice as large as the oil component. The reason I didn’t make the Permian as peaky as the Eagle Ford for example is that there at lot of stacked plays in the Permian. Once companies have got acreage and got one horizon working, they don’t have to be in a rush to develop the others.
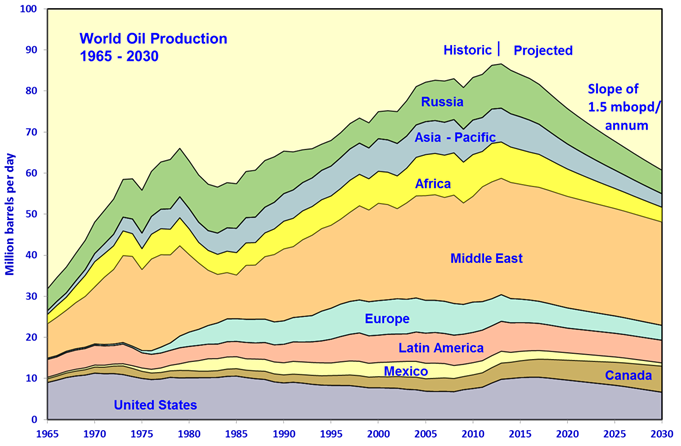
The US LTO boom is worth about two to three years of conventional oil decline:
With further demand destruction, the US will become energy independent.
Read More
