The USA data below was taken primarily from the EIA’s Petroleum Supply Monthly while some were taken from the EIA’s Monthly Energy Review.
I have some bad news to report. The EIA no longer published World production data or Non-OPEC production data. This data had previously been published in the Monthly Energy Review.
The Monthly Energy Review’s data was one month behind the Petroleum Supply Monthly but now they jumped two months and are now one month ahead of the Petroleum Supply Monthly. They now publish the previous month’s numbers, June in this case, but now publish only US data. The Petroleum Supply Monthly is unchanged.
EDIT: The Petroleum Supply Monthly does publish some, incomplete, world data… through April or one month behind their USA data. I will use that with an explanation and comments next month.
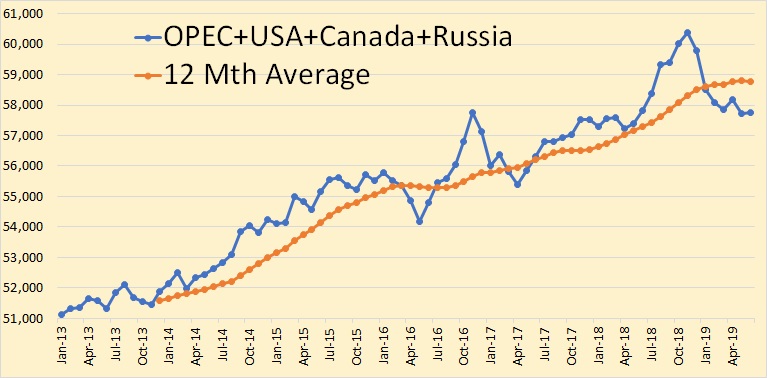
The closest I can come to World oil production, through June, is the combined production of OPEC, Russia, the USA, and Canada. This is 70% of total World Production.