The EIA just released their Petroleum Supply Monthly where they give their estimates of US crude production as well as the crude production for all states and territories through August 2014.
There was not much movement from anyone in August. Here are the biggest movers:
Change
Total USA 61 kbd
Texas 46 kbd
GOM 21 kbd
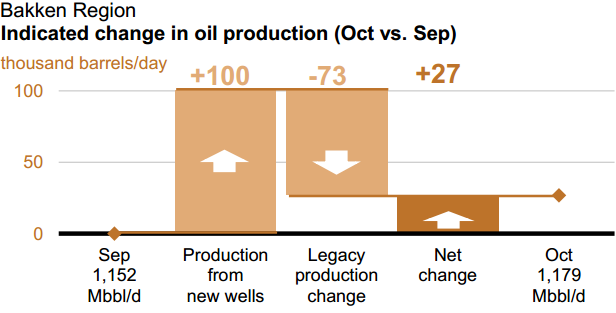
North Dakota 18 kbd
Oklahoma -6 kbd
Colorado -9 kbd
Alaska -24 kbd
The data is in kbd with the last data point August 2014.
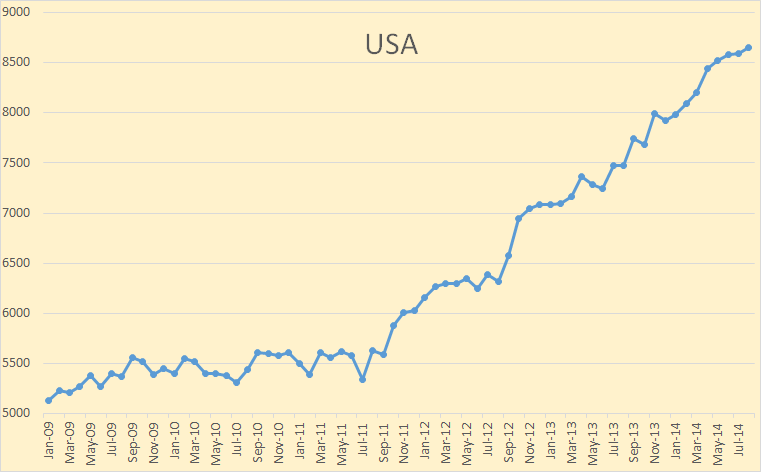
I have started the data in January 2009 in order to get a better picture of what is really happening.
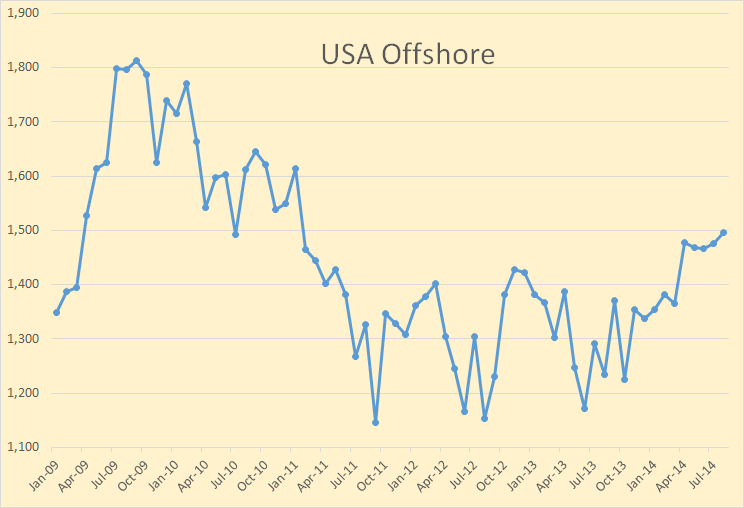
The above chart is the combined production of both GOM and Pacific offshore.
The EIA is predicting Offshore production to reach 2 million barrels per day by 2016, I really don’t think it is going to make it. They are counting on a lot of new offshore fields that are coming on line to bring it up to that level. While that is happening, what they have underestimated is the very high decline rate of these deep water fields.
Read More