OPEC’s 2015 World Oil Outlook

The OPEC 2015 World Oil Outlook came out a few days ago. They basically produce two outlooks, a medium term outlook to 2020 and a long term outlook to 2040. I found their medium term outlook pessimistic in some cases to optimistic in others. But I found their long term outlook to be wildly optimistic… in most cases.

In all cases below I chart crude when it is available and “liquids” only when no other option is available. The data is in million barrels per day.

OPEC Med. Term Outlook

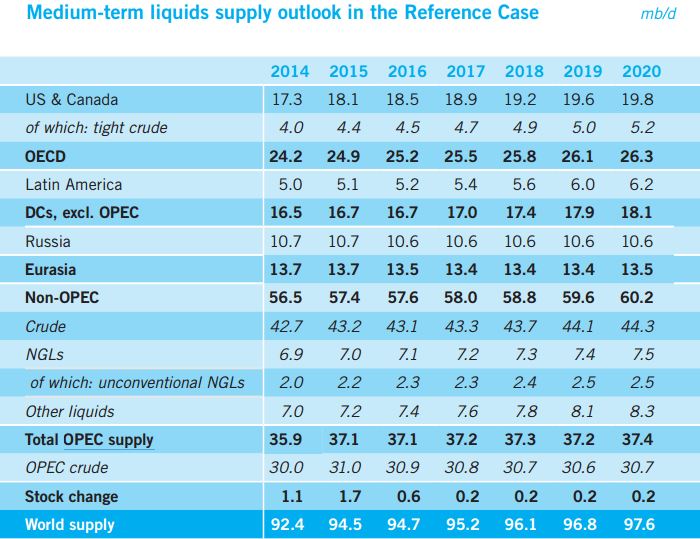
Here is their medium term outlook chart. Notice they expect both OPEC and Non-OPEC crude to decline in 2016 but Non-OPEC crude starts a slow recovery in 2017. They say OPEC crude will not start their recovery until 2019.
Read More

A Surprising Look at Oil Consumption

The EIA publishes oil consumption numbers for all major nations. However they have data for most nations only through 2013. They do have data for some nations through 2014. Nevertheless a lot can be gleaned from just looking at those consumption numbers. If oil consumption numbers are growing year after year, then there is a good chance that nation is growing economically. But if oil consumption numbers are continually declining year after year, then it is more than a little silly to say all is well, economically, with that nation. Or that is my opinion anyway.

First, who’s oil consumption is increasing year after year, or who’s economy is booming? All charts below are consumption as total liquids in thousand barrels per day. Some charts are through 2014 while others are through 2013. Whatever the last year is on the yearly axis is the last year for that data.

Important: All charts are consumption, not production. 

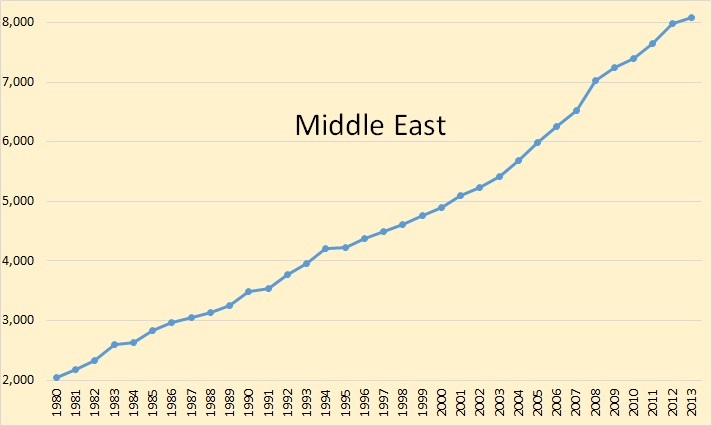
C. Middle East

No doubt the Middle East is booming. The reason, most of them are oil producers and oil, for most of this chart anyway, the price of oil was increasing. They had lots of income, their consumption was increasing every year as was their economies.

Read More

Bakken by County and Legacy Decline

North Dakota publishes Historical Oil Production by County. However confidential wells are not included in these totals. But they also publish a State Summary Report which does include confidential well data for the previous two months. Working with both we can get a pretty good estimate of production from each county.

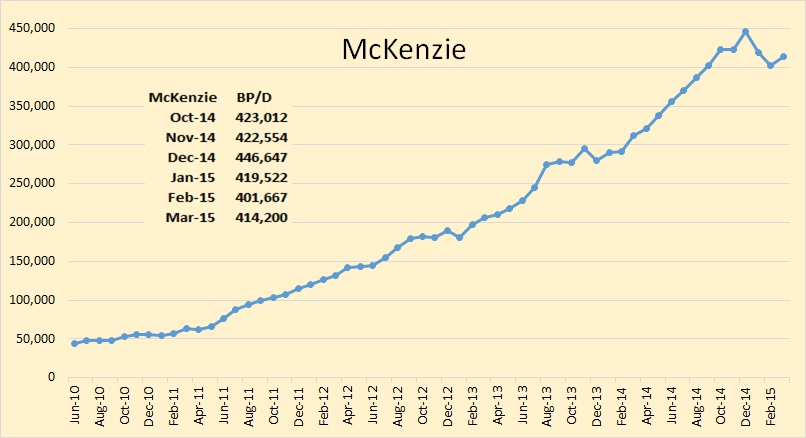
McKenzie

McKenzie had  a 12,533 bp/d gain in March but they are still 32,447 below their December high.

Read More