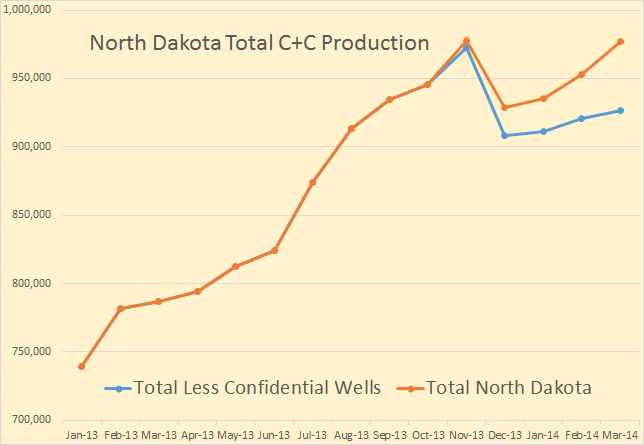
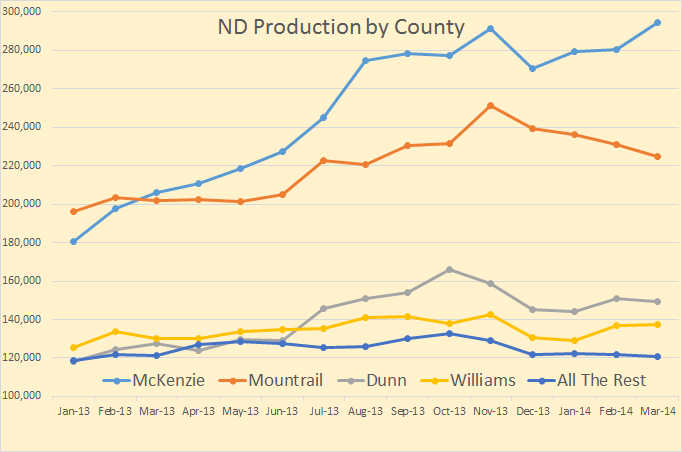
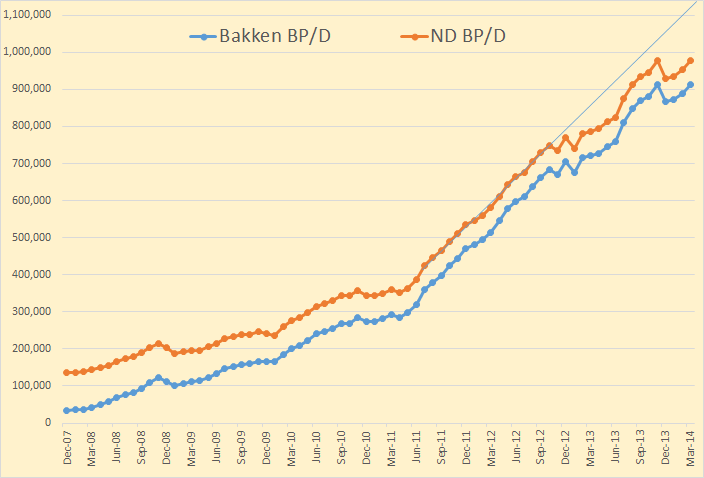
North Dakota publishes crude oil production numbers for each county. The problem is these numbers do not include confidential wells. Their totals for all North Dakota do include these wells however. I have figured out a way to estimate, pretty closely I believe, each county’s share of those unreported wells. That is take each county’s percentage of total production, then assume they would have the same percentage of confidential wells. It is not exact but close enough.
The data is published only as a PDF file and cannot be copied and pasted. Therefore I must input the data for each of 18 counties, each month, manually. That is very time consuming and I only had the patience to do 15 months. But that is plenty for what I am trying to show.
All the rest of North Dakota combined produces less than the lowest of the big four.
Read More
