More on Bakken Production, Choke Theory

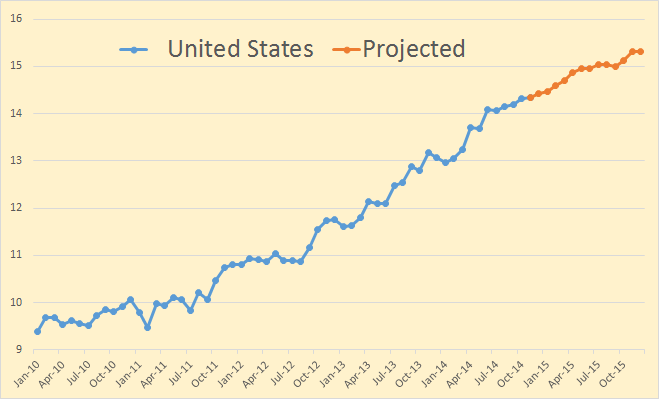
The US Petroleum Supply Monthly just came out with production data for every state and territory. US supply was up 168,000 bpd to 8,864,000 bpd in September. The biggest gainers were North Dakota, up 53,000 bpd to 1,185,000 bpd and Alaska up 79,000 to 477,000 bpd. Alaska  was way down in both July and August and are just recovering from that.  There was only one big loser, New Mexico, down 18,000 bpd. Texas was up only 9,000 barrels per day which was surprising. The Gulf of Mexico was down 3,000 bpd.

The Choke theory and why I ain’t buying it.

North Dakota publishes a Daily Activity Report Index of all permits and other well activity in the Bakken as well as the rest of North Dakota. In this report is a list of all producing wells completed as well as wells released from confidential (tight hole) status. Wells usually stay on this list from a few days to a few months, but the average is only a few weeks.

I have collected this data from October 2013 to present and found some startling results. But some have said this data means nothing, that wells are usually choked off by the driller so therefore we can gain nothing from the data. But looking at the individual wells that just doesn’t make any sense. No, I agree that the driller chokes but that he would not gradually choke more according to increasing well number.

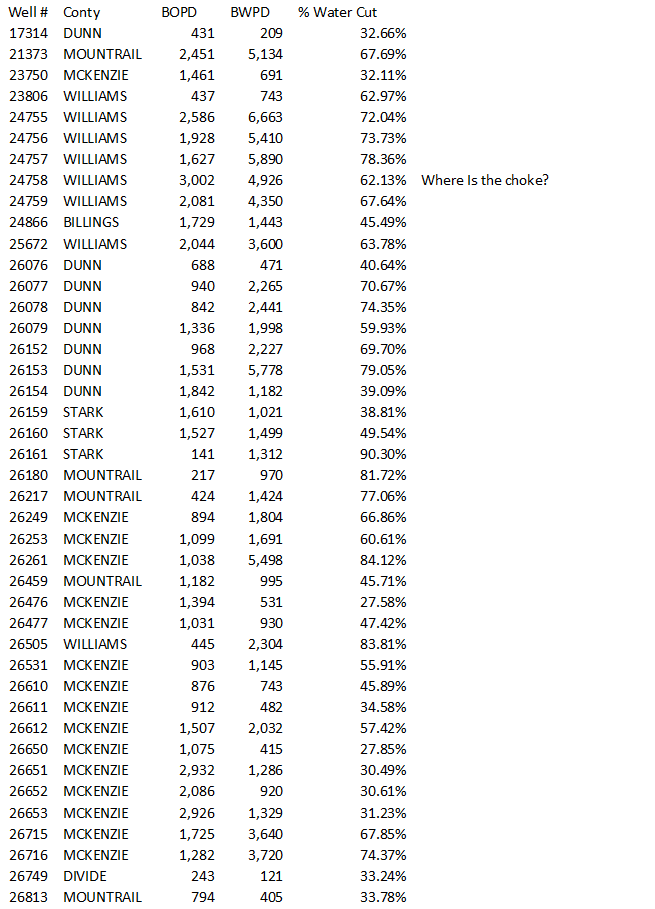
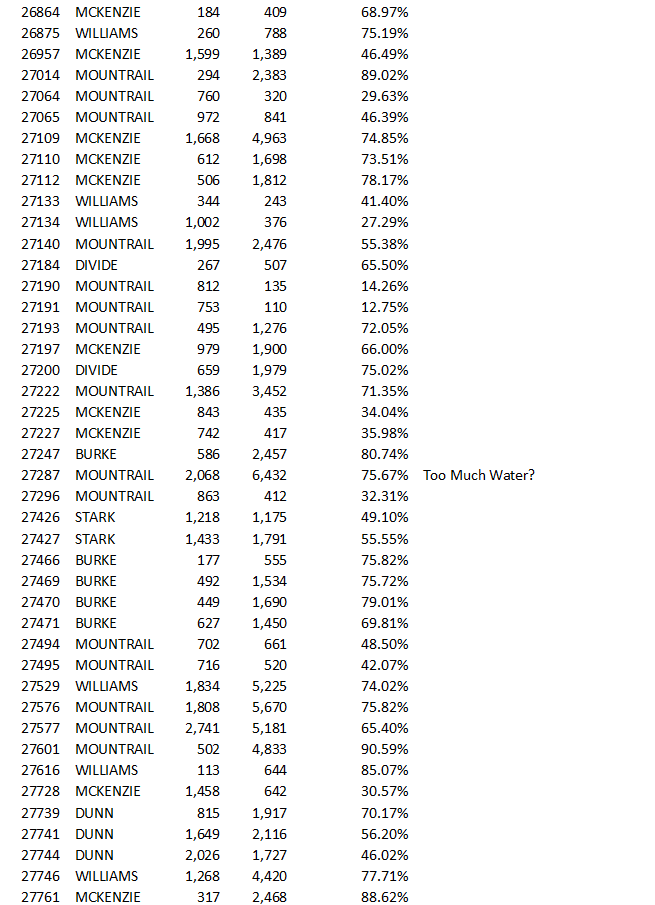
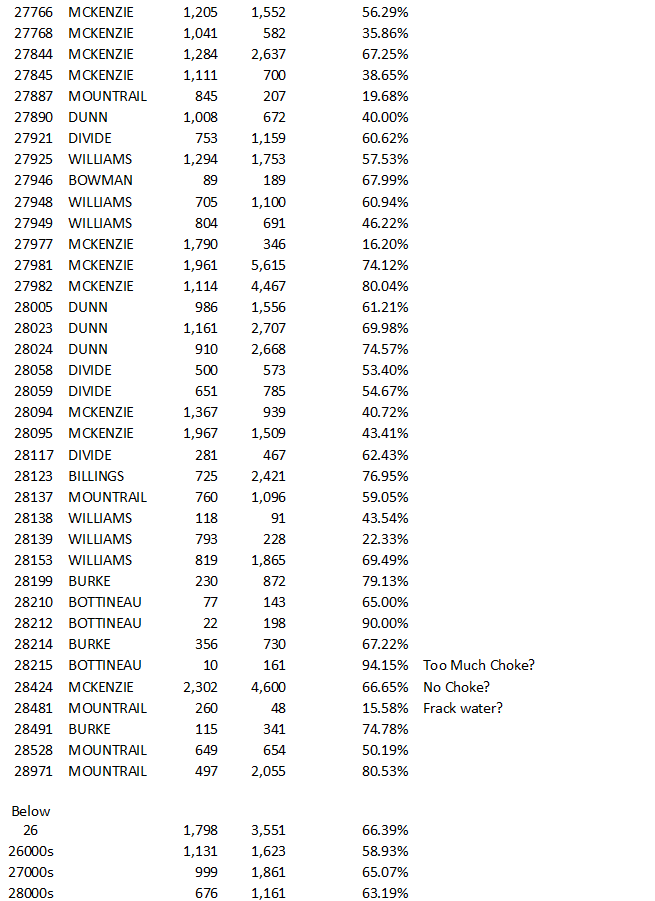
Below I have posted the first 24 hour data for all 122 wells reported by North Dakota for the first 25 days of November. The first 24 hour production ranges from over 3000 barrels of oil per day to a low of only 10 barrels of oil per day. Barrels of water range from a high of 6663  bwpd to a low of 48 bwpd. And the percent water cut ranges form a high of 94.15% water to a low of 12.75% water.

It just seems incredible to me to claim that these numbers are meaningless. Throughout all the almost 14 months of data I have gathered there are lots of very large producing wells and a lot of small producing wells. The point is as the well number increases the number of very large producing wells seems to decrease while the number of small producing wells seems to increase. And I just don’t believe this is due to the many drillers, after checking their well number, decides what size choke to apply.

Bakken NovemberBakken November 2Bakken November 3

Just below the list of all wells I have averaged the production according to well number. The sample however is not large enough to really mean a lot. The number of wells in the sample are: Below 26000, 11 wells  – 26000s 35 wellw – 27000s 54 wells – 28000s 23 wells.
Read More

Bakken Sweet Spots are Petering Out

The Bakken, as well as other shale oil areas, is not one homogeneous area where equal amounts of can be found. David Hughes in DRILLING DEEPER puts it this way, though here he is talking about gas wells, the same applies to oil wells:

All shale gas plays invariably have “core” areas or “sweet spots”, where individual well production is highest and hence the economics are best. Sweet spots are targeted and drilled off early in a play’s lifecycle, leaving lesser quality rock to be drilled as the play matures (requiring higher gas prices to be economic); thus the number of wells required to offset field decline inevitably increases with time.

However the Bakken, at least through the September North Dakota Industrial Commission  production report, has given no real indication that the Bakken is even close to peaking. But a closer look at the data makes me believe that is all about to change.

The NDIC issues a Daily Activity Report where they list permits issued as well as wells completed and wells released from the tight hole confidential list. These reports usually, but not always, also give the number of barrels of oil per day and barrels of water per day for the first 24 hours of production.  I have gone through every day, back to November 1st, 2013 and collected the data on every well listed that gives production numbers and copied that data to Excel. In that one year and three weeks I have gathered the data form every one of the 2,171 wells that give production numbers. Sorting these wells by well number, which is the original permit number, gives some startling results.

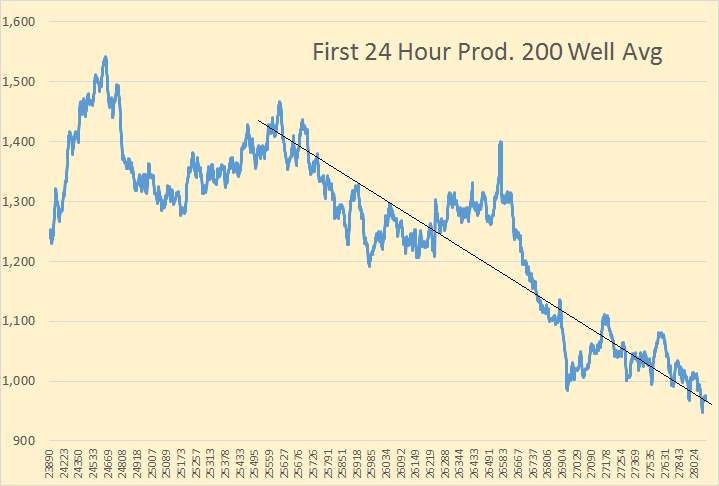
ND 200 Well Avg

To smooth the chart I created a 200 well average of barrels per day per well. The first point on the chart is therefore the average to the 200th well, #23890 and the last point is the 200 well average to the 2171st well, #28971. As you can see there has been a continuous, though erratic, decline in first 24 hour production as the well numbers increase.

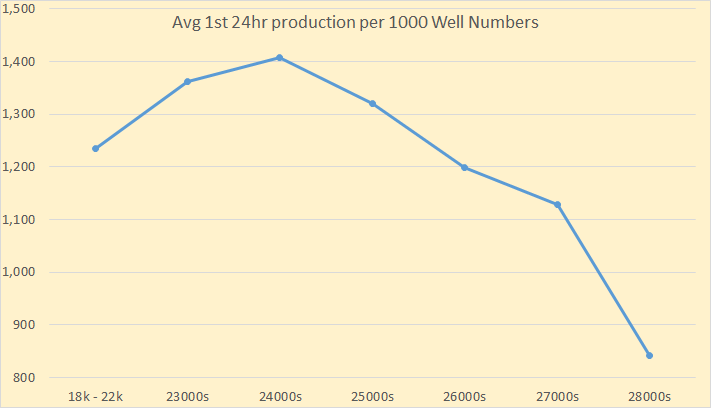
ND Prod per 1000

Breaking this down according to well numbers we see production peaked with the 2400s and have steady decline since. Every group of well numbers do not contain the same number of wells.
Read More

Bakken September Production Data

North Dakota just released the Bakken September Production Data as well as the September Production data for all North Dakota.

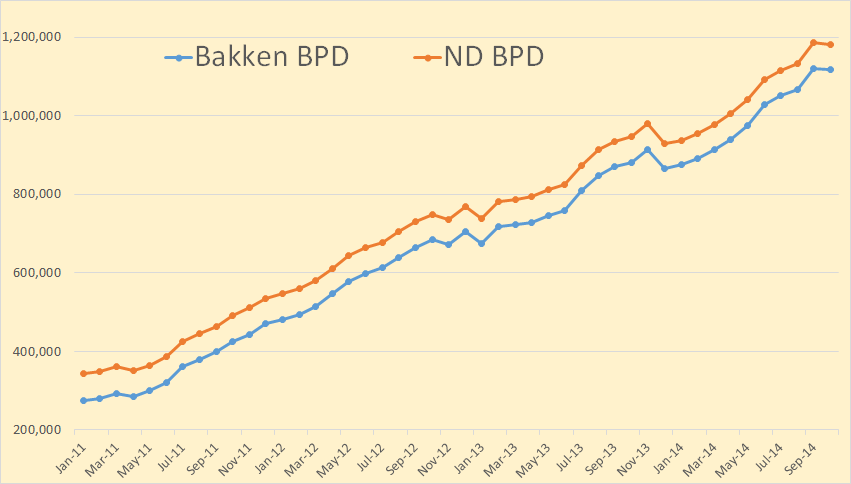
There was a suprisingly hefty increase in Bakken production in September, up 52,568 bpd to 1,120,031 bpd.

Bakken Barrels Per Day

North Dakota production was up slightly less, 52,394 bpd to 1,184,693 bpd. This means production outside the Bakken was down slightly.

Bakken Barrels Per Day Increase

These big increases happen ever so often and are usually followed by a not so large increase for a few months. I think there is some kind of reporting anomaly here. But as you can see the 12 month average increase gives a better indication of what is really going on.
Read More

Debt, Oil Price and the Bakken “Red Queen”

This is a guest post by Rune Likvern. His web site is:

FRACTIONAL FLOW

Growth in Global Total Debt sustained a High Oil Price and delayed the Bakken “Red Queen”

The saying is that hindsight (always) provides 20/20 vision.

In this post I present a retrospective look at my prediction from 2012 published on The Oil Drum (The “Red Queen” series) where I predicted that Light Tight Oil (LTO) extraction from Bakken in North Dakota would not move much above 0.7 Mb/d.

  • Profitable drilling in Bakken for LTO extraction has been, is and will continue to be dependent on an oil price above a certain threshold, now about $68/Bbl at the wellhead (or around $80/Bbl [WTI]) on a point forward basis.
    (The profitability threshold depends on the individual well’s productivity and companies’ return requirements.)
  • Complete analysis of developments to LTO extraction should encompass the resilience of the oil companies’ balance sheets and their return requirements.

Rune 1

Figure 01: The chart above shows development in Light Tight Oil (LTO) extraction from January 2009 and as of August 2014 in Bakken North Dakota [green area, right hand scale]. The top black line is the price of Western Texas Intermediate (WTI), red middle line the Bakken LTO price (sweet) as published by the Director for NDIC and bottom orange line the spread between WTI and Bakken LTO wellhead all left hand scale. The spread between WTI and Bakken wellhead has widened in the recent months.

What makes extraction from source rock in Bakken attractive (as in profitable) is/was the high oil price and cheap debt (low interest rates). The Bakken formation has been known for decades and fracking is not a new technology, though it has seen and is likely to see lots of improvements.

LTO extraction in Bakken (and in other plays like Eagle Ford) happened due to a higher oil price as it involves the deployment of expensive technologies which again is at the mercy of:

  • Consumers affordability, that is their ability to continue to pay for more expensive oil
  • Changes in global total debt levels (credit expansion), like the recent years rapid credit expansion in emerging economies, primarily China.
  • Central banks’ policies, like the recent years’ expansions of their balance sheets and low interest rate policies
    • Credit/debt is a vehicle for consumers to pay (create demand) for a product/service
    • Credit/debt is also used by companies to generate supplies to meet changes to demand
    • What companies in reality do is to use expectations of future cash flows (from consumers’ abilities to take on more debt) as collateral to themselves go deeper into debt.
    • Credit/debt, thus works both sides of the supply/demand equation
  • How OPEC shapes their policies as responses to declines in the oil price
    Will OPEC establish and defend a price floor for the oil price?

I have recently and repeatedly pointed out;

  • Any forecasts of oil (and gas) demand/supplies and oil price trajectories are NOT very helpful if they do not incorporate forecasts for changes to total global credit/debt, interest rates and developments to consumers’/societies’ affordability.

Oil is a global commodity which price is determined in the global marketplace.

Added liquidity and low interest rates provided by the world’s dominant central bank, the Fed, has also played some role in the developments in LTO extraction from the Bakken formation in North America.

As numerous people repeatedly have said; “Never bet against the Fed!” to which I will add “…and China’s determination to expand credit”.

Let me be clear, I do not believe that the Fed’s policies have been aimed at supporting developments in Bakken (or other petroleum developments) this is in my opinion unintended consequences.

In Bakken two factors helped grow and sustain a high number of well additions (well manufacturing);

  • A high(er) oil price
  • Growing use of cheap external funding (primarily debt)

In the summer of 2012 I found it hard to comprehend what would sustain the oil price above $80/Bbl (WTI).

The mechanisms that supported the high oil price was well understood, what lacked was documentation from authoritative sources about the scale of the continued accommodative policies from major central banks’ (balance sheet expansions [QE] and low interest rate policies) and as important; global total credit expansion, which in recent years was driven by China and other emerging economies.

I have described more about this in my post World Crude Oil Production and the Oil Price.

Rune 2

Figure 02: The chart above with the stacked areas shows developments in all oil extraction in North Dakota as of January 2007 and of August 2014 split on the 4 counties with the highest extraction and the rest of North Dakota. Growth in oil extraction in North Dakota is now primarily from McKenzie and Mountrail counties.

Read More

Petroleum Supply Monthly & Other News

The EIA just released their Petroleum Supply Monthly where they give their estimates of US crude production as well as the crude production for all states and territories through August 2014.

There was not much movement from anyone in August. Here are the biggest movers:

                            Change
Total USA          61 kbd
Texas                  46 kbd
GOM                   21 kbd
North Dakota   18 kbd
Oklahoma         -6 kbd
Colorado            -9 kbd
Alaska              -24 kbd

The data is in kbd with the last data point August 2014.

USA

I have started the data in January 2009 in order to get a better picture of what is really happening.

USA Offshore

 The above chart is the combined production of both GOM and Pacific offshore.

 The EIA is predicting Offshore production to reach 2 million barrels per day by 2016, I really don’t think it is going to make it. They are counting on a lot of new offshore fields that are coming on line to bring it up to that level. While that is happening, what they have underestimated is the very high decline rate of these deep water fields.
Read More