The EIA STEO was published recently, the estimate below is based on data from that report and statistics from the EIA International Energy Statistics. The EIA expects the 2018 peak for annual average World C+C output will be surpassed in 2025. The monthly peak in November 2018 is also expected to be surpassed in November 2025.
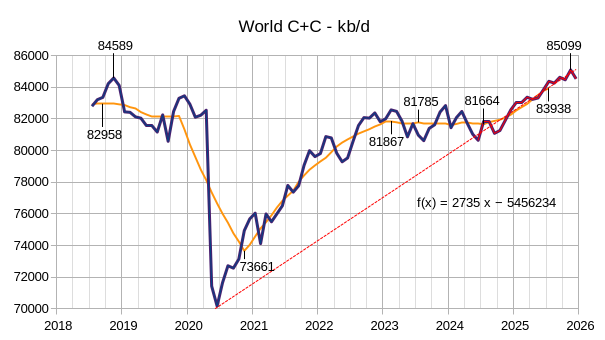
In the chart above World C+C is estimated from the STEO crude oil projection for the World minus US, the ratio of crude to C+C for the World minus US is averaged over the most recent 12 months (June 2023 to May 2024) and is assumed to remain at this level over the June 2024 to December 2025 period. This is a conservative estimate because this ratio has been increasing over time. The orange line is the centered 12 month average, the purple line is data from the EIA’s International statistics and the red line is the forecast (which starts in June 2024).
The previous monthly peak was 84589 kb/d in November 2018 and this is surpassed in November 2025 when World C+C reaches 85099 kb/d. The centered 12 month average(CTMA) peak was 82958 kb/d in August 2018, the post pandemic CTMA peak was 81867 kb/d in Feb 2023. For 2023 the CTMA was 81785 kb/d and is expected to fall to 81664 kb/d in 2024 and then jump to 83938 kb/d in 2025, about 980 kb/d above the previous CTMA peak. Note how rapidly C+C output is expected to rise from June 2024 to December 2025, with the annual rate of increase over 2700 kb/d over that 19 month period. The forecast seems optimistic given the projected oil prices by the EIA and rather subdued World demand for C+C.
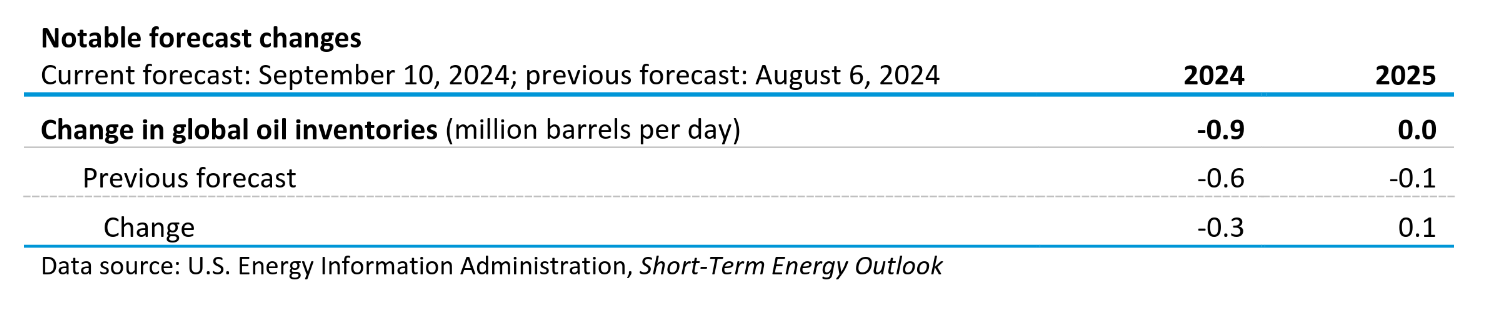
The EIA expects a larger draw on global oil inventories compared to last month in 2024, but has revised the 2025 oil stocks to unchanged from a 100 kb/d draw expected in last month’s report. It is odd that it expects lower prices in 2024 than forecast last month when it has increased the stock draw by 50% compared to the previous month. The Oil Price forecast has been revised lower by $2/b in 2025 while the stock level is expected to be higher than previously forecast. It is unclear how a an oil price level of only $84/b in 2025 ($2/b less than last month’s estimate) is likely to incentivize higher C+C output of over 2700 kb/d. An increase of 750 kb/d seems more reasonable in 2025, and perhaps as little as 500 kb/d for the C+C CTMA increase from 2024 to 2025.
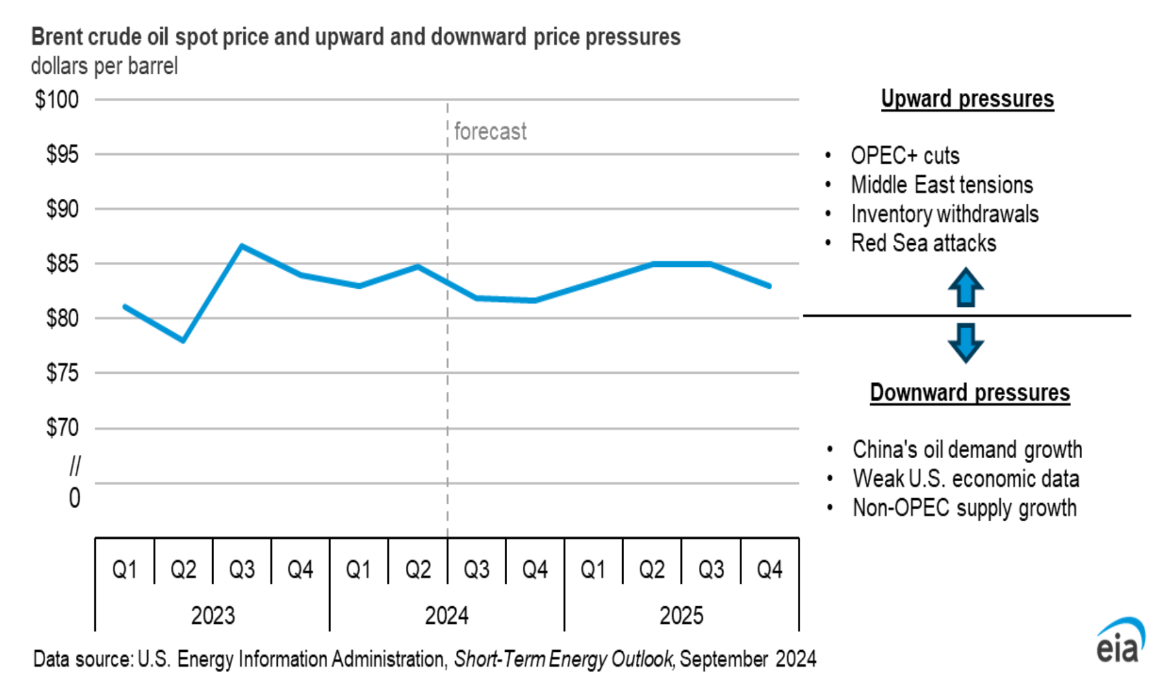
The EIA is expecting growth from US, Argentina, Brazil, Canada, Guyana, and Norway over the forecast period along with OPEC unwinding its cuts after December 2024. I think if the EIA oil price forecast is correct that OPEC increases might not be forthcoming. Note that the average Brent Spot price in August was $80.36/b and for the most recent 30 days the average price was around $75/b with current Brent futures price at $71/b as I write this, if oil prices remain low there is little incentive to increase the supply of oil.
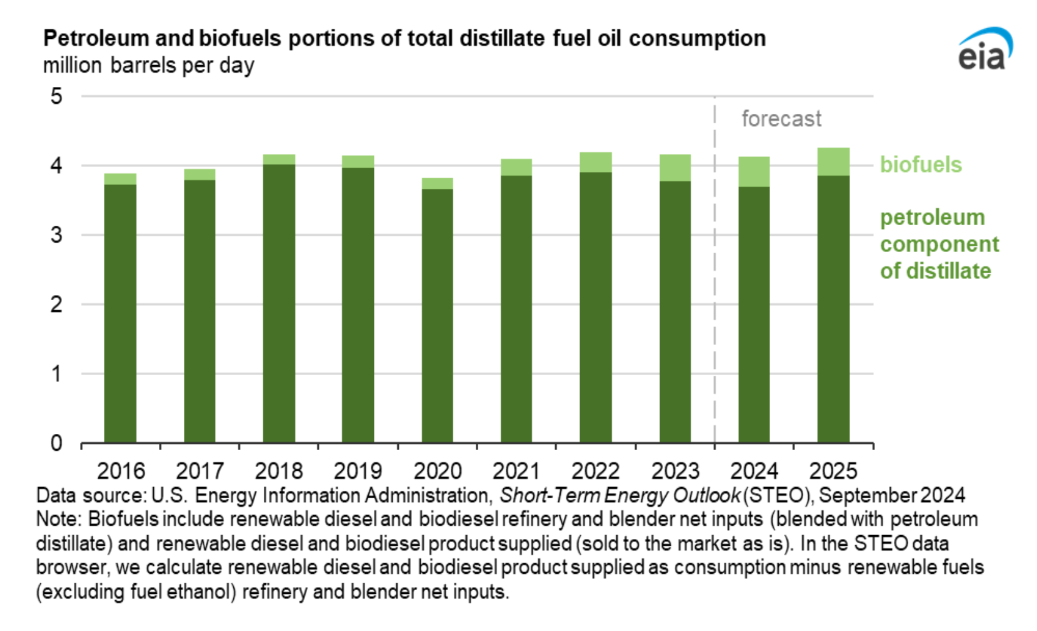
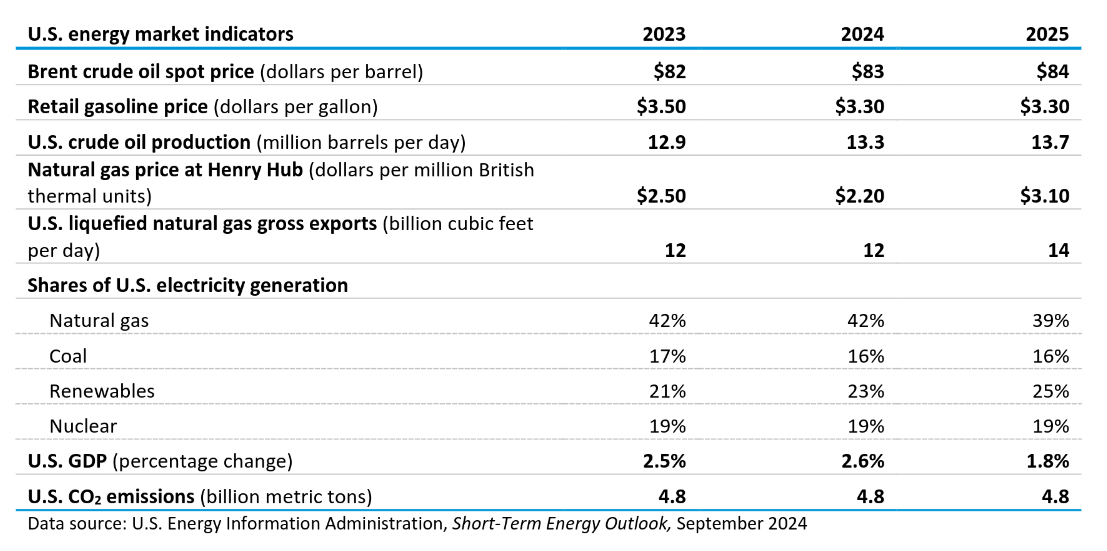
There has been an increasing proportion of renewable diesel and biodiesel in the US distillate mix over the past 7 years and this trend is expected to continue in 2024 and 2025. About 7.5% of distillate consumed in 2023 was non-petroleum and the proportion is expected to increase to 8.8% in 2024.
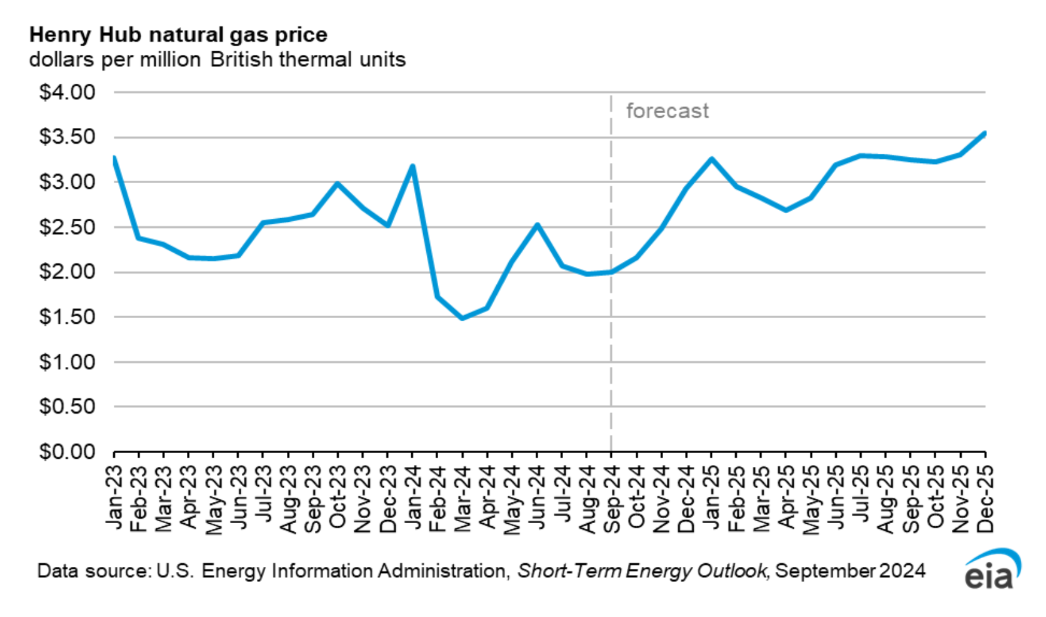
Natural gas prices are expected to increase in 2025 and in 2024Q4 which might help profits in the tight oil sector, though oil prices will also need to recover to $75/b for WTI Oil price in order to see higher rates of well completion in tight oil basins.
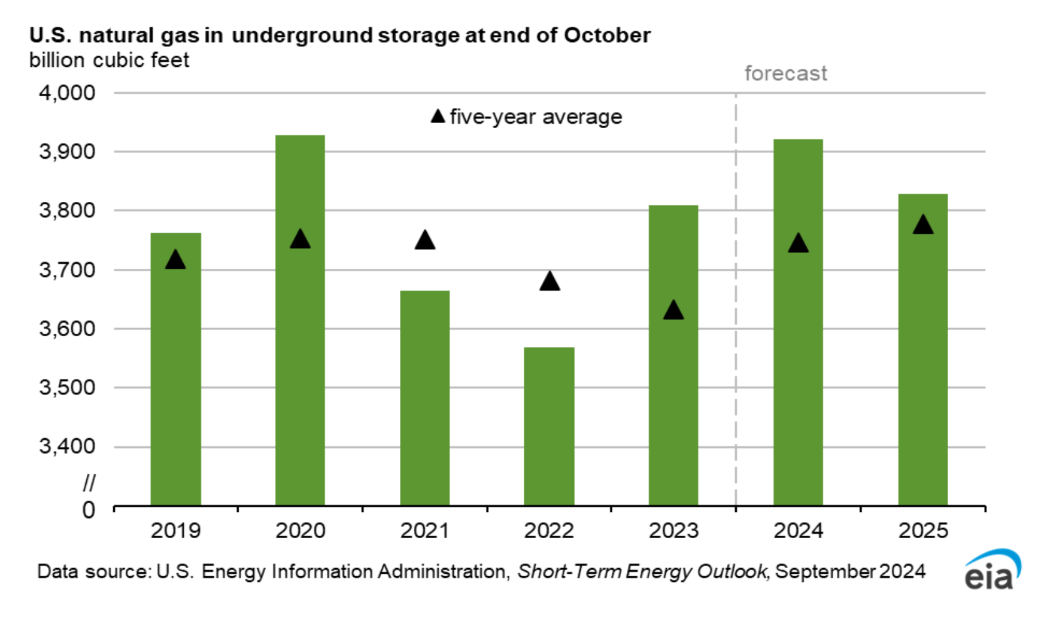
The high level of natural gas storage relative to the 5 year average is what has been driving natural gas prices lower, in 2025 natural gas in storage at the end of October is expected to be closer to the 5 year average which may increase prices. More LNG export facilities are expected to come online over the next 15 months which will help to reduce the glut of natural gas in the US.
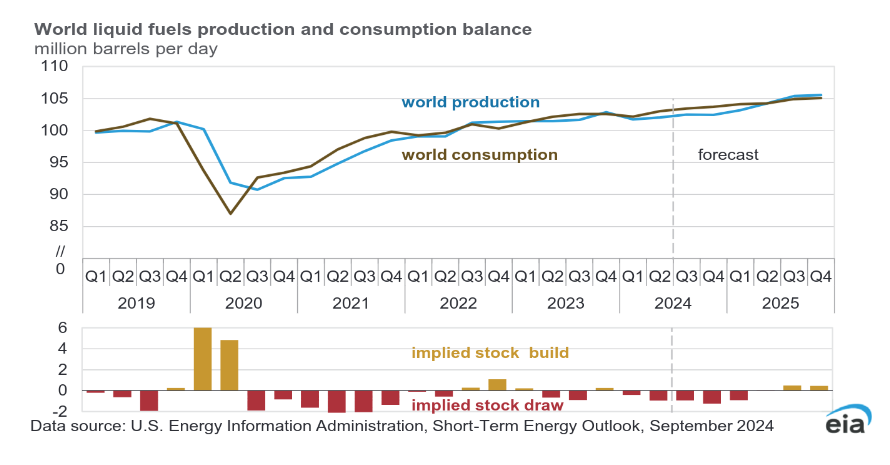
Based on the EIA production and consumption data World petroleum stocks have been decreasing since the end of 2023, Brent oil prices have averaged $82.74 through Sept 23, 2024 for this year and Brent prices have been trending lower since April 2024, it seems likely that the EIA consumption estimates are too high or the production estimates are too low (or some of both), because prices do not reflect the stock draw that the EIA data shows.
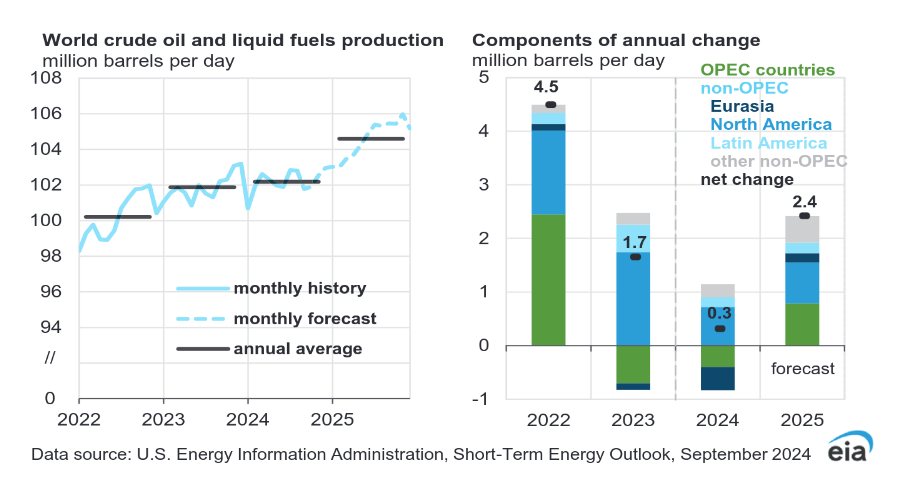
The 2024 forecast in the chart above seems reasonable, the 2025 forecast seems 3 to 4 times too high. I doubt we see any increase from OPEC or Eurasia in 2025, very little increase from the US and possibly 500 to 800 kb/d from the Big 5 non OPEC+ nations (Argentina, Brazil, Canada, Guyana, and Norway).
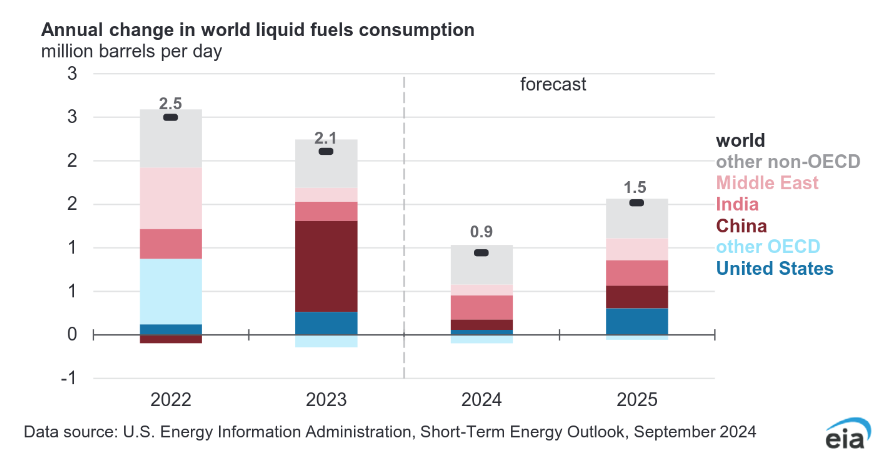
For the chart above for World consumption 2024 looks reasonable, but I expect OECD (including the US) to be flat and China and Middle East to be similar to the 2024 level. The IEA has a better estimate for the increase in 2025 of about 1 Mb/d, the EIA estimate is likely 500 kb/d too high for 2025.
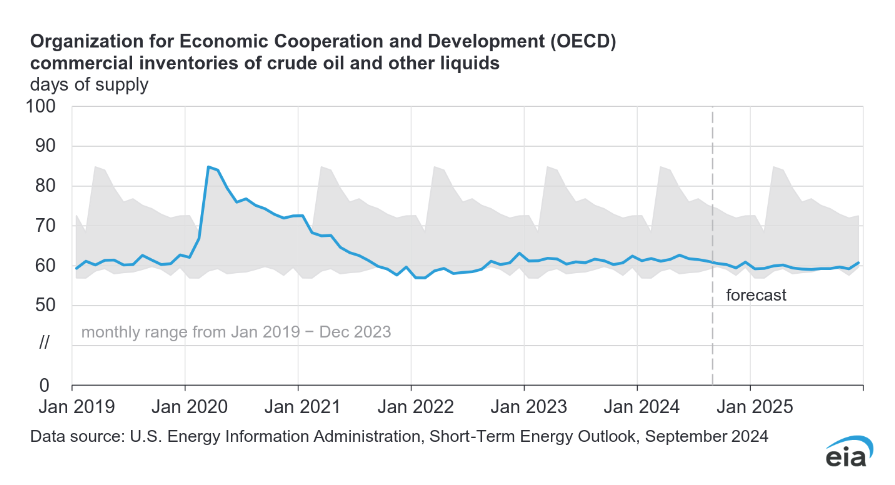
OECD stocks are forecast to remain close to the bottom of the 5 year range from 2019 to 2023.
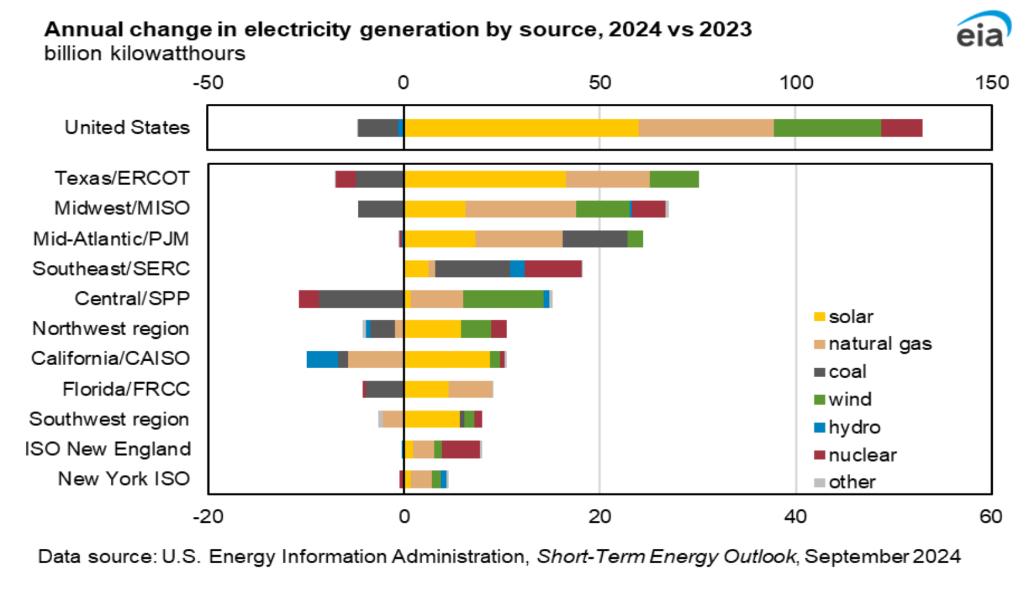
A large proportion of increased electicity generation in the US came from solar, wind and nuclear power. Natural gas generation also saw a significant increase (about 30 of 130 TWh) while coal generation decreased by about 10 Twh (eyeball estimates from chart).
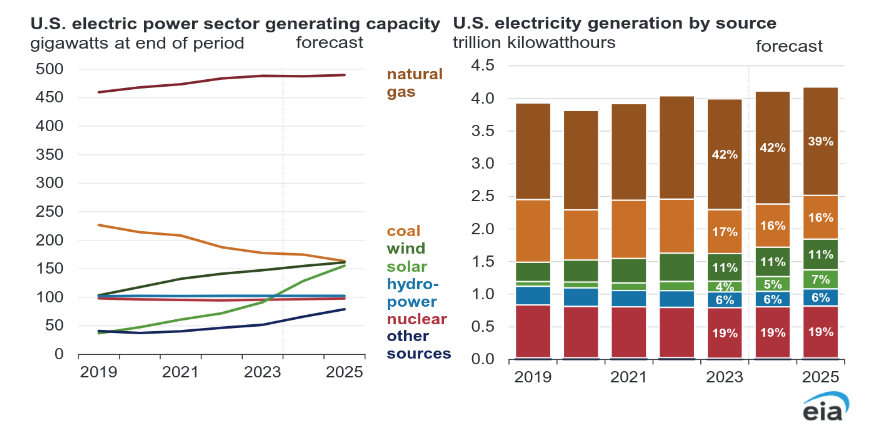
In the chart above the right side which shows electricity generation is of greater interest than the capacity numbers shown in the left side of the chart, by 2025 wind, solar, hydro, and nuclear are expected to produce 43% of US electric power output, up from 40% in 2023 and the share of natural gas electricity generation is expected to drop by 3% from 2023 to 2025 and the coal share by 1% from 2023 to 2025.
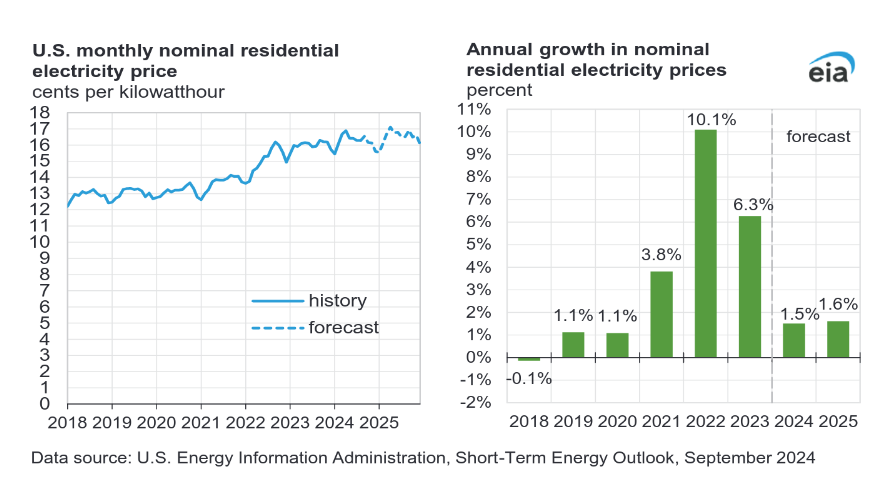
Electricity prices jumped in 2022 due to high natural gas prices, but price increases are expected to be below the rate of inflation in 2024 and 2025.
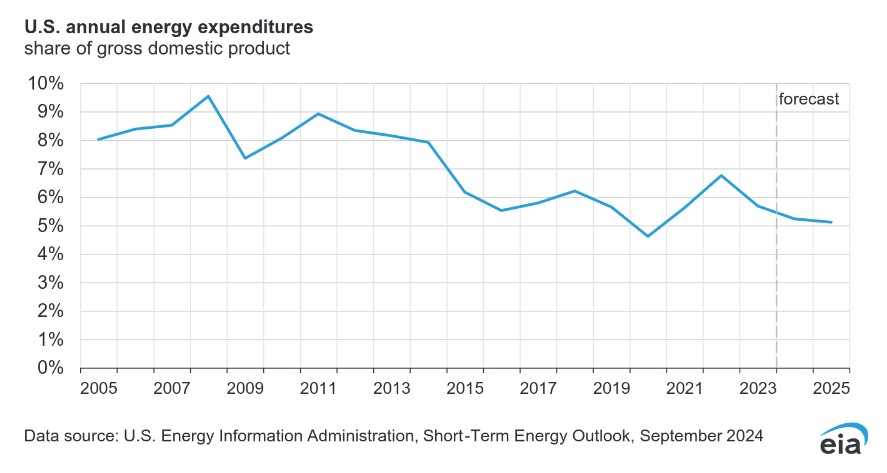
The STEO forecast for the share of US GDP spent on energy is expected fall to a relatively low level by 2025, lower than any year except 2020 over the 2005 to 2025 period. Prices for oil in particular were very low in 2020 during the height of the pandemic.
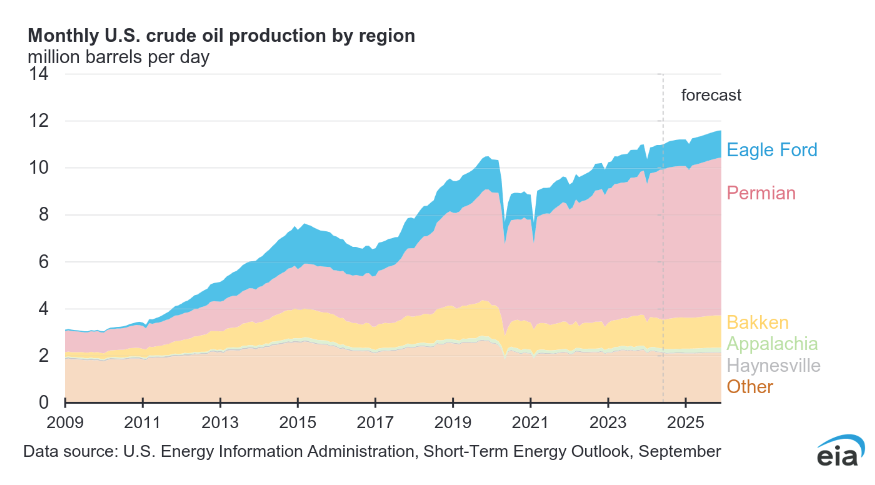
Most of the rise in US C+C output for Lower 48 excluding GOM has come from the Permian basin since 2021, this continues during the forecast period. From December 2021 to December 2023 US L48 excl GOM output rose at an annual rate of about 800 kb/d. Over the period from December 2023 to December 2025 the STEO forecasts an annual increase for US L48 excl GOM C+C output of about 400 kb/d which seems fairly reasonable (possibly 100 kb/d too high). Note that the forecast rate of increase over the 2024-2025 period is about half the rate of increase of the previous two years (2022-2023).
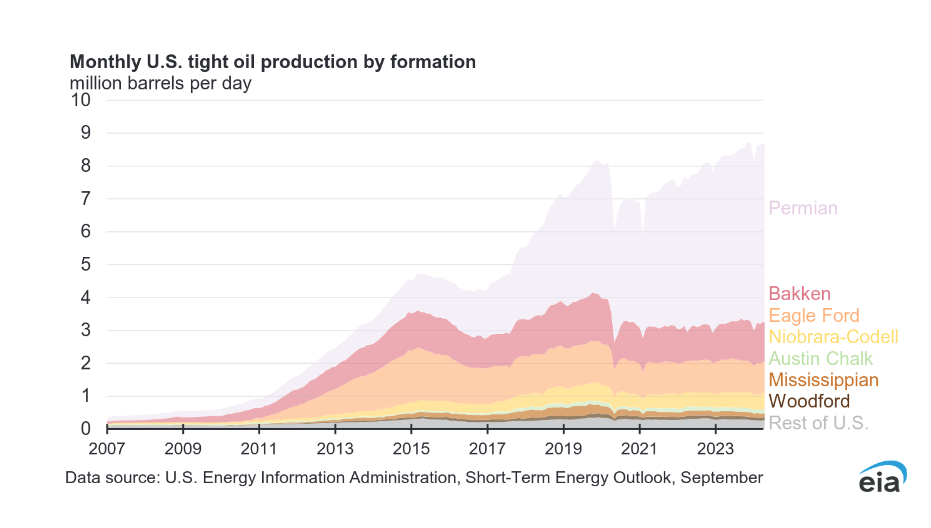
Most of the increase in US output for the past 2 years has come from the Permian basin’s tight oil formations. I expect the future rate of growth may be considerably slower (30 to 50% of the annual rate of increase of the previous two years), especially if oil prices remain under $75/b.
142 responses to “Short Term Energy Outlook, September 2024”
Thanks, Dennis,
great post.
A couple of comments.
1. Estimating all-world consumption and production is difficult, so EIA may very well be wrong. However, I reject the notion that oil price is a better arbiter. Oil price movements are multi-factorial and inventory change is only one factor that influences it. Especially over short timescale, crude price has very little correlation with flow balances.
2. On the same topic, these EIA balances are for total liquids, which includes propane, for example. In Q1 propane stocks go down seasonally (heating), while crude stocks don’t. So, for example a Q1 liquids draw would not be expected to affect crude prices, because it mostly reflects propane draws.
3. It’s quite strange that their liquids growth in 2025 matches their crude growth??? NGLs have been growing even faster than crude, so to have ~2.5MMBP crude growth in ‘25 and ZERO NGL growth doesn’t make much sense…
Kdimitrov,
Yes there are flows besides crude included in total liquids, note that my comment about consumption being higher than consumption was over a 4 quarter period, so seasonality wouldn’t be a significant factor in that case. In the short term I agree prices can be very volatile and might not reflect stock movements, over longer periods with stock movements smoothed with by averaging I think we would see some rough correlation with stock movements and prices, though I haven’t looked at it closely enough to see how well they correlate.
My thinking is as follows when markets are tight or are expected to become tight we will see higher prices (these periods are typically when we see low stock levels relative to the 5 year average). The classic examples are 1979-1982, 2008, and more recently 2022 when there have been either tight oil markets or (in 2022) the expectation that the market would be tight.
Generally I don’t think prices tell us much, but a low oil price environment when theoretically there has been a stock draw for 12 months (based on EIA data) seems strange. Oil prices were about $90/b in April 2024, now they have fallen to $75/b (most recent 30 day average for Brent), over this period the EIA claims that consumption has been higher than production, to me the claim that other liquids (around 20% of total liquids is not C plus C) accounts for this doesn’t seem right. It could be that prices are low because it is expected that OPEC will quickly unwind their cuts in December or that the World will soon enter a significant recession. My guess is that the EIA is overestimating future production and consumption, but I have been wrong before and history is likely to repeat.
Here are World non-crude liquids from the STEO with forecasts begining in June 2024, the centered 12 month average is also shown with values for 2023, 2024, and 2025 shown on chart in millions of barrels per day (Mb/d).
I don’t understand how the global production is going to increase so much. South-East Asia, Russia, Africa, Europe, Central America are in oil production decline. KSA is struggling to maintain its production with the decline of Ghawar, Safaniya and Abqaiq while the other oil fields are poised to begin their own decline sooner or later. The EIA itself doesn’t see the production of the USA increase through 2024 (most of the recent production increase of USA is from the Permian oil production increase). Indeed, the more the oil men are fracking new wells, the more those wells are venting methane and other volatile stuffs (you know, the story of the GOR popping out from stable pattern) with the result that 2 of the few counties of Permian which are producing in total half of the Permian production are in decline and there are some doubts about the others. To that you should add the decline of Russian production, which was forecasted since a long time, by the way, In total, you have one of the three countries, which are gathering 40% of the world production, which is in decline and the other two which find themselves in a more precarious position than they would like. And with that, the world oil production will increase in 2025 and even surpass the previous oil peak of 2018. Of course, of course, sure, especially in a parallel world. Besides, if the prices of oil are low, it is not because of expectations of a reduction in OPEC cuts or of global recession. Should I mention the fact that the economies of China and Europe (two of the three major economies in the world) are in dire states with resulting decline in oil consumption?
I tend to agree that the EIA’s forecast for robust growth from June 2024 to December 2025 a an average annual increase of 2700 kb/d seems unrealistic. Keep in mind that the non-OPEC nations of Argentina, Brazil, Canada, Guyana, and Norway jave increase output over the past 2 years at an annual rate of 600 kb/d and this might continue for a few more years, the OPEC Big 4 has about 2200 kb/d of spare capacity which could be brought online at perhaps 550 kb/d over 4 years with non-OPEC perhaps contiributing about 250 kb/d per year so that an 800 kb/d increase over 4 years could increase World output by 3200 kb/d to bring World output to perhaps 85 Mb/d.
So while I agree 2700 kb/d annual increase over the next 1.5 years seems unrealistic, an 800 kb/d annual rate of increase over the next 4 years (if demand increases by a similar amount) does not seem unrealistic to me. The more likely scenario in my mind is that demand never actually increases to that level as the World transitions away from oil for land transportation.
Tesla Model Y is near the top of sales for all US vehicles through the first 2 quarters of 2024.
https://wolfstreet.com/2024/09/20/tesla-model-y-now-a-hair-from-1-bestselling-model-closing-in-on-toyota-rav4-former-1-ford-f-150-is-3-stellantis-plunges-off-greed-cliff-ev-share-rises-to-9-0/
I realized the OPEC plan is an 80 kb/d monthly increase, which is 960 kb/d as an annual rate. If the non-OPEC big 5 increasing nations also increase output by 600 kb/d and the US increases output by 300 kb/d and Russia increases output by 300 kb/d, this would add up to 2160 kb/d if the rest of the World has flat output. This scenario lines up nicely with the STEO forecast for annual C plus C growth from 2024 to 2025 (2274 kb/d) with only a 114 kb/d difference.
I do not think there will be enough demand to support this large an increase in output, I think the actual level of increase will be 1000 kb/d with smaller increases from OPEC and Russia mostly and possibly smaller increases for non-OPEC plus as well.
The chart below looks at World C plus C minus combined output from OPEC 4 (Saudi Arabia, UAE, Iraq, and Kuwait), the non-OPEC 5 (Argentina, Brazil, Canada, Guyana, and Norway), US, and Russia. For the past 3 years (June 2021 to May 2024) the trend has been an annual increase of 382 kb/d. For the 11 nations combined (OPEC 4, non-OPEC 5, Russia, and US) the annual rate of decrease over the past 2 years has been 531 kb/d. World minus these 11 nations C plus C over the past 2 years has had an annual increase of 825 kb/d. World C plus C has increased at an annual rate of 294 kb/d over the past 2 years (June 2022 to May 2024).
The Rig Report for the Week Ending September 27
– US Hz oil rigs dropped by 2 to 440 and are down 19 rigs from April 19. They are up 13 from 10 weeks ago. This is the first week with a 2 rig drop since the low of 427 10 weeks ago.
– The Texas rig count increased by 1 to 240.
– Texas Permian rigs added 1 to 196 while the New Mexico Permian dropped 3 to 96.
– In New Mexico, Lea dropped 1 rig to 50 rigs while Eddy dropped 2 to 47.
– In Texas, Midland added 1 to 25 while Martin dropped 1 to 30.
– Eagle Ford was unchanged at 41.
– NG Hz rigs added 2 to 82.
Frac Spread Report for the Week Ending September 27
The frac spread count rose by 2 to 238. It is also down by 17 from one year ago and down by 34 spreads since March 8.
I´m a bit worried that LNG exports to the EU and Germany in particular will be reduced/curtailed due to this downward trend in fracs, especially as Dennis wrote:
“More LNG export facilities are expected to come online over the next 15 months which will help to reduce the glut of natural gas in the US.”
But with less fracs the amount of availible NG would then be less I think?
Not shure about the Oil/NG ratio of fracs though, for rigs I think it´s not disclosed?
Laplander,
There might be less LNG exported if natural gas production decreases, but note that higher natural gas prices might increase the rate that tight oil and tight gas wells are completed, this will depend on oil prices, NGL prices, and natural gas prices in the future which are very difficult to predict accurately.
Generally more LNG export capacity in the US will result in higher export levels of LNG from the US and higher natural gas prices in the US. The higher natural gas price will tend to increase the rate that new wells are completed. The expectation of the EIA is that natural gas prices in the US will start to increase by 2025Q1.
The article linked below covers the natural gas pipeline expansion plans from the Permian
https://www.eia.gov/todayinenergy/detail.php?id=63044
Summary:
2.5 Bcf/d Matterhorn starts service in Sept 2024, another 2 projects with 4.5 Bcf/d capacity enter service in 2026, and 2.8 Bcf/d is expected in 2027/2028. There are another 7 Bcf/d of projects that have been announced which are expected to come online between 2025 and 2028. If all of these projects are actually built (the announcements are often reversed) that is 16.8 BCF/d of new capacity out of the Permian Basin. Note that not all of this goes to LNG export facilities, some is going to Mexico and won’t be exported as LNG.
For LNG see
https://www.eia.gov/todayinenergy/detail.php?id=62984
Excerpt:
North America’s liquefied natural gas (LNG) export capacity is on track to more than double between 2024 and 2028, from 11.4 billion cubic feet per day (Bcf/d) in 2023 to 24.4 Bcf/d in 2028, if projects currently under construction begin operations as planned. Between 2024 and 2028, we estimate LNG export capacity will grow by 0.8 Bcf/d in Mexico, 2.5 Bcf/d in Canada, and 9.7 Bcf/d in the United States from a total of 10 new projects that are currently under construction in the three countries.
Bottom line is about a 13 Bcf/d increase in LNG exports from North America between 2024 and 2028 if all projects that have started construction are completed as scheduled.
Interesting:
“The Russian Ministry of Energy aims to produce 540 million tons of oil by 2050, with reservations regarding OPEC+ conditions
September 26/ 10:40
Moscow. Russia’s target for oil production in the baseline scenario by 2050 is 540 million tons, the volumes can be adjusted depending on the country’s obligations within OPEC+. This was stated by First Deputy Minister of Energy Pavel Sorokin “on the sidelines” of the Russian Energy Week.
“Indeed, 540 million tons is the baseline scenario that we are setting for oil production by 2050, but with reservations taking into account interaction with our OPEC+ partners. We do not have the task of flooding the market if it does not require it. But this also works in the opposite direction: to provide an additional resource to the market if it is required,” he said.
Pavel Sorokin noted that Russia is calm about the potential increase in demand both until 2030 and until 2050, Interfax reports.
“From our point of view, it is quite significant. This is at least 5-7 million bpd, that is, approximately 4.5-5.5% of current consumption until 2030. Then we are talking about an additional 5% increase until 2050,” the first deputy head of the department emphasized.”
“Russia sets the goal of producing 540 million tons of oil per year in the long term
September 27/ 10:00
Moscow. Russia sets the goal of producing 540 million tons of oil per year in the long term. This was announced by Deputy Prime Minister Alexander Novak at the Russian Energy Week.
“As for the prospects for oil production, we set ourselves the task of maintaining the production level at about 540 million [tons] in the long term. And for this, of course, a lot of work will need to be done, since it will be necessary to involve new reserves, fields, new regions, and develop hard-to-recover deposits,” he said.
According to the Deputy Prime Minister, we are talking about “a lot of work over a long period.” “This is our baseline option. We always focus on the fact that the target level for us is the baseline of 540 million tons,” TASS reports Novak as saying.
According to the target scenario of the draft energy strategy of Russia until 2050, Russia can reach an oil production volume of 540 million tons in 2036 and maintain this level until 2050. In 2023, the volume of oil production was 531 million tons. The target scenario assumes balanced development of industries with the lowest costs and the realization of the country’s export potential.”
“Alexander Novak: Russia does not see peak demand for either oil or gas before 2050
27 September/ 09:20
Moscow. There will be no peak demand for oil and gas before 2050, so investments in these industries cannot be reduced in order to prevent a shortage of energy capacity in the world. Deputy Prime Minister Alexander Novak spoke about this at the Russian Energy Week.
In addition, he noted the special role of nuclear energy, which, along with traditional energy and hydrocarbons, is capable of ensuring the growth of global energy demand in the world in the next twenty years.
“The sun and wind will not be able to provide the global increase in electricity demand. In this regard, demand for nuclear energy is resuming. And if several years ago nuclear energy was considered environmentally unfriendly by many countries, today it is globally recognized that electricity generation at nuclear power plants is clean. In this regard, new capacities are being built: another 66 GW of capacity under construction will be added to the 390 GW of existing capacities,” Alexander Novak was quoted as saying in the Russian government’s Telegram channel.”
—-
I consider the forecasts of the above persons to be unrealistic, due to the lack of explored deposits on the territory of the Russian Federation. At the same time, the decline in oil production will not be catastrophic, at old deposits the decline will continue within 2-6% per year, and the commissioning of new projects will also continue, which will slightly slow down the real decline in production. In addition, it should be borne in mind that after some time the implementation of the giant project of the Rosneft company “Vostok Oil” may resume, it is impossible to develop it by the forces of the Russian Federation in the near future. Let me remind you that its cost exceeds one hundred billion dollars and provides for the construction of a port, a city, thousands of kilometers of railways, thousands of drilled wells. The project provides for the production of about 2 million barrels in 5 years from the start of construction.
Probably the window of opportunity for a repeat of the “peak oil production” in 2018 will remain for about 10 years and will depend on the rate of decline in production in such countries: the USA, Russia, Norway, Azerbaijan and Great Britain.
In the previous article, in the comments they wrote about inflation in the Russian Federation at 19%, this is not true. The official inflation for 12 months is 9%, which is close to the truth. I note that for the most important items it is even lower, I include gasoline, dairy, meat products and bread. Although the price of cars (Chinese-made, Western ones are simply not on sale), has increased by more than 50% since 2021. The Central Bank of the Russian Federation rate is 19% (which is bad for business), high-interest bank deposits have sucked cash out of turnover. Considering the habit of citizens to save their savings in dollars, with a rate reduction (I suppose it will happen someday) the dollar exchange rate (it is currently 92.7) and inflation will grow sharply. I don’t think there is any point in expecting protests in Russia, the people (including me) support Putin’s policy.
For those who are less familiar with tonnes of oil, if we assume about 7.3 barrels per tonne, the 540 million tonnes per year is 10790 kb/d average annual output. This seems an optimistic estimate.
The President’s speech at the energy forum mentioned the fields, but without details. Not one word about wind or solar, by the way:
“Thanks to state support measures, offshore fields, such as Prirazlomnoye in the Arctic and projects on Sakhalin, are being developed. Hard-to-recover reserves are being developed: the Palyanovskoye oil field in the Khanty-Mansiysk Autonomous Area and the Yuzhno-Neprikovskoye field in the Samara Region.
New oil and gas provinces are being introduced in Eastern Siberia and the Arctic. I mean large projects, like Vostok Oil in the Krasnoyarsk Territory, and the Utrenneye and Shtormovoye fields on the Gydan Peninsula”
Interfax in 2022 published some details on these newer plays, including oil reserves:
“July 26 2022 (Interfax) – Rosneft has begun production drilling at the Vostok Oil project’s Paiyakhskoye field on the Taimyr Peninsula.
“The stage of production drilling begins today. Production [well] clusters are beginning to be drilled, meaning the project is moving from the stage of geological exploration to the stage of production. These are already production wells that will then be tied into pipelines and produce oil,” Vostok Oil general director Vladimir Chernov told reporters.
Oil deliveries from the field will begin in 2024, he said. “By 2027, there will already be a good result – up to 50 million tonnes from the Vostok Oil project will be delivered to world markets along the Northern Sea Route,” Chernov said.
Drilling began at the Irkinsky licensed area of the Paiyakhskoye field. The well depth will be 3.5 kilometers. The project is using Arctic class drilling digs built by the Ural-Siberia Industrial Company (USPK), which are capable of drilling to a depth of 6 km.
Vostok Oil, Rosneft’s flagship project on the Taimyr Peninsula, includes 52 licensed areas in the northern part of Krasnoyarsk Territory and in the Yamalo-Nenets Autonomous District. They have 13 discovered oil and gas fields, including the Vankor group of fields already being developed and new ones. The project’s resource base is estimated at 6.2 billion tonnes of liquid hydrocarbons.
Rosneft began large-scale development of fields on Taimyr as part of the Vostok Oil project in 2020. The 52 licensed areas include the Vankorskoye, Suzunskoye, Tagulskoye and Lodochnoye fields, as well as the new fields Paiyakhskoye, with reserves of more than 1 billion tonnes of oil, and Zapadno-Irkinskoye with 0.5 billion tonnes of oil.
The project’s production could potentially total 115 million tonnes of liquid hydrocarbons per year. Rosneft has promised to ship 30 million tonnes of oil from Vostok Oil along the Northern Sea Route in 2024.”
Alexander Opitov,
Is the 2-6% annual decline the rate for Western Siberia?
The revival of Russian oil production after the 90s collapse came mostly from re-stimulating Western Siberia. Infill wells, secondary floods, etc. This is known in the oil industry as acceleration, basically draining the field faster. The flip side to it is that the decline rates also accelerate.
KDIMITROV, yes, indeed, we are observing approximately the same rate of production decline in Western Siberia. For a long time, production in Western Siberia (Yugra) was more than half of Russia’s total oil production. So in 2007, at the peak, 286 million tons of oil were produced there, and in 2023, only 216 million were produced, which, by the way, is 7 million tons higher than the planned figures (the plans were drawn up before 2019). Production in 2023 decreased by 3 percent per year (in 2022, 2023 million were produced). According to the production plan for 2024, which was recently announced, 2022 million tons should be produced in Yugra. At the largest field in Russia, Samotlor, 113 million tons were produced per year in 1985. In the 90s, production fell to less than 21 million tons per year, in the 2000s about 30 million tons per year. In 2019, about 20 million tons per year were produced (about 400 thousand barrels per day). I think nothing catastrophic will happen to production in the Russian Federation in the near future. The lack of our own competencies in technology was due to the fact that it was cheaper to buy them than to develop and spend money and time on our own. Now, recently, there have been many statements by high-ranking officials that investments in the development of oil production are not advisable in the context of a budget deficit, low oil prices, and military action in Ukraine.
* typo:
“Production in 2023 decreased by 3 percent per year (2023 million were produced in 2022).”
should read:”Production in 2023 decreased by 3 percent per year (223 million were produced in 2022).”
* typo:
“2022 million tons should be mined in Yugra”
correct:
“222 million tons should be mined in Yugra”
Net petroleum exports from Russia dipped below 7 Mb/d in August. While traditionally August is maintenance season, this is the lowest volume since the 2022 invasion started.
https://www.ogj.com/general-interest/economics-markets/article/55140861/august-russian-oil-exports-at-lowest-level-in-3-years
The few media reporting on these issues are still signalling significant declines in exported volumes. If the data reported by Bloomberg are correct, in September Russia’s net exports were again well under 7 Mb/d.
https://www.bloomberg.com/news/articles/2024-09-24/russia-s-earnings-from-oil-exports-fall-for-a-fourth-week-after-flows-tumble
A related topic to keep an eye on is the significant decline of the grain harvest. Russian authorities are forecasting a 10% decline from 2023 to 2024. However, on the fourth week of September this year’s harvest had only reached 73% of the 2023 volume (and including the grain plundered in the Donbass). Authorities blame this decline on the Climate, but exiled Russian communities speak of unprecedented shortages of labour and machinery.
https://interfax.com/newsroom/top-stories/106011/
After the killing of Nasrallah, Iran calls on the Muslim world to confront Israel. What is the opinion in this group: can ME OPEC impose an oil embargo like in 1973?
http://crudeoilpeak.info/oil-crisis-1973
I doubt it, they don’t have the balls.
Great way to fuel resentment for future terror attacks though. further destabalizing the region and therefor future oil production
“Iran calls on the Muslim world to confront Israel”…whats new?
How much of the Muslim world wants to join the side of the Militant Fundamentalist organizations like the government of the Islamic Republic of Iran, or Hezbollah, Islamic Jihad, Houtis, Hamas, Al-Qaeda, Boko-Haram, Abu Sayyaf, Al-Aqsa Martyrs’ Brigades, Taliban, etc?
I suspect many in the Muslim world may want to prioritize other goals for their personal lives, and society.
Let’s move this discussion to the Non-Petroleum thread, thanks.
They are completely isolated, not even in Iraq there would be support for such action. Turkey is the only Sunni country supportive of Iran, but a petroleum embargo is something that can’t possibly afford.
Call me crazy all you want, but it seems like we’re hitting the global limits since 2018. The data as well as the general feeling seems to confirm this.
I don’t know where they get these projections from. Watch in amazement after 10, 20, 30 years of decline (if we are still alive) they will still be projecting a stabilization or increase into the future!
Because all these increases magically happen, right? It doesn’t take workers or money or resources to produce anything. It just magically increases in the future.
World real GDP, data from World Bank. Average growth rate around 3% per year.
So according to that graph, the economy must have decoupled from oil production. From 2005 onwards oilproduction increased by ~11%, Which, by the way is all from US alone, while “real gdp” increased by ~70%, that’s alot. If real GDP could be trusted as a reliable way of measure growth, we should all be doing much better than we were 20 years ago, While it seems more likely most peoples wages has gone down significantly during that time. If the US had any real growth whatsoever during that time period, people would surely buy more cars? are they? no, car sales reached a plateu similiar to the 80s and 90s during this last cycle.
John,
The US is not the World, growth in OECD nations has been slower than the non-OECD. Oil has become much less important in the World economy than it was 50 years ago. The average citizen of the World is doing much better in 2023 than 20 years ago. In the US the income tax has beme much less progressive which has allowed the income distribution to become much more unequal than it was before 1980. So median income has not grown as fast as average income as the rich have gained a far greater share of the increased income in the US. This is a choice citizens of the nation choose by electing representatives that favor the rich rather than the middle class. It is not the choice I would make. I would choose US income tax rates similar to those in 1965 adjusted for inflation since 1965.
Note that annual growth in real GDP per capita has been about 1.67% from 1960 to 2023. As the annual average growth rate of human population continues to slow over time (perhaps reaching zero around 2060), World real GDP growth may fall to about 1.7% from the average rate of around 3% for the past 63 years. This will put less pressure on resources and the global ecosystem. As population declines after the peak World real GDP annual growth rates may approach zero once population decline reaches 1.66% or so, assuming the growth rate in real GDP per capta remains at the 1960 to 2023 average rate (there is no a priori reason why this would be true, it is a simple WAG).
Chart below uses constant 2021 international $ which uses PPP exchange rates rather than market exchange rates, for 1990 to 2023 (no data before 1990) the average annual rate of growth in World real GDP is 3.32%. For comparison over the same period at market exchange rates the average annual rate of growth is 2.98%.
Years ago I read that if you really wanted to contribute to the GDP, you should ram your car into a school bus. Then file a few lawsuits, and if you’re really committed, go on a shooting spree. All of these substantially and materially contribute to GDP.
I wouldn’t go around crowing about how great the GDP is doing given those facts.
Searching Googles for verification I found this instead:
“High schools have had the most school shootings since 2000, accounting for about 61% of recorded school shootings. Elementary schools have had the second highest number of school shootings, with 23.6% of recorded shootings, followed by middle or junior high schools with 12%.
However, shootings at elementary schools may be deadlier than those at high schools. This could be because elementary school students are more physically vulnerable and less likely to have or use guns.”
Professional work (medicine, law, engineering) is real work.
And healthcare is especially valuable, even if it is sometimes needed to treat mental illness (or it’s results).
Nick, you totally missed the point made by G2S. It’s a poor metric when the more damage done to property and people the better the GDP number.
‘They’ have changed the way inflation is calculated making the GDP deflator a lower number than it was with a different type of inflation calculation done in the ’70’s, therefore can make ‘real GDP’ look good when it isn’t.
We’re not measuring damage, we’re measuring productive repair work. Whether the damage is caused by a hurricane, or by a crazy person, the cleanup is still real and valuable work.
And, in a fully utilized economy it won’t increase GDP; instead it will displace other, lower priority work. At the end of the day, wealth will be lower than if the damage hadn’t happened, which is what you’d expect. Wealth (and health) is the proper measure here, not GDP (which is just production and income).
To illustrate: if a hurricane damaged houses, workers would have to repair houses instead of building new ones. This means GDP remains the same, and there is less wealth than otherwise (fewer houses).
Hideaway,
See Billion prices project which finds the inflation numbers are pretty good. No measure in social science is ever perfect. The Human Development Index (which as a per capita measure) could also be used in place of real GDP, though data is only available from 1990 to 2022. The HDI has grown at an average annual rate of only 0.7% per year from 1990 to 2022.
Dennis
It’s not real it’s just a function of ever increasing debt.
https://surplusenergyeconomics.wordpress.com/2024/08/20/287-the-mythology-of-growth/
JT,
The surplus energy guy is not an economist his doctorate is from Cambridge University in history and political philosophy.
https://www.gresham.ac.uk/speakers/dr-tim-morgan
Don’t believe everything you read on the internet. The growth in real GDP is goods produced, at the World level debt is simply money we owe ourselves. Not really a problem according to those who actually understand economics.
This article is another example from Italy.
1% GDP growth and 3%+ debt to GDP
That’s not growth
https://www.reuters.com/world/europe/italy-sees-1-gdp-growth-2024-12-2025-cuts-deficit-goals-sources-say-2024-09-26/
Yes, they call paying more and receiving less, growth.
Actual volume in goods are services down while we are paying more for said goods and services. Which in dollar terms shows growth.
That is exactly why GDP tell you very little about the health of the economy.
Money curves and gasoline prices tell you way more about the health of the economy than GDP.
I should add in swap spreads also. Which are currently pricing in much lower interest rates are coming. Why are much lower interest rates coming if everything in the economy is fine and dandy?
HHH,
real GDP adjusts for inflation, this is econ 101. So no at the World level the actual volume of goods and services is not lower, that is just nonsense.
Dennis,
You don’t know what the hell you are talking about. Volumes are down, prices are up showing nominal growth in total dollar figures.
We are paying more for less are calling it growth.
HHH,
The chart I presented is real GDP, which as most understand means constant dollars, so no at the World level you are wrong at least through 2023, I will wait until we have actual data for 2024, though both the IMF and World Bank forecast continued real GDP growth in 2024 (at about 2.5% at markey exchange rates and about 3.2% at the international economics preferred measure of PPP exchange rates.)
Read up on real GDP at link below
https://en.wikipedia.org/wiki/Real_gross_domestic_product
Go find the actual data Dennis. The IMF and World bank aren’t going to publish anything contrary to everything is rosy outlook.
Both Europe and Japan are paying 3% more for about 2% Less total goods and services. Do you see the delta there?
Total goods and service aren’t growing. It’s just what is being paid for those goods and services is growing.
The BS continues, like I said HHH reminds me of Trump.
Now HHH is claiming the IMF and World Bank are fake news. Stating 5% inflation with no reference or link to back up his lie. Both Europe and Japan are currently running at 2 to 3 percent inflation.
Next HHH is going to complain about the price of oil at about a 3 year low. This is all about false political anger entertainment.
HHH,
I found the actual World data using FRED, it is what I used to create the chart, where are you finding your imaginary data? Europe and Japan are no doubt growing more slowly than the World as a whole because developing nations grow at faster rates (as a group). This is well understood by most. Japan’s real GDP has grown at only 0.74% per year on average from 1990 to 2023, part of this is because population peaked in 2008 and is now in decline. Real GDP per capita has also grown quite slowly in Japan since 1990 (about 0.7% per year). European Union real GDP annual growth rate has been about 1.6% from 1990 to 2023.
Dennis we keep changing the way inflation is measured. John Williams at Shadow stats measures inflation the way it was measured in 1980, and has kept it the same way. Low and behold the real inflation is much higher than the number used by all the official channels, that wish to show low inflation.
The median householder/family in the western world is much worse off than 50 years ago, when a single income family could afford a house, annual holidays, health insurance and good education for their kids, with house being paid off over 10-15 years.
That measure alone tells anyone paying attention that modern families are far worse off, which means the ‘official’ numbers are bunk.
Dennis
The reason why global GDP is higher is because the richest 5% of people in the world have vastly more money to spend.
https://www.oxfam.org/en/press-releases/richest-1-bag-nearly-twice-much-wealth-rest-world-put-together-over-past-two-years
Sales of luxury goods, like watches, jewellery and Yachts have increased, people with so much money they can fly into space. At the same time a billion people struggling to pay for food and heating.
Fact is it does not take much energy to make a Rolex watch, but far more to plant and harvest and drive a tonne of potatoes to the local shop.
GDP tells us nothing about how society is really doing.
Hideway,
The shadowstats estimates are bunk. Median income in the OECD has not grown as fast as average income due to bad tax policy and worsening income inequality that results from those bad policies.
For the US real median personal income grew at an average annual rate of 0.985% from 1974 to 2023 while real GDP per capita grew at an average annual rate of 1.74% from 1974 to 2023, this was primarily due to changes in government policy in income taxation and a lower level of workers in Unions as manufacturing jobs left the US.
It has much less to do with the way inflation is measured.
Loadsofoil,
I agree real GDP is an imperfect measure which only reflects goods and services traded in markets. I also agree that income inequality is a significant problem which can be addressed through better taxation policy, revert to progressive taxation that was in place in the US from 1935 to 1970, with tax loopholes removed and with brackets adjusted for inflation annually. The Human Development Index is an alternative measure that could be used instead of real GDP per capita.
There are no perfect measures, we could use no measure at all and simply hand wave. I prefer to use the data at hand.
“The richest 1 percent grabbed nearly two-thirds of all new wealth worth $42 trillion created since 2020, almost twice as much money as the bottom 99 percent of the world’s population, reveals a new Oxfam report today. During the past decade, the richest 1 percent had captured around half of all new wealth.”
https://www.oxfam.org/en/press-releases/richest-1-bag-nearly-twice-much-wealth-rest-world-put-together-over-past-two-years
Misallocation of scarce resources…on grand scale.
Hickory,
Note that wealth is often in the form of financial wealth in stocks, bonds, and real estate and the prices of these assets can change very rapidly, going from boom to bust. GDP can also change but tends to have smaller percentage changes. GDP is essentially income ( a flow of funds ) whereas wealth is a stock of funds, the two are related but not the same. There was substantial wealth inequality before the Great Depression, some of the disparity was taken care of by the stock market crash in 1929, but a big piece of a more fair distribution of income were the tax rates passed by the FDR administration which had top income tax rates of 88% in 1942 on income over 200k for a married couple.
The top marginal tax bracket was increased to 94% on income above 200k in 1944. The top marginal rate was dropped to 91% in 1946 (again on income over 200k for joint tax return). In 1952 the top rate was increased to 92% on income over 400k for joint filers and then was reduced to 91% in 1954 on income over 400k for married couples where it remained until 1964 when the top rate was reduced to 77% for income over 400k for joint return. In 1965 the top rate was reduced to 70% on income over 200k for married couples and remained at this rate and income level until 1976. From 1977 to 1980 they left the rate unchanged but gradually increased the income cutoff to 215k by 1980.
In 1982 we had the start of the Reagan tax cuts where the top rate came down to 50% on income over 85.6k for joint filers, in 1983 income above 109.4k was subject to 50% marginal rate, in 1984 to 50% rate applied to income over 162.4k, and in 1985 the 50% rate applied to income over 169k. In 1987 the top marginal rate dropped to 38.5% of income over 90k. In 1988 the top rate was dropped to 28% of income over 29.75k, by 1993 the top rate was back to near where it is today (39.6%) but for income over 250k.
From 2001 to 2005 the top rate gradually dropped to 35% on income over 326k. By this time the brackets were being indexed to inflation so they gradually increased from 2005 to 2012. In 2013 the 39.6% top rate was added on income over 450k. In 2018 the top rate was dropped again to 37% on income over 600k where it remains today (except it is for income over 731.2k for joint returns in 2024.)
If we went back to 1976 income tax rates indexed for inflation, but reduced the number of brackets we would have for 2024 a 70% rate on income over 1.1 million, 60% rate on income over 486k, a 50% rate on income over 243k, a 40% rate for income over 155k, a 30% rate for income over 88k, a 20% rate for income over 22k and a 10% rate for income over 5.5k.
Also, and very importantly, the estate taxation should be massively adjusted. What person needs to inherit more than [pick a number] $10 million? Above a certain threshold the estate tax should be extremely high. People need to run based on merit rather than a massive birth bonus.
It would be interesting to the Real GDP trend chart broken down by wealth segments. i think we’d find that real GDP/capita did rise much for the lower 2/3rds over the past 30 years, with exceptions for rapidly developing zones like China and a few others.
Hickory,
I agree such a chart on income growth for different quintiles of income would be interesting, the best I can do is US average income vs median income and growth of median income was about half the rate of average income as rich got richer due to the policies of the Reagan/Bush administration and there aftermath. I agree estate taxes should be higher and the law should be changed so that trusts are not able to shield inheritance from taxes.
Dennis,
As you said wealth is often in the form of financial wealth in stocks, bonds, and real estate.
Absolutely. But the part i disagree with is the rapid change of value in these assets. Well at least not anymore. The rich have cemented their position via institutions such as the federal reserve for example to make sure the price of these assets never drop substantially again. The Fed is completely accommodating to what wall street wants, not main street.
I agree with your views on taxation as a policy to at least narrow some of the huge gap in wealth inequality.
Hickorys comment is interesting, the allocation of real GDP per capita to the wealthy compared to the poor. I think that data would be extremely gut wrenching if not outright shocking as it will clearly present human greed in the form of monetary, fiscal and taxation policy.
The allocation of resources are primarily going to the ones pushing these policies and to the ones getting lobbied to implement these policies. Good old revolving door and conflict of interest working hand in hand driving wealth inequality. In the form of big corp and big government.
Iron Mike,
The US system is not ideal, it is less representative than European democracies, though it seems even in Europe things are moving to the right, not clear why people think the right will help the common man, my reading of history is the opposite tends to be the case at least in Western and Northern Europe.
Dennis,
In Australia we will have the federal election soon. Immigration is the big election issue here and large portion of the people are sick of the government running unchecked immigration. So naturally they will vote centrist to right. But we’ll see how it goes. Europe is the same, I believe immigration is at least one of the biggest issues driving voters right there.
Again its a complex issue. I don’t know if you would consider Hitler as right (i personally don’t ), but economically the Nazi party did economically turn Germany around from the Weimar republics economic despair to a world economic superpower. If i am not mistaken Hitler was Times man of the year in 1938.
Iron Mike,
Yes I consider Hitler the extreme right and would consider Stalin the extreme left, I am not a fan of either. Generally dictators can get a lot done, but unchecked power is a problem in my view. Didn’t realize immigration was a problem in Australia, seems strange that nations consisting of mostly historic immigrants are anti-immigration (this applies to both the US and Australia). I would think this is a bit less of a problem in Australia than in the US as there aren’t any land borders. Soon it may be a problem for Canada depending on the result of the US election, they may need to build a long fence.
Dennis,
Unchecked immigration is a problem to any country. When you increase your population by importing millions of people without the adequate infrastructure and in the midst of a rental crisis, there is going to be a lot of unhappy people and rightly so.
It also has disastrous consequences to the environment. It isn’t an issue of racism, for most people at least.
The government is doing this to avoid having negative GDP stats and lobbied by big business, as high immigration rates suppress wages and increases consumption. We’ve had 8 quarters of negative GDP per capita which the government conveniently avoids.
Let’s correct a bit of history: the Nazi’s did not perform economic miracles.
Their methods included: falsifying unemployment figures; semi-slave labor building public works; re-arming for war; and true slave labor in camps: 12M killed, mostly through starvation rations, which made that labor very cheap.
Nothing to be imitated…
Iron Mike,
Is there unchecked immigration in Australia? Can’t more homes be built, if there is a shortage? Also note that a consistent labor shortage can lead to a wage price spiral and increased rates of inflation. Most of the arrivals are temporary visa holders. I guess this could be reduced, clearly up to the people of Australia.
https://www.abs.gov.au/statistics/people/population/overseas-migration/latest-release
JT —
You are confusing government debt with total debt, a common mistake. When the Italian government talks about deficits, it’s talking about government borrowing, not total borrowing.
Government debt is only a small part of total debt.
Actually, I think we’re looking at confusion between debt incurred by oil importing countries, and world debt.
If oil prices suddenly jump, as they did in the 1970’s, oil importers suddenly have a lot more debt. That was a big part of the whole petro-dollar idea: Nixon demanded that KSA recirculate their sudden influx of cash into US banks, in order to prevent weird imbalances.
That’s the problem with debt: it causes imbalances, leverage, instability, etc. It’s a real problem, though it’s very easy to exaggerate.
Which brings us back to world debt: overall it’s a wash, because debt owed has to equal debt due. It becomes a problem when there imbalances between countries. But that’s a very old, familiar problem: everyone should read “This Time It’s Different: 8 centuries of Financial Folly”.
Greece, for instance, has been defaulting on it’s debt about every 25 years, for 200 years. It’s oil imports, and it’s adoption of the Euro, made things a bit worse, but basically there’s nothing new there.
And lenders know all this. Well…most do, and they figure the risk into the cost of doing business, Some, of course, are dumb…
In the meantime wholesale gasoline prices are at $1.95 to end last week. Not because of an oil glut.
Because inflated prices of just about everything that is needed to live on has taken a toll on the purchasing power of the average American consumer.
Price of gasoline goes up, HHH complains. The price of gasoline goes down, HHH complains.
America, no recession, price of gasoline going down, unemployment low, interest rates going down, the stock market at record highs and the SPR filling. What’s not to like ?
HHH is selling fear and political anger entrainment
HB,
If everything is as great as you say it is. What are you worried about? Little ole me isn’t going to change how great everything is and Harris will obviously since everything is so great win in a landslide.
Most people that are voting are adults and can make up their own mind due to their own personal situation on how well the economy is doing.
I wasn’t going to vote. But if you keep trolling me because that’s what you do and who you are. I’ll go vote for Trump.🤣🤣🤣
HHH,
That would ensure that things will be as bad as you claim.
“Most people that are voting are adults and can make up their own mind due to their own personal situation on how well the economy is doing.”
HHH,
The truth is most voting American don’t even know the importance and consequences of this coming election. You are clearly one of those unless you are a Russian troll. I have been saying to most of my good friend that November 5th will be the most historical day of my 68 year life. Nothing is going to change the future of mankind more since the end of WWll. America has been in a cold war with Russia since before I was born. This is about democracy or one-party totalitarian dictatorship around the world, not just America.
This is all about Ukraine and Russian aggression. Russia will not stop with Ukraine, Poland will be next. China will move on Taiwan. Iran will be embolden. Trumps plan is to hand Ukraine over to Russia. Russia, China, South Korea and Iran are not our friends. Their Trumps friends. They would like nothing more than to take America down and transfer it’s world power to themselves. This power is what gives us our high standard of living and makes the dollar the world standard. Americans can’t support our standard of living without the control of world trade. Without this superpower, Amerian inflation is going to see heights you can’t imagine and empty shelves at stores. The change will be worse than a lot of you expect when the word “collapse” is used on POB.
When you say it doesn’t matter who wins the election. It shows just how much you have fallen for the propaganda adversaries are pumping into the US. The Christian Right followers have been turned into a cult and being used to gain power.
After World War ll the world was destroyed except for America. The Russian’s have been pointing nuclear missile at America for the last 70 plus years. They are not our friends. And you HHH, what’s important to you? 2’s and 10’s and making a buck. You clearly don’t know history or understand. Your world of 2’s and 10’s is built on democracy. Freedom isn’t free. You have just never had to pay the price for it. Don’t think your world can’t be turned upside-down and America can’t suffer as did Europe after WWll.
Trump doesn’t care about you. Most Americans are clueless and feel entitled to their good fortune, that good fortune could easily disappear. They think of it as a sporting event and rooting for their favorite Red or Blue team. You got 36 days to pull your head out and study history. Trump thinks Putin is his buddy as Putin kills innocent civilians in Ukraine everyday with a war Putin started.
HHH this is about your character and what you are made of also.
“It’s all about Ukraine and Russian aggression. Russia will not stop at Ukraine, Poland will be next. China will attack Taiwan. Iran will be bolder. Trump’s plan is to hand Ukraine over to Russia. Russia, China, South Korea and Iran are not our friends.”
——
Russia was forced to start a war in 2022 due to the danger of Ukraine joining NATO and the appearance of missile launchers on its border. The condition for refusing to attack was an ultimatum that Ukraine would not join NATO. The war in Ukraine is not popular in Russia, but citizens perceive it as a necessity. An attack on Poland looks like madness, there are no reasons, no resources, no military equipment and people, and most importantly, for what purpose? The Russian economy is probably tens of times weaker than the countries that are members of NATO. And half of the military budget goes to strategic nuclear deterrence forces. =====
“It is this force that provides us with a high standard of living and makes the dollar a world standard. Americans will not be able to maintain our standard of living without control of world trade. Without this superpower, American inflation will reach unimaginable heights and store shelves will be empty.”
—–
You are certainly right here, but your government has proven incapable of making the right decisions and promptly influencing the situation after the mistakes made. I think that by supporting Ukraine, it did not seriously count on the victory of the Ukrainian army over the Russian army. It counted on the fact that failures in the war would lead to protests and the fall of the government, after which it would be possible to bring to power some bastard like Yeltsin or Gorbachev, maybe divide Russia into a dozen different states. This did not happen. The fact is that citizens support President Putin, never in history have people lived so well and the level of consumption was so high.
– Putin removed the ability of oligarchs to influence the country’s policy, appoint ministers and influence elections.
– Stopped the war in Chechnya. Chechnya had no chance of becoming an independent country, because Chechnya has no industry and the ability to conduct self-sufficient economic activity. During the period of “independence”, the country’s economy was based on crime, drug trafficking and kidnapping from Russia.
– Democracy in the Russian Federation led to the ability to elect governors and mayors of cities, candidates spent huge sums to win elections and then returned them in multiples through fictitious contracts and other machinations. Putin changed this by recommending trusted people using his authority who win elections, as a result, over the past ten years, infrastructure, parks, lawns and the like have seriously improved.
– Prices for food, gasoline, electricity and utilities are low.
Therefore, attempts to raise protests and discontent with the government are doomed to failure.
The US government is acting stupidly by introducing sanctions against the use of dollars in international settlements with Russia (other sanctions may be appropriate), this undermines the position of the dollar, leads to a refusal to use it in international settlements, countries reduce their positions in dollar assets in the USA.
Support for the authoritarian undemocratic government of Ukraine can lead to a third world war with the use of nuclear weapons. Why not democratic? – because in Ukraine everyone who does not support the government was either imprisoned or simply killed and buried in forest plantations secretly. There is no opposition in the country. The recruitment agencies of the armed forces catch men on the streets, beat them and send them to war. Don’t believe me? – watch videos from Ukrainian telegram channels, they are filmed by Ukrainian citizens, in every city in Ukraine there are many such channels (where people share news, current events and problems) you can find them yourself using Google or Yandex search, at the end of the post I will drop a couple of links, by scrolling through them you can see scenes from life, as well as warnings about where the “little green men” (catchers of men) conduct raids.
https://web.telegram.org/k/#@news_kramatorsk
https://web.telegram.org/k/#@ASupersharij
Opritov- “Russia was forced to start a war in 2022 due to the danger of Ukraine joining NATO and the appearance of missile launchers on its border. The condition for refusing to attack was an ultimatum that Ukraine would not join NATO.”
Finland joined NATO in April 2023, after applying in May 2022 in response to Russia’s invasion of Ukraine
Sweden joined NATO in March 2024, after applying in May 2022 in response to Russia’s invasion of Ukraine
Ukraine has struck more than 400 Russian targets with HIMARS
Ukrainian forces have hit a Russian air defence battery on Russian territory in what is thought to be the first use of US-made HIMARS rockets since Biden allowed their use in cross-border Ukrainian attacks.
“During a December 2021 phone call between U.S. President Joe Biden and President Putin, “Putin told Biden that Ukraine’s bid to join NATO must be denied in return for assurances that Russian troops would not carry out an attack.”[2] NATO’s General Secretary Jens Stoltenberg rejected Russia’s demand that it reverse its 2008 pledge to allow Ukraine to join NATO. “NATO’s relationship with Ukraine is going to be decided by the 30 NATO allies and Ukraine, no one else.”[3]”
https://en.wikipedia.org/wiki/Red_lines_in_the_Russo-Ukrainian_War
“On 26 January 2022, NATO and the U.S. issued their formal response to Russia, in which they rejected demands that Ukraine never join NATO and that the alliance withdraw its forces from Eastern Europe; the confidential document was later published by El País.[15] It called on Russia to withdraw forces from Ukraine, Georgia, and Moldova, and discussed a potential transparency mechanism to confirm the absence of U.S. Tomahawk cruise missiles at two Aegis Ashore sites in Romania and Poland in exchange for transparency at two ground-launched missile bases in Russia.[16] Other areas indicated for negotiation were a potential revival of the Intermediate-Range Nuclear Forces Treaty, and new mutual rules limiting the size and locations of military exercises.[14] Alexander Gabuev, director of the Carnegie Russia Eurasia Center, later recalled that Russian diplomats were “pleasantly” surprised with the proposals and believed that they could achieve agreements which would strengthen Russian security, but that the Kremlin was uninterested.[4]
On 17 February, the Russian Ministry of Foreign Affairs published a response in which it stated that the NATO and U.S. proposals were not “constructive” and that both parties continued to ignore Russia’s “red lines and core security interests”, and threatened that Russia would be forced to respond through the implementation of unspecified “military-technical measures”.[16] One week later, on 24 February, Russia launched a full-scale invasion of Ukraine.[4]”
https://en.wikipedia.org/wiki/December_2021_Russian_ultimatum_to_NATO#:~:text=The%20proposals%20included%20a%20ban,in%20Central%20and%20Eastern%20Europe.
Russian Airbase Bombarded in Syria by Israel
Crimea is Ukraine
Luhansk is Ukraine
Donetsk is Ukraine
Zaporizhzhia is Ukraine
Kherson is Ukraine
These oblasts have NEVER belonged to russia.
1991 borders MUST be returned.
International Law is the LAW.
It’s the law that russia signed up to until it didn’t suit their agenda.
Hantingtonbech I agree with everything except this:
“Crimea is Ukraine.
Lugansk is Ukraine.
Donetsk is Ukraine.
Zaporozhye is Ukraine.
Kherson is Ukraine.
These areas NEVER belonged to Russia.
The 1991 borders MUST be returned.
International law is LAW.
It is the law that Russia signed up to until it became consistent with its agenda.”
—–
Ukraine as a state never existed before 1991. V.I. Lenin created this country as part of the USSR in 1922, but it was not an independent state, but rather was like the state of California in the USA.
The territory of Ukraine until the 16th century was inhabited by a sedentary population only in the northwest, the entire steppe southern and eastern region belonged to nomads, whose economy was based on the trade of Slavic slaves (Russians and ancestors of modern Ukrainians). After the conquest of Crimea by the Russian Empire, the left bank of the Dnieper was populated alternately by Russians and Ukrainians, and the coast of the Black Sea in these areas also by Jews from the region of Belarus. Crimea was populated exclusively by Russian people, large diasporas of Armenians and Greeks living in Crimea, by order of Empress Catherine II, moved north to the Donbas region, since then there are many toponyms associated with these peoples. To describe this process in detail would require the volume of several books. People living in the east and south of Ukraine, including Kyiv, used exclusively Russian in communication; President Zelensky, as far as I know, never used Ukrainian in his speech before his election. Now this language is banned. The Ukrainian Gestapo has organized “language patrols”. You can even consider the moon and Mars as Ukraine. I must admit that the form of the ultimatum about Ukraine’s non-accession to NATO in 2022 was in itself unacceptable to the United States, since accepting it meant “losing face”, although before that they wanted to agree on acceptable terms behind the scenes, secretly. Russia was making compromises. The Russian Federation hoped to get by with little bloodshed, relying on its supporters in Ukraine, following the example of the annexation of Crimea. Let me remind you that in the defeated rear columns of Russian troops in 2022, traveling to Kyiv, there were trucks filled with shields and batons to disperse protesting demonstrators. But everything did not go according to plan, they had to be changed, the intelligence service and analysts did a poor job. Nevertheless, I would like to know the plans of the parties or at least assume what could happen in the future. Do you probably think that Ukraine will win on the battlefield? – I think this will not happen, most likely NATO contingents will appear on the battlefield, yes, they have already been there for a long time, but there will be noticeably more of them. If the Russian Federation begins to lose on the battlefield, it will use tactical nuclear weapons, and perhaps anticipating that there will be a symmetrical response, it will think about whether to strike with all available nuclear forces at once before NATO hits them? Is that what you want? YES? When will this madness end?
If you expect that Russian citizens will revolt against the government, you are deeply mistaken. If the country’s economic situation worsens and the standard of living deteriorates catastrophically, then the country will simply switch to a mobilization economy, close its borders, introduce food stamps, switch to mobilization using the Ukrainian method, but will NEVER cede the conquered territories.
Just continue to consider them Ukraine, in fact, Russia will be there.
I am not very knowledgeable about “international law”, but you are writing nonsense – the USA has never taken these conventions into account, they bombed and turned cities and relatively prosperous countries into chaos and ruins. All countries will act as their capabilities allow.
And yes, I have never heard or read “International law is a LAW.
This is the law that Russia signed,”
Where can I see this signature?
U.S. Shale Hits Snooze
U.S. oil and gas production growth has slowed down in the third quarter, with oil activity modestly rising while gas production declined significantly.
Industry executives predict a shift to higher oil prices in the medium term due to reduced U.S. shale output.
Some experts argue the U.S. shale revolution has peaked, with further major production gains unlikely without a significant price increase.
US July production down 9 kb/d to 13,205 kb/d
Flat since September.
I hate to nitpick, but I get June 13,230 to July 13,205 thousand barrels per day. That’s 25 kb/d. I suppose it’s the June revision that you overlooked.
Ron
Thanks. 230 is correct. It was updated in the top line but forget to update it in the line that plots the data.
Gentlemen, if I may.
All these debates are useless. They are interesting, to be sure, I won’t deny that. I’m not going to advocate for stopping them. But still useless.
Basically, we and the system are in midlife. When you are in midlife, half the people say “no, we are still growing, doing great, fit and active, making money, everything is awesome” and half the people say “no, any day now we are going to die, we are doing terrible, etc”
And the truth is somewhere in between. The system is still in midlife. It will remain in midlife until maybe 2030s at earliest, 2050s at latest, I imagine. Then 2050s and later, it will be in old age. It will no longer be able to be denied.
So all you declinists are 100% right, but you are ahead of the curve. It is absolutely going to happen, guaranteed, but it just isn’t happening yet. Which gives room for the optimists to continue to be right, temporarily.
SGP,
It is worth some discussion so we act. I agree for oil we will likely peak around 2030, my expectation is that with a transition to electric land transport we reduce demand from 2030 to 2050 so that oil supply may not be a big issue over that period. Natural gas and coal can be gradually replaced with wind, solar, hydro, nuclear, and perhaps some geothermal energy, heat pumps will reduce energy needed for heating water and buildings. There is much that can be done, but it needs to be done. Only the realization of future potential problems will create the will to get the job done IMHO.
There are solutions to energy problems, which are actually improvements over FF. Their implementation is happening, but not as fast as needed. In a properly regulated free market economy their implementation would be easier and faster.
But, there are always winners and losers during change. That includes many of the inhabitants of the FF industry and closely related industries. Understandably they are resisting change.
So, we can’t be complacent. Change requires hard work: communication, education, political work, etc.
The most pertinent data on peak oil and decline resides within the inner circle that has intimate knowledge about Ghawar, which has long been considered a bounty without end. In truth it has been seawater flooded for decades, until the current water cut is said to be well above 50%. Ghawar has far exceeded its EUR, mainly due to highly technical water flooding and horizontal extraction. When Ghawar goes, it will be a shock to the system of international oil markets. Complacency will be upended by sheer panic.
Similarly, the LTO basins are in decline. The Permian has its own issues with water cut, which is up to 12:1 in some wells and almost always over 4:1, and increasing seismic events have made produced water disposal much costlier and trickier. The gas cut has gone up too, and with prices bottomed out, the 50% hydrocarbon stream that is NG and NGL’s has made profitability iffy. Because the landscape was drilled frantically, using 3-mile allocation laterals whenever possible, and DUC’s were strewn everywhere as a marketing strategy, the Permian showed a substantial gain last year–which is not sustainable unless the price of NG goes up drastically. In fact, with the higher decline rate of those 3-milers, it’s going to be hard to hold production flat.
Using these harsh optics, the coming oil supply shock could occur sooner than expected. The Saudis almost never say exactly what they’re thinking, but rather make circuitous statements of fact. The oil minister has been saying for some time that unless new capital is expended there is going to be a severe supply shock. This was Saudi-speak for Ghawar is on its last legs and we cannot be counted on for extra capacity in the future.
In a perfect world, electrification of land transport and greater contribution of renewable energy would even out a gradual decline in global oil production. But no one saw how fiercely AI demand would hit us. Every time Nvidia makes a new chip breakthrough it multiplies the demand for electricity. Microsoft is aggressively buying up nuclear (Three Mile Island) and renewables supplied electricity (Europe), but this is not going to be nearly enough. In all other human endeavors it was possible to slow down and coast; not so with AI, because whoever has the best machines wins the economic and possibly the survival game.
The poster above was right, this is all just an exercise. But it could be an existential one, because the end is almost certainly not going to be a soft landing. In fact, with all the propaganda and preening and posturing, it seems ever more likely to come at us hard and fast.
Gerry,
Last I heard (this was a few years ago) Ghawar was producing about 3.5 Mb/d, this might be down to 3 or even 2.5 Mb/d today, if it is 3 Mb/d that is about 4% of World output, if it crashes prices increase, more supply comes online and demand decreases due to higher prices. It might not be as big an issue as some believe it will be. We will have a better idea when OPEC unwinds its cuts. If we don’t see Saudi output increase then you will be proven correct.
It’s the available oil exports on the market that is going to matter. There will still be a lot of oil being produced when exports go to zero.
You can’t demand something that just isn’t there. You’ll just have to make do with what energy is available domestically if there are no exports.
But before exports hit zero there will be entire countries taken off oil as those exports shrink.
Can you imagine cleaning up after a natural disaster like a hurricane without oil?
I’m about 500 miles from where hurricane Helena made landfall. And my power will be out for a week. That is with all the heavy diesel trucks working around the clock. I’m very thankful for oil powered machines.
Wait till a typhoon hits California after all cars and trucks are mandatory EV’s
HHH,
So far crude oil exports have held up just fine and fewer crude oil exports are needed as the US net imports of crude were reduced by about 7.5 Mb/d from 2005 to 2023. As the world transitions to electric transport fewer imports of crude oil will be needed. In an emergency diesel or natural gas generators can be used to produce electricity, doubtful that construction equipment or farm tractors will be electricity driven in the near future, what technology will bring in 30 to 50 years is difficult to guess.
I didn’t make myself clear: I think that Saudi Arabia can rise to the occasion and produce more strongly, as they’ve had several new discoveries in the Empty Quarter lately. They have excess capacity.
But one day soon the whale Ghawar is going to fail: the water cut has become too great for it to keep on. And these new finds are not big enough to take up the slack.
My ultimate point actually is that I believe the oil shale basins in America and the old standby in Saudi Arabia are going to decline almost in lockstep. And while I don’t want to beat this to death, I personally think that’s going to happen more precipitously than is commonly factored in. In other words, I don’t buy the prognostication put out by the IEA.
Gerry Maddoux,
Thank you for your comment. A couple of questions.
1. Do you know whether Saudi’s lift costs have gone up, due to these EOR activities. There is a debate now whether the Saudis should try another market share war. The prince’s ambitious projects require very high fiscal income, but if you do the math, going from 9 MMbpd now, to say 10.5MMbpd and suppressing the price to $60 as the banks predict, would not help with revenue. On top of that if the lift costs have gone up, the gross income generated would be hit even harder.
2. Where do you see Western Siberia going? I think it is as tired as Ghawar and Permian, if not more…
To the above:
1) I doubt that the Saudis’ lifting costs have gone up much. They have been drilling these horizontal seawater injection wells around the periphery of the Ghawar field for at least twenty-five years. The amount of source rock that produced that giant field is not enormous, but it was exceptionally oil-dense and porous (over 30%), allowing for easy migration and entrapment within a giant bow-shaped oil trap with nearly horizontal bedding planes, so the injected water chases oil out of the rock very readily. They turned this into essentially a “water-lift” system, with more and more injected water raising the oil level. Within the Ghawar oil trap are many oil wells surrounded by many (deeper) water injection wells. The water cut can be adjusted by plugging the oil wells that are bringing up excess water. This is a seventy-year-old field, and even though the water cut at the separation plant can be adjusted by eliminating these exhausted wells one by one, it has to be getting pretty watered down all along that oil trap. The addition along the way of the Safaniya and Abqaiq fields has evened out decline, but they too are getting old.
2) As I understand it, global climate change has thawed the permafrost and the infrastructure is turning into mush. Giant methane eruptions are occurring in the area below the Siberian Traps, and that number was recently about to hit thirty. The amount of methane gas erupting into the air is just immense. I think that’s turning into a wasteland.
I want to clarify that I’m no expert on international oil fields–they have just interested me all my life. And I’m no alarmist either. But when you look at what’s happening to global oil, taking each major production entity and examining it in granular detail, Guyana is the only one that is not in evident decline. Even the Burgan Field in Kuwait is getting long in the tooth. The CTA’s trading oil futures using algorithms have stopped even trying to factor in geopolitical events, and are trading on “fundamentals” having to do entirely with supply and demand at the moment. The IEA is in no small way trying to influence international trends in energy production and use, which is not really in their mission statement. I think these entities–the IEA forecasts and the futures traders–are dangerously interwoven. And I think society will pay a huge price when the “Big Surprise” comes. In a nutshell, I think the IEA would better serve us if they coordinated with say Saudi Arabia, getting them to ‘fess up to what is actually happening to their reserves, and also get more realistic about American shale oil, whose longevity has been horribly overblown.
“In all other human endeavors it was possible to slow down and coast; not so with AI, because whoever has the best machines wins the economic and possibly the survival game.”
That is what it looks like to me as well. Its a huge new element to the game, and when it comes to energy this massively ups the imperative to move rapidly on modernization of the domestic systems….take your pick, or better yet pick them all and watch what combination works.
Its all a bet with the devil, like gunpowder has been.
1:1 Water/oil is actually pretty good. Some West Texas wells are as bad as 10:1.
There’s been a lot of speculation over the years by Peak Oilers about SA and Ghawar in particular. But the record is pretty bad. It’s been two decades since Simmons Twilight in the Desert. More than 15 years from Staniford Nosedive into the Desert. And yet, SA pumping fine…while Simmons and TOD are gone.
I realize that it’s not a fulsome report, but two very reputable American reserves accounting firms audited SA reserves and endorsed the SA reserves. Peakers wanted an independent check done. But when they got one, they disregarded it. Again, it’s fine to want more detail and to retain some uncertainty. But at least your Bayesian guess should have moved. Unless you are a biased analyst.
Ferioudun Fesharaki (quite smart) says that he personally helped ME countries make up their numbers and that there was a lot of game going on in the 80s. But he personally thinks reserves are more likely to be more than less official numbers.
“1:1 Water/oil is actually pretty good. Some West Texas wells are as bad as 10:1.”
As I’m sure you know, there’s a lot of difference between 50% water cut from injected water and water produced naturally from the well. The seawater that is used for pressure injection (like in Ghawar) is placed some depth below the oil well bore, and some distance out. Anything over a 50% cut usually means either too rapid withdrawal or, in this instance, coning of the water lift layer. As opposed, those shale wells in the Permian have a high water cut of “interstitial” water that came naturally from the pores of the rock. Comparing the two is like oranges and apples.
Good point, I guess. (I don’t really know much about wells, especially water flooded ones.)
“Good point, I guess. (I don’t really know much about wells, especially water flooded ones.)”
Obviously.
The cumulative water cut from injected seawater can be whatever the Saudis want it to be. Of the many, many oil wells that have been drilled into the large reservoir called Ghawar, whenever an old well develops a huge water cut (north of 50%), it can simply be plugged, and the water cut of the aggregate that is presented to the gas oil separation plant goes down by that measure. Plug another old well with a high water cut, bingo, the cum water cut goes down by that amount. Published data on such a process (usually a guestimate) is a moving target. My use of it was almost a neologism.
Seawater flooding is a fairly complicated process using a simple idea. Drill a horizontal bore hole on the periphery, below the depth of the oil well bore holes. Put seawater through a few steps and inject it into the peripheral injection wells under pressure. The water will be pushed through bedding planes and push oil out of the pores. Since oil floats on water, it comes up in a reasonably well composed layer. As more seawater is pushed in, the process goes on. If the oil layer from an old or less well placed oil well bore thins out, the seawater forms a cone around the bore hole, and breakwater eventually overwhelms the system and comes up in almost pure form. Thus, the water cut is individual for each oil well. The water cut at the gas oil separation plant is a cumulative of all those wells. There are some variables, as for example heated seawater is more efficient than cold seawater. A water lift system. Nothing quite so efficient. We have a lot of old water lift conventional wells in the U.S.
As to the issue of scare tactics that you hinted at repeatedly, I make my living from oil and gas. I’m here to scare no one. The thing will be what it will be. I merely got bored waiting for a phone call and wrote a little note of what was going through my mind and presto, there it was. I have no reason to engage you or take you seriously; I’m merely an old guy who is trying to keep his mind from going. I don’t really care how this goes, to be honest, because if the price of oil gets low enough, enough American and Canadian drillers will pause to let it come back to them. The abysmal price of NG is a product of over-drilling (aggressive resource depletion) of the shale oil basins, mostly the Permian, and it’s already caused some rigs to be laid down. The market is on tenterhooks, as we speak.
My sole reason for putting pencil to pen, so to speak, was to lend color to the tedious concept of the Permian Basin and the secondary basins, as that makes up only 3-4% of the world’s oil. It seemed appropriate to give a small modicum of credit to the restraint of the House of Saud, which pretty well held to the Kissinger Agreement of 1974 (and expired this year, in May or June, fifty years after the concept of the “Petrodollar.”)
OPEC still holds the power of the purse, and my suspicion is that they are measuring their production against the cost of their new dream city, Neom, and their other projects, knowing that the U.S. LTO basins are technically in decline. Some gentleman asked about W Siberia and I think they’re in decline for a totally different reason. I think the IEA is at best a highly tainted and politicized body with very little remaining credibility. And the EIA is little better.
There! That’s about the best I can do for you. Ponder it or not. I have personally pondered it for a great many years. Maybe too many.
But be assured, I’ve watched your stuff. Brilliant! Keep it up.
So, what was the source of the 50%? Citation?
Thank you Gerry, your commentary has been of great interest.
In my mind I’ve thought of Ghawar as somewhat analogous to a light that will (at some time) turn off like a switch has been flipped in comparison to the types of stacked production/decline curves we typically think about for the cumulative results of individual wells in many other fields. The way I read your commentary makes me think this analogy isn’t too far off the mark. Yes?
Still feels like bringing up an old scare, that in retrospect was a lot less ominous than implied.
Did we get some new water cut data? Or is this just rehashing the Staniford worries from almost 20 years ago?
http://www.321energy.com/editorials/staniford/staniford051807.html
And even those were based on extremely limited info, and pre 1980 data and modeling.
And here we are 2025 almost…and SA going strong. Doing a lot better than the Staniford/Hamilton peak oilers worried it would.
What is the source of saying Ghawar is currently at 50%?
“within the inner circle that has intimate knowledge about Ghawar, which has long been considered a bounty without end. In truth it has been seawater flooded for decades, until the current water cut is said to be well above 50%.”
Is this just telephone game speculation within the Peak Oil crowd, chatting together? What’s the actual source?
Marginal utility is an interesting concept, representing any specific point on the demand-supply curve. Oil producers will have to reduce internal consumption to free up exports to generate income to buy essentials not available internally. We are all on the same ship, if it is sinking bow first, the folks at the stern may be temporarily better off, but that is strictly temporary.
I first became aware of marginal utility during a visit to my wife’s home town on a tropical island. The town was not connected to the grid but did have a diesel powered generator. The generator was fired up at sunset ( 6:00 PM), ran at 220 volts for half an hour, and then went into fuel conservation mode at 160 volts until 10:00 PM, when it was shut down. Street lights consisted of 20 W fluorescent fixtures, individual homes with electrical connections also had the same fluorescent fixtures which had to be started during the half hour of full voltage. No one in town had any other electrical devices. That four hours of electrical supply represented the maximum positive marginal utility of the power system.
Going forward, I expect a lot of struggling with people and societies rebalancing their setpoints for marginal utility of the goods and services they presently enjoy.
“Oil producers will have to reduce internal consumption to free up exports to generate income to buy essentials not available internally. ”
That’s an important concept. It’s essential to the Export Land Model to assume that oil exporters will be forever insensitive to domestic consumption, but that’s very unlikely (because it’s incredibly dumb). For example, KSA is at last building solar to free up for export oil now used for electrical generation.
The 914 shows US natural gas production up more than a BCF/d to 125.6 BCF/d.
https://www.eia.gov/petroleum/production/#ng-tab
Note this is still less than the record, at 128+, for a couple months of last winter.
Prices are not great, but are decent. Prompt is close to $3. And the strip shows winter going 3+. Assuming that holds up, would expect volumes to get back to 128+ this winter. There is a fair amount of seasonality, especially with the App having limited out of basin transport (so in basin demand drives winter volume). Of course, weather is a huge unknown. A colder than normal winter could spike prices (and support more volume). Or the converse.
I usually try to factor out AK in the production–since more than 80% of that gas is put right back into the formations. AND on top of that, it can have some strange gyrations, covering up the “real” (economic, meaningful) L48 trends. But in this case last month was pretty stable from AK and slightly down, really.
Various states were slightly up, down. But the major drivers for volume growth last month were LA and PA. Perhaps responding to improved (not great, but improved) gas prices.
On the 914 oil data (Ovi mentioned above), a couple interesting aspects:
1. OH actually hit 100, for the first time.
https://www.eia.gov/dnav/pet/hist/LeafHandler.ashx?n=PET&s=MCRFPOH2&f=M
2. UT (Uinta home) continues to wiggle up. Hit a new record. And is close to 200.
https://www.eia.gov/dnav/pet/hist/LeafHandler.ashx?n=pet&s=mcrfput2&f=m
Some have claimed that oil is the “master resource”. It seems to have become less important in World GDP over the 1972 to 2023 period. The chart below looks at barrels of C plus C produced in the World divided by millions of 2010 US$ of real GDP (at market exchange rates). Since the peak in 1972 the barrels of crude plus condensate produced per million $ of real GDP produced has decreased by a factor of 2.9 by 2023. The forecast uses my Oil Shock model estimate from 2024 to 2030 and assumed World real GDP grows at 2.6% per year from 2024 to 2030.
Kdimitrov,
The chart below uses oil consumption (including NGL) and is barrels of oil equivalent (assuming 7.33 b/tonne) rather than C plus C in previous chart (where there is an error the real GDP is in 2015 US$ not the 2010 US$ shown on chart). This shows OECD, non-OECD and World, the decrease in non-OECD oil intensity from 1984 to 2023 has been a bit faster than the OECD at 2.36% per year on average vs 2.05% for the OECD, though this difference might not be statistically significant, the rates are somewhat similar. The average annual rate of decrease for World oil consumption intensity was 1.8% per year on average for 40 years from 1984 to 2023.
I use the World to avoid the problem of outsourcing of manufacturing from OECD to non-OECD so we can see the entire World. the shapes of the curves are fairly similar for OECD, non-OECD and World, the OECD looks more efficient because most of the manufacturing happens in the non-OECD and that is more oil intensive. The non-OECD may actually see a faster transition to electric transport as cheap Chinese EVs spread throughout the non-OECD, the existing fleet is smaller in the non-OECD so replacing the existing fleet is less of an issue, most growth in their fleet may be BEVs.
Dennis
It would be interesting to see a plot of C+C plus natural gas (energy equivalent) over the same period.
I was working at a startup plant in 1970, and clearly remember the purchasing manager complaining that he could not get the oil refiners to drop their price below 5 cents per gallon for bunker fuel. At that time the costs of energy from natural gas ( if available) and bunker fuel were roughly equivalent and industrial boilers often came with the capability of burning either fuel. Since that time the cost difference (on an equivalent energy basis) has been significant and natural gas has displaced oil in numerous areas.
Even today, that replacement continues. Consider an EV – when you plug an EV in to charge it that is incremental load on the utility and incremental load is generally picked up with natural gas power generation. Oil being replaced with natural gas ! Even in a Canadian province with an excess of hydro power which they export to the USA, when a resident plugs in his EV it reduces the available hydro to export and somewhere in the USA a gas turbine has to pick up the difference.
Old Chemist,
I specifically focused on oil because it is often claimed that oil is somehow very special. I agree with you it can be displaced by natural gas, coal, wind, solar, hydro, geothermal, and nuclear power. When we include both oil, NGL and natural gas for the World the intensity falls at about 1.3% per year from 1984 to 2023.
There’s a bit of a paradox: in the long run, wind and solar displace fossil fuels. Along with nuclear, their output will normally be maximized, and get top priority.
In the short run, an increase in demand will be met by gas and coal, precisely because they are less desired, which means they only partially utilized and therefore are available to answer short-term increases in demand.
A paradox.
We could also look at fossil fuel intensity of World real GDP, this falls at 1.2% per year on average from 1984 to 2023.
I also looked at the relatively high oil price period from 2004 to 2023, for the World, oil (C plus C plus NGL) decreased at an average annual rate of 1.96%, oil and natural gas consumption decreased at 1.35% per year and fossil fuel consumption (in barrels of oil equivalent) decreased at 1.46% per year from 2004 to 2023.
Dennis
Nice work!
With global GDP growing at well over 1.3% rates over that time period, and the 1.3% rate virtually a strait line up to the present, divorcing society from fossil fuels is going nowhere
A significant portion of the 1.3% is probably attributable to the evolution of the world GDP to a higher ratio of services to manufacturing .
Humans are incredibly focused on the short term.
Old chemist,
Thx. Energy consumption of fossil fuel is being replaced with consumption of other energy sources. Also note that some of these other sources have lower conversion losses from energy to work than fossil fuel so the energy requirement is reduced. A typical ICEV for example gets about 35% conversion of energy in the oil to a spinning crankshaft, A modern natural gas combined cycle power plant does better at about 50% of energy converted to electrical energy.
Dennis
Fossil fuel consumption is still increasing, year to year, but non fossil fuel energy is slowly satisfying more and more of the annual increased global demand.
Old chemist,
That is correct fossil fuel consumption has been increasing, but the majority of increased energy consumption (the delta in energy consumption) is being met by non-fossil fuel. Fossil fuel energy consumption increased by about 14 EJ from 2019 to 2023 while total energy consumption increased by 32 EJ over the same period based on data from the Energy Institute. I expect future growth in fossil fuel consumption may continue to slow and wind and solar output continues to grow much more rapidy in percentage terms. By 2030 all enrgy consumption growth is likely to come from non-fossil fuels and after that non-fossil fuel will displace fossil fuel energy. Since 2006 fossil fossil fuel consumption has grown at about 1.1% per year while non-fossil fuel energy consumption has grown at 3.5%, this rate is likely to accelerate to about 7% as rapidly growing wind and solar become a larger and larger share of non-fossil fuel energy.
Dennis why do you always leave out products??
Of the fossil fuel use increases since 2006 something like 15%-20% are products used by the modern world, coking coal, petcoke, fertilizers, plastics, polymers, explosives, herbicides and pesticides.
None of this is provided by solar and wind increases, yet plenty has to be used in the mining and manufacturing of solar, wind and batteries.
You keep thinking in simple concepts when it’s a highly complex issue with solar and wind totally relying upon fossil fuels, they are in fact derivatives of fossil fuels and we have no way to manufacturer any of them without fossil fuel inputs, nor is anyone anywhere trying to make them without fossil fuel inputs.
Dennis,
This all-world chart doesnt say much, as it is dominated by OECD GDP.
Here’s an interesting chart, shows first derivative (growth) of consumption of various fuels, as a function of GDP. You can see how at different stage of development you can get either accelerating or decelerating fuel use with GDP. This is why huge aggregate measures – total World Energy vs Total World GDP – don’t tell the story, they are just sums of divergent superimposed trends.
(Note that the lines are positive everywhere, but I do expect to see gasoline in particular starting to go negative at the very right-hand side of the chart…)
Interesting chart thanks, do you have a link to the paper?
Have you tried this with commodities, like copper?
I think you’ll find similar correlations, because a lot of things grow with the economy. In other words, the economy causes FF consumption to rise, not the other way around.
Nice chart.
It’s worth mentioning that worldwide, most demand growth for oil since 2013 came from China.
https://www.iea.org/data-and-statistics/charts/growth-in-global-oil-demand-by-region-2013-2023
That fits the chart pretty well, as they went from about $8K to about $12K. Chinese oil demand is lower this year despite continued growth, so they may be over the hump already. Hard to say based on one data point though.
Things are heating up in the Middle East. If Israel and US start bombing targets inside Iran I’d expect a sustained rise in oil prices.
At a time US consumers can’t really handle higher prices.
Seem like oil is up a tad already, from war jitters. From $67 to $70.
Supposedly Iranians hit an Iranian natgas platform in the Med. Some commenters saying Israel will take out Kharg Island. If that happens, prices will skyrocket. Not just the immediate impact (large), but the danger of overall Gulf issues.
Personally, I hope Blinken and Sullivan tell the ISR to settle down. On the back channel, is fine. But if they blow it off, in public. I freely admit to not following thing exactly, though…and sort of have divided loyalties in the whole kerfuffle. But, now is the time for Washington to curb the prodigal son. (I think.)
Israel doesn’t like being attacked with missiles from 4 directions.
If Iran pushed too far I do think Israel would consider Kharg Island export terminal as the target of choice for max economic damage to Iran. This would be extremely disruptive to world crude markets, of course.
There are many desperate people on all sides of this, just wanting a secure place to live.
Desperate people will do what it takes.
“More than 90% of Iran’s crude oil exports pass through Kharg Island”
Googling around in response to the “SA running out soon” concerns, I found this interesting master’s thesis.
https://etd.lib.metu.edu.tr/upload/12624276/index.pdf
Haven’t parsed it all, for quality or content. Not sure the kid’s data source…but it is a thesis and he is stationed in the Middle East…gotta be a little better than Staniford using pre 1980 vertical well data from one part of one field and extrapolating it. Tables B.2 (Ghawar water cut) and B.3 Ghawar production history are particularly interesting.
Overall…I just don’t get the SA scare. I mean sure, anything could happen. But how come we don’t have some retrospective on the incorrect scare from 20 years ago first? Seems like we need that (and to adjust methods in response), before just having the same scare over again. Perhaps even recycling the exact issues, concerns that didn’t pay off 20 years ago!
Nony
Nice find.
I can’t say exactly when but around 15 to 20 years ago, I saw an article that claimed that SA was pumping 7,000 kb/d of water into Ghawar and recovering 4,600 kb/d of oil. That worked out to a nice 34% water cut. Today Ghawar’s oil production is close to 3,500 kb/d. Assuming SA is still pumping 7,000 kb/d of water into Ghawar to maintain pressure, that implies that it must be close to a 50% water cut.
Table B2 is also interesting because it lists the depletion rate, which I think is mislabelled and should read “Depletion State”. As of 2018, it states that Ghawar was 63% depleted and indicates the depletion rate is increasing 1% per year. That implies that it will be getting close to 70% depleted around 2025/26. At this level of depletion one has to wonder how many more columns of water are hitting those horizontal wells. What does this mean for the water cut. Could it be higher than 60%? This is another reason why I think that SA dropped production by 1,000 kb/d to give Ghawar a chance to recover and let the water/oil interface settle down and re-establish itself
1. I’m going through the thesis. It’s not perfect, and has some general stuff. But I’m interested in his sources of data and what is modeled, what is data, in his charts.
2. Hard to engage with numerical arguments based on “I read somewhere”. If you can dig out the source, will look at it.
Nony
Trying to remember an article from 15 to 20 years ago is a bit beyond my capability. However here is something better. Assuming that the info in Table B1 is correct, it is possible to calculate the amount of daily water injected from 1993 to 2003.
In 1993, the amount of water injected was 6,500 kb/d and rose to an average of close to 7,500 kb/d from 1997 to 2003.
Assuming oil production in Ghawar today is close to 3,500 kb/d and water injection is averaging 7,500 kb/d, that means that the water cut is close to 53%. Further, assuming that Ghawar production is dropping by 2% per year, as stated by the Saudi’s, that means that the water cut is going up by close to 1% per year (70/7500=0.933%) and yes that number will get smaller every year going forward.
OK, I feel ya, babe, with the finding stuff from long ago. But, still…hard for me to consider it, given lack of source. 😉
Lot of assumptions in your calculation, but to start with,
a. What is the source of Saudis said Ghawar dropping 2% per year”?
b. Where are you getting data for water injection amounts? (Not even a criticism, just point me, please.)
c. I guess you are making the assumption that water injected must equal water out, plus oil out (multiplied by density correction)? Like a fixed volume? Perhaps reasonable, perhaps not–I’m not an expert in the hydrology. But that is what you are doing now?
FWIW, I’m still looking at the thesis. It’s not a masterpiece (uses Hubbert Linearization, says good things about Simmons…and the Turklish is a little a sticking point).
My biggest interest is probably in his sources. Does he actually have new data? How good are his sources?
Nony
Clearly the chart backs up my memory that around 7,000 kb/d of water is being pumped into Ghawar.
a) http://www.ww.nyenergyforum.net/Data/Sites/1/media/resources/OilPresEFNYC.pdf
See page 16 for Aramco’s statement on decline being close to 2%. Picture attached.
b) As noted in my response, data for injected water is from Table B1. Sample calculation using 2003 data point. Oil production 5,150. Water Cut 33%. Injected water is 5,150/0.67 = 7,687.
Also check P15 of Aramco presentation. 5,000 kb/d oil. Water Cut 32%. Injected water is 7,350 kb/d.
c) Water and oil are pretty close to being incompressible fluids. So volume of injected water must be close to volume out of oil and water. No density correction involved.
Ovi:
B.1 has produced water, not injected water.
I agree that incompressible fluid is a reasonable assumption. But oil and water have different densities. Oil is generally less. ~85% of water, for this reservoir.
I will take a look at the 2006 PPT. Thanks.
Ovi,
I reviewed the PPT. Thanks, some interesting info in there. Would just caution you.
1. That is an almost 20 year old presentation. Granted, we have very little info on SA, so have to work with what we have. But still…it’s old. Consider how much changed from 1986 to 2006. A lot could have changed from 2006 to 2026. Or even 2026 to 2046. Just unclear if 2% is the right metric.
2. Also, note that 2% is not exactly a base decline (zero drilling), which they see as 8%, but something like maintenance drilling (perhaps new side by side wells as the water flood traps some pools).
3. It’s also not Ghawar-specific, but a generalization for all their fields.
P.s. Note also that the same presentation says they reduced water cut from 35% to 32% in Ghawar, by different management of the field. So it is not an inexorable process. This isn’t to say it won’t get worse. But just…caution, it will be affected by new modes of field development. Is not a simple balloon deflating problem.
If you look at page 76, Figure 4.2, he graphs water cut % versus cum production:
The series is trending up, but not perfectly (some data scatter). He graphs a linear fit (probably all you can do given the amount of data points and the scatter).
If you think about that, it is actually nonlinear, because of how the reciprocal works in the percent calculation. At an extreme, would become non-physical (like 100% water cut, or 101% or the like). But, he does mention thinking the field would be shut in at 70%.
If we just use that regression, it’s about 40%/85BBO.
Looking at Table B.3 (and I still haven’t verified where the heck that data comes from), that has Ghawar at a bit over 80BBO cum in 2018. Figure 1.5 BBO/year since then (maybe less, but easy numbers). So that puts us at ~90 now.
Using his water cut linear regression, that would be a little north of 50%. See also the right side of Figure 7.2.
Nony
There were a series of presentations after the Simmons book. This was one of them.
I am not clear what you are questioning. Are you doubting that around 7,500 kb/d of water is being injected into Ghawar?
Nony
There were a series of presentations after the Simmons book. This was one of them.
I am not clear what you are questioning. Are you doubting that around 7,500 kb/d of water is being injected into Ghawar?
Forgot to mention that I stored this PDF in my files and that is why I knew what Aramco has said. I di not find it today doing a google search.
Ovi:
A. I have no clue how much water is being injected, which is why I asked you the source for your data. You said “Table B.1”. If you are talking about the 2019 METU master’s thesis, that table B.1 clearly has the header produced water, not injected water. These are not necessarily the same.
Produced water may be less than injected (consider a perfect sweep, with zero water cut, e.g.) or more (consider the zero injection for an unfracked, unflooded well, while still having considerable formation water).
Anyhow, as I sort of suspected, you are just confusing produced water and injected water. Too bad. I was hoping you actually had some data on water INJECTION.
B. I appreciated your sharing the 2006 presentation.
Not a big deal, but just to be precise, it’s not from Aramco corporate, but some Saudi consultancy. (But no big deal, his bio shows him in tight with the royal family…good source!)
I like the 2% figure. It is useful, if we sort of don’t have anything else (and sometimes we don’t!) But just to be clear…that’s a big thumb rule.
Maybe the most helpful thing to help your case (if you want to make one that Ghawar is hurting) is just the production history itself, which went from 2000 in 2006 to 1400 in2018 (bottom of table B.3, although I still need to check where these numbers come from!).
But even here, I would not be sanguine. The field has a history of different phases of development…look at how production grew from 1950 to 1980, reaching 2000. Then retreated for a couple decades, before getting back to 2000 c. 2006. So, it has already clearly had some major ups and downs over the years.
Nony
FYI.
“At Ghawar,’ he said, ‘they have to inject water into the field to force the oil out,’ by contrast, he continued, Shayba’s oil contained only trace amounts of water. At Ghawar, the engineer said, the ‘water cut’ was 30%.”
“The hairs on the back of my neck stood up. Ghawar’s water injections were hardly news, but a 30% water cut, if true, was startling. Most new oilfields produce almost pure oil or oil mixed with natural gas–with little water. Over time, however, as the oil is drawn out, operators must replace it with water to keep te oil flowing –until eventually what flows is almost pure water and the field is no longer worth operating.”
“Saudi Aramco is injecting a staggering 7 million barrels of sea water per day back into Ghawar, the world’s largest oilfield, in order to prop up pressure. It accounts for 30% of Saudi oil reserves and up to 70% of daily output.” “Doubts grow about Saudi As Global Swing Producer,” Aberdeen Press & Journal Energy, April 5, 2004, p. 15
Bottom line. Produced water = injected water
https://www.resilience.org/stories/2004-07-29/trouble-worlds-largest-oil-field-ghawar/
I don’t know anything about it, but oil fields are known to subside when a lot of oil is pumped out. Can’t there be some heaving as well when water is pumped in?
Nony
In table B2 he labels the column on depletion “Depletion rate” where I pointed out it is State of Depletion. Give the guy a break. Clearly while. he has a good command of the English language, he may be missing some of the subtleties.
So somehow because he calls it produced water, water is being produced in Ghawar. Please explain how that is happening. Also explain why Aramco started injecting water if if is being produced.
Sigh. Ovi, do you even understand the difference between produced water and injected water?
Produced water is the water that comes out of the three phase separator, on the surface. Almost oil wells, produce oil, natural gas, and water. There’s a slurry of little bubbles of three different phases in the moving fluid coming up the pipe to the surface. The three phase separator separates them.
https://www.youtube.com/watch?v=xgLOU4EwC0o
Injected water is exactly what the name says. The water you inject into the formation. It is supposed to go UNDER the oil and push it up. Water is heavier than oil and relatively immiscible.
https://www.linkedin.com/pulse/waterflooding-101-vanessa-glass-neal-mba/
Note, the two are not necessarily equal. A perfect “sweep” (e.g. consider a midstream crude tank) could have no produced water and lots of injected water. Conversely, plenty of oil wells (consider non water flood) have zero water injection, but still have plenty of produced water. An actual water flood well, may have some of the produced water coming from the injection. But may still get extra produced water coming from the formation also, or actually have injected water left behind (basically in the “holes” (pores) that contained oil before.
Note that water cut, refers to the PRODUCED water, not the injected water.
I’m not here to critique you. I thought you had actual data on water injection. You don’t. OK.
Permian water disposal problems might lead to lower output.
https://oilprice.com/Energy/Crude-Oil/What-Tips-the-Balance-in-the-Permian.html
From the conclusion:
Over the past couple of years, we have discussed potential limits to growth in shale, particularly in the Permian in a number of OilPrice articles. Among the issues we have reviewed are the depletion of Tier I inventory driving force behind much of the M&A activity over the last few years, the decline in drilling activity, and the role technology has played in keeping production at an elevated state. Last May we discussed the impact that rising gas production might have on oil drilling.
Thus far none of these have done more than cause Permian production to flatline. Dealing with increased amounts of produced water, and the related increasing seismicity that Christine Guerrero and the WSJ article documented may well be what tips the balance in the Permian.
Nice piece by Mr. Shellman
https://www.oilystuff.com/single-post/it-s-time-to-talk-about-the-d-word
It occurs to me that if associated gas starts to fall as I believe he states, this will tend to increase natural gas prices which will help a bit with profitability for tight oil wells, though the price of oil is a more important factor, falling tight oil output might also help increase oil prices.
Hi – Since the audit of SA reserves was mentioned above, i thought i would add a question about it. A while back, Goehring and Roezenwajg published an article claiming the following:
“In January 2019, Aramco released a summary of the report prepared by DeGolyer & MacNaughton, a highly respected Houston-based firm that incidentally oversaw the last published audit in 1979. In the summary, Aramco confirmed that Saudi’s remaining reserves totaled 263 bn bbl.
While the bond prospectus initially appeared to have settled the debate, it raised more questions than answers. First, it does not appear that DeGolyer & MacNaughton arrived at the exact figure reported in the summary. In their certification letter, included as Appendix C of the prospectus and overlooked by many, the authors disclose their audit only covered 162 bn bbl – much closer to our estimate. The remaining 98 bn barrels were never independently evaluated or verified.
Instead, DeGolyer & MacNaughton reported that nearly 45 bn bbl of Aramco’s self-reported reserves were said to be in fields too small or remote to analyze. Furthermore, another 53 bn bbl were not evaluated because they were expected to be produced after 2077 – the expiry date of Aramco’s oil concession. Although the summary strongly suggested that the auditors had independently verified Aramco’s stated 260 bn bbl reserve figure, they had only confirmed 162 bn bbl.”
Source: https://blog.gorozen.com/blog/saudi-arabias-oil-reserves?utm_campaign=Weekly Blog Notification&utm_medium=email&_hsmi=300082351&utm_content=300082351&utm_source=hs_email
I must confess this is the first time i’m exposed to this argument: has this been confirmed by other experts as well? I never read the (very long) document myself.
I remember reading the prospectus and such (not just going off headlines). So, probably not a surprise to me. But it’s been a while, so I don’t remember what I remember. 😉
They have some very long lasting fields, many have already been producing for 70 years. So, having some reserves that are more than 50 years out, is reasonable. I would think of the end of the concession as kind of a legal issue, not a technical/geological one. So, you might as well credit them with those. Then I guess you can fuss about the “too small” fields.
All in all, I’d still be very chary about going with the bet of underperformance. The history of predicting near term Saudi oil cratering has been very bad. C.f. Stuart Staniford. And for that matter the whole history of the oil business has shown reserves growth, not shrinkage (as a whole, of course cases differ).
People I follow who are in the business (e.g. Fesheraki) think the reserves are more likely an underestimate versus over.
In addition, that is an incredibly rich trend (people in the US have no clue what a real rich oil province looks like). And it doesn’t take much exploration and step out drilling to replace reserves.
I’ve been struck by the dramatically smaller level of drilling in KSA vs the US.
It seems hard to believe that a serious increase in drilling wouldn’t bring results.
Despite all the clever analyses and hand wringing in these threads about how quickly EVs are coming on line, buildout of solar or wind and how fast it is or isn’t progressing, energy intensity of GDP and the magic decoupling, all you really have to ask yourself is one thing: which year did the world consume the most fossil fuels in its entire history? Oh! This year! There’s really nothing else to say.
Exactly, all the other new products, solar, wind and batteries are just derivatives of fossil fuels. Looking over any 10 year period the use of fossil fuels continue to grow, far more than the other additions, which are also made from fossil fuels.
How much solar, wind, batteries or EVs are built without fossil fuel inputs? ZERO. How many planned new factories are going to use ALL non fossil fuels inputs?? Again ZERO…
An updated US July oil production report has been posted.
https://peakoilbarrel.com/us-july-oil-production-falls/
A new open thread Non-Petroleum has been posted.
https://peakoilbarrel.com/open-thread-non-petroleum-october-4-2024/